. 1998 Aug 24;142(4):1001-12.
doi: 10.1083/jcb.142.4.1001.

Mechanism of Cdc42-induced actin polymerization in neutrophil extracts

Affiliations

Mechanism of Cdc42-induced actin polymerization in neutrophil extracts

S H Zigmond et al. J Cell Biol. .

Abstract

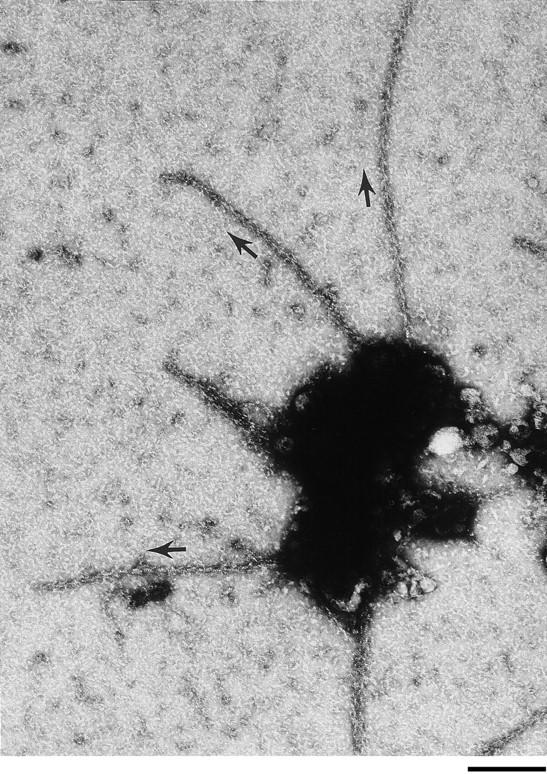
Cdc42, activated with GTPgammaS, induces actin polymerization in supernatants of lysed neutrophils. This polymerization, like that induced by agonists, requires elongation at filament barbed ends. To determine if creation of free barbed ends was sufficient to induce actin polymerization, free barbed ends in the form of spectrin-actin seeds or sheared F-actin filaments were added to cell supernatants. Neither induced polymerization. Furthermore, the presence of spectrin-actin seeds did not increase the rate of Cdc42-induced polymerization, suggesting that the presence of Cdc42 did not facilitate polymerization from spectrin-actin seeds such as might have been the case if Cdc42 inhibited capping or released G-actin from a sequestered pool. Electron microscopy revealed that Cdc42-induced filaments elongated rapidly, achieving a mean length greater than 1 micron in 15 s. The mean length of filaments formed from spectrin-actin seeds was <0.4 micron. Had spectrin-actin seeds elongated at comparable rates before they were capped, they would have induced longer filaments. There was little change in mean length of Cdc42-induced filaments between 15 s and 5 min, suggesting that the increase in F-actin over this time was due to an increase in filament number. These data suggest that Cdc42 induction of actin polymerization requires both creation of free barbed ends and facilitated elongation at these ends.


Figures

Figure 1
Figure 1
Addition of spectrin-actin seeds to cell supernatants. (A) Effects of spectrin-actin seeds and/or Cdc42 on actin polymerization. Supernatants were incubated at 37°C with buffer (open circles), spectrin-actin seeds (open triangles), 100 nM GTPγS-charged Cdc42 (closed circles) or both spectrin-actin seeds and 100 GTPγS-Cdc42 (closed triangles), for 2 or 5 min before the F-actin levels were determined by the TRITC-phalloidin staining of pelletable material (refer to Materials and Methods). For t = 0, the seeds were added after a 15-fold dilution of supernatant. Data are from a single experiment representative of three. (B) Spectrin actin seeds become rapidly capped when incubated with supernatant. Spectrin-actin seeds were incubated in supernatants for 5, 10, or 60 s before the supernatant was diluted 100-fold into 1.5 μM pyrenyl-actin. Polymerization of the pyrenyl- actin was then followed over time from the pyrenyl fluorescence (refer to Materials and Methods). For the time 0 point, the seeds were added after supernatant to the pyrenyl-actin. Data shown are representative samples. (C) Time course of capping was determined from the decrease in initial rate of polymerization. The initial rate of increase in pyrenyl fluorescence (proportional to the number of elongating filaments) is plotted versus the duration of incubation of the seeds with the supernatant. The data, expressed as percent of seed-induced initial rate at the start of incubation, are from supernatants (closed squares) at 3 mg/ml protein (as used for most experiments) or 0.75 mg/ml (closed triangles). The half-time of capping, in supernatants at 3 mg/ml, ranged between 3 and 9 s in different supernatants.
Figure 1
Figure 1
Addition of spectrin-actin seeds to cell supernatants. (A) Effects of spectrin-actin seeds and/or Cdc42 on actin polymerization. Supernatants were incubated at 37°C with buffer (open circles), spectrin-actin seeds (open triangles), 100 nM GTPγS-charged Cdc42 (closed circles) or both spectrin-actin seeds and 100 GTPγS-Cdc42 (closed triangles), for 2 or 5 min before the F-actin levels were determined by the TRITC-phalloidin staining of pelletable material (refer to Materials and Methods). For t = 0, the seeds were added after a 15-fold dilution of supernatant. Data are from a single experiment representative of three. (B) Spectrin actin seeds become rapidly capped when incubated with supernatant. Spectrin-actin seeds were incubated in supernatants for 5, 10, or 60 s before the supernatant was diluted 100-fold into 1.5 μM pyrenyl-actin. Polymerization of the pyrenyl- actin was then followed over time from the pyrenyl fluorescence (refer to Materials and Methods). For the time 0 point, the seeds were added after supernatant to the pyrenyl-actin. Data shown are representative samples. (C) Time course of capping was determined from the decrease in initial rate of polymerization. The initial rate of increase in pyrenyl fluorescence (proportional to the number of elongating filaments) is plotted versus the duration of incubation of the seeds with the supernatant. The data, expressed as percent of seed-induced initial rate at the start of incubation, are from supernatants (closed squares) at 3 mg/ml protein (as used for most experiments) or 0.75 mg/ml (closed triangles). The half-time of capping, in supernatants at 3 mg/ml, ranged between 3 and 9 s in different supernatants.
Figure 2
Figure 2
Electron microscopy of Cdc42-induced and spectrin-actin seed-induced filaments. Representative electron micrograph of negative-stained sample (left column) for: (A) 100 nM Cdc42 incubated in supernatant for 1 min; (B) spectrin-actin seeds (1.5 nM) incubated for 2 min in supernatant; (C) spectrin-actin seeds incubated for 30 s in 1.5 μM pure actin; (D) spectrin-actin seeds (1.5 nM) incubated in supernatant for 5 min in the presence of 1 μM phalloidin. Filament length distributions (right column) E–H measured for samples illustrated in A–D, respectively. The lengths of all filaments present longer than 0.25 μm were measured from photographs (equal to 4.5 mm on the photo). The data are expressed as the number of filaments on the y axis with a length equal to the value ± 0.25 μm on the x axis. Thus, all filaments with lengths between 0.25 to 0.75 μm are represented by the bar labeled 0.5, those with lengths 0.75–1.25 μm are represented by the bar labeled 1.0, etc. In each case the total filament number has been normalized to 100. Actual counts for each sample were: E, 102; F , 59; G, 175; H, 67. The mean lengths were: E, 2.1 μm; F, 0.4 μm; G, 1.1 μm; and H, 0.5 μm.
Figure 2
Figure 2
Electron microscopy of Cdc42-induced and spectrin-actin seed-induced filaments. Representative electron micrograph of negative-stained sample (left column) for: (A) 100 nM Cdc42 incubated in supernatant for 1 min; (B) spectrin-actin seeds (1.5 nM) incubated for 2 min in supernatant; (C) spectrin-actin seeds incubated for 30 s in 1.5 μM pure actin; (D) spectrin-actin seeds (1.5 nM) incubated in supernatant for 5 min in the presence of 1 μM phalloidin. Filament length distributions (right column) E–H measured for samples illustrated in A–D, respectively. The lengths of all filaments present longer than 0.25 μm were measured from photographs (equal to 4.5 mm on the photo). The data are expressed as the number of filaments on the y axis with a length equal to the value ± 0.25 μm on the x axis. Thus, all filaments with lengths between 0.25 to 0.75 μm are represented by the bar labeled 0.5, those with lengths 0.75–1.25 μm are represented by the bar labeled 1.0, etc. In each case the total filament number has been normalized to 100. Actual counts for each sample were: E, 102; F , 59; G, 175; H, 67. The mean lengths were: E, 2.1 μm; F, 0.4 μm; G, 1.1 μm; and H, 0.5 μm.
Figure 3
Figure 3
Length distribution of filaments induced by Cdc42. Supernatant was incubated in 100 nM Cdc42 for 15 s (top), 30 s (middle), or 5 min (bottom) before negative staining. Filament lengths are displayed as described in Fig. 2. For comparison between times the total number of filaments at each time was normalized to 76; actual number of filaments measured at 15 s was 76 in six photos, at 30 s was 64 filaments in three photos, and at 5 min was 406 filaments in four photos. The mean filament length at 15 s was 1.4 μm; at 30 s, 1.7 μm; and at 5 min, 1.8 μm.
Figure 4
Figure 4
Comparison of filaments induced by 800 versus 100 nM Cdc42. Supernatants were incubated with 800 or 100 nM Cdc42 for 30 s, 1 min, or 5 min before negative staining. Photographed filaments were measured and pooled as in Fig. 2. For comparison, the filament number at each time point was normalized to a total of 100 filaments. The number of photographs analyzed and filaments actually measured at each time point was: for 800 nM Cdc42 at 30 s, two photographs with total of 127 filaments; for 1 min, four photographs with 127 filaments; and for 5 min, three photographs with 198 filaments. The mean length at 30 s was 1.7 μm; at 1 min, 1.4 μm; and at 5 min, 1.6 μm. For 100 nM Cdc42 at 30 s, there were three photographs with total of 47 filaments; at 1 min, three photographs with 102 filaments; and at 5 min, four photographs with 196 filaments. The mean length at 30 s was 1.7 μm; at 1 min, 2.1 μm; and at 5 min, 1.9 μm.
Figure 5
Figure 5
Effect of Cdc42 on nucleation sites for pyrenyl actin. (A) Dose response of Cdc42-induced increase of nucleation sites. The supernatant was incubated for 5 min at 37°C with varying concentrations of GTPγS-charged Cdc42 before dilution into 1.5 μM pyrenyl-actin. The initial rate of polymerization of the pyrenyl-actin was determined from the pyrenyl fluorescence (refer to Materials and Methods). Data shown is from a representative experiment. The nucleation sites increase with concentration eventually reaching a plateau. The absolute levels of nucleation and the concentration of Cdc42 at the plateau vary somewhat with different supernatants and Cdc42 preparations. (B) Time course of Cdc42-induced increase in nucleation sites. The supernatant was incubated at 37°C with 100 nM GTPγS-charged Cdc42 for various times before dilution into 1.5 μM pyrenyl-actin. The initial rate of polymerization of the pyrenyl-actin was determined from the pyrenyl fluorescence (refer to Materials and Methods). Data shown is from a representative experiment.
Figure 6
Figure 6
Time course of filament length distributions formed in the presence of phalloidin. Supernatants were incubated with Cdc42 as in Fig. 2 but 1 μM phalloidin was present during the incubation. After negative staining and photographing, filaments were measured and pooled as in Fig 3. For comparison, the filament number at each time point was normalized to a total of 231 filaments. The number of photographs analyzed and filaments actually measured at each time point was: at 30 s, four photographs with a total of 137 filaments; at 1 min, seven photographs with 231 filaments; and at 5 min, four photographs with 143 filaments. The mean length at 30 s was 1.5 μm; at 1 min, 1.5 μm; and at 5 min, 3.7 μm.
Figure 7
Figure 7
The barbed ends of actin filaments point toward foci of polymerization. Cdc42 was incubated in supernatant for 1 min before dilution into buffer containing phalloidin followed by incubation in S-1 fragment of myosin (refer to Materials and Methods). Samples were rinsed in water before negative staining. Arrows parallel to some of the filaments indicate the orientation of the arrowheads on the filaments. The orientation of 143 filaments was determined in 34 photographs of foci from two different experiments. 75% of the filaments emanating from a focus and whose orientation could be determined had their barbed ends at the foci. Bar, 0.25 μm.
Figure 8
Figure 8
Match of models to data. The Cdc42-induced filaments that contribute to Fig. 3 are replotted here as the absolute number of filaments falling in different length categories (bar graph). Closed triangles, numbers predicted by Model 1 (refer to Materials and Methods), assuming that Cdc42 enhances the rate of profilin-actin mediated elongation by a factor fp = 4.5, compared to that seen with spectrin-actin seeds, but elongation is terminated at a rate similar to that of spectrin-actin seeds. The nucleation rate used was 0.026 nM filaments/s. A chi-square test of goodness of fit gave P > 0.1. Open circles, numbers predicted by Model 2, with no acceleration of elongation (fp = 1.0), but an increase in the duration of elongation by a factor of 4.6 (k cap = 0.025/s) compared to that of spectrin-actin seeds (k cap = 0.115/s). The nucleation rate used was 0.029 nM filaments/s. No meaningful chi-square could be calculated due to the very small predicted numbers of longer filaments at the earlier times.
Figure 9
Figure 9
A Model. Cdc42 is depicted as interacting with several factors including Nuc that creates free barbed ends and an elongation promoting factor (EP) that facilitates rapid elongation. Filament elongation is terminated by release of EP and/or addition of a capper.

Similar articles

Cited by

References

    1. Adams AEM, Johnson DI, Longnecker RM, Sloat BF, Pringle JR. CDC42 and CDC43, two additional genes involved in budding and the establishment of cell polarity in the yeast Saccharomyces cerevisiae. . J Cell Biol. 1990;111:131–142. - PMC - PubMed
    1. Allen WE, Jones GE, Pollard JW, Ridley AJ. Rho, Rac and Cdc42 regulate actin organization and cell adhesion in macrophages. J Cell Sci. 1997;110:707–720. - PubMed
    1. Burbelo PD, Drechsel D, Hall A. A conserved binding motif defines numerous candidate target proteins for both Cdc42 and Rac GTPases. J Biol Chem. 1995;270:29071–29074. - PubMed
    1. Cano M, Lauffenburger DA, Zigmond SH. Kinetic analysis of F-actin depolymerization in polymorphonuclear leukocyte lysates indicates that chemoattractant stimulations increases actin filament number without altering filament length distribution. J Cell Biol. 1991;115:677–687. - PMC - PubMed
    1. Carlier M-F, Laurent V, Santolini J, Melki R, Didry D, Xia G-X, Hong Y, Chua N-H, Pantaloni D. Actin depolymerizing factor (ADF/cofilin) enhances the rate of filament turnover: implication in actin-based motility. J Cell Biol. 1997;136:1307–1323. - PMC - PubMed

Publication types