. 1998 Aug 24;142(4):1035-51.
doi: 10.1083/jcb.142.4.1035.

Directed expression of keratin 16 to the progenitor basal cells of transgenic mouse skin delays skin maturation

Affiliations

Directed expression of keratin 16 to the progenitor basal cells of transgenic mouse skin delays skin maturation

R D Paladini et al. J Cell Biol. .

Abstract

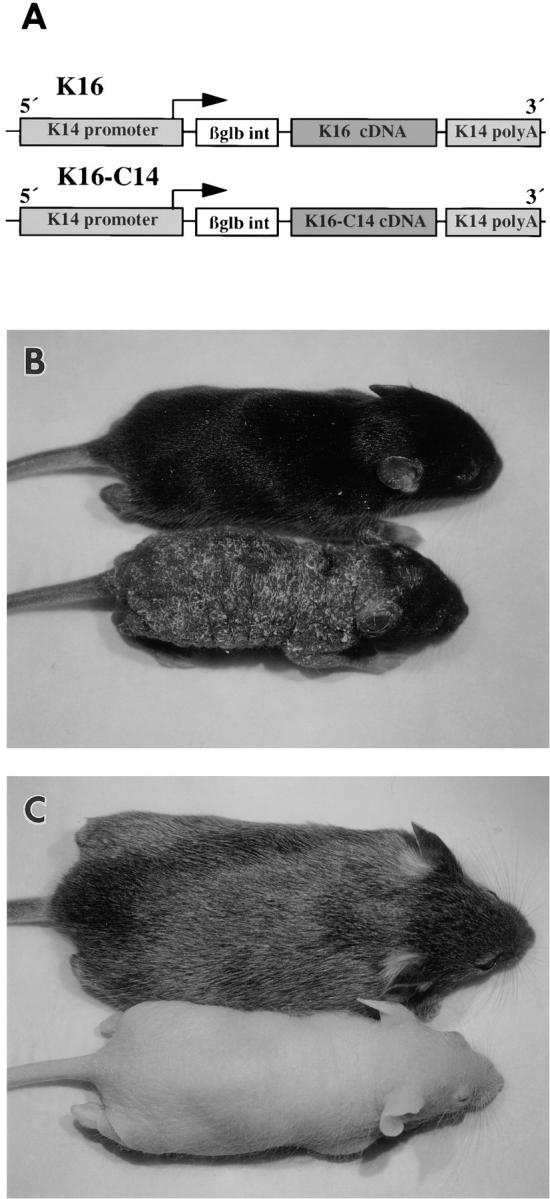
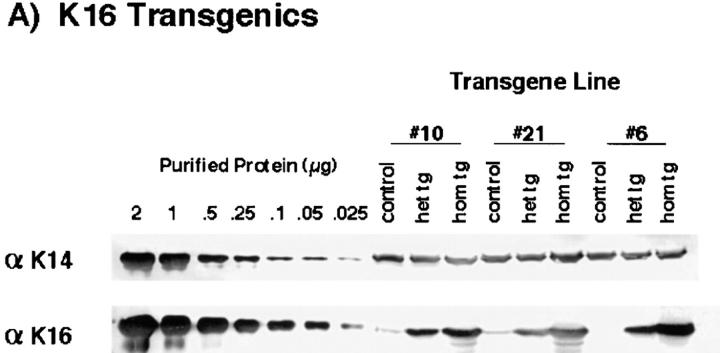
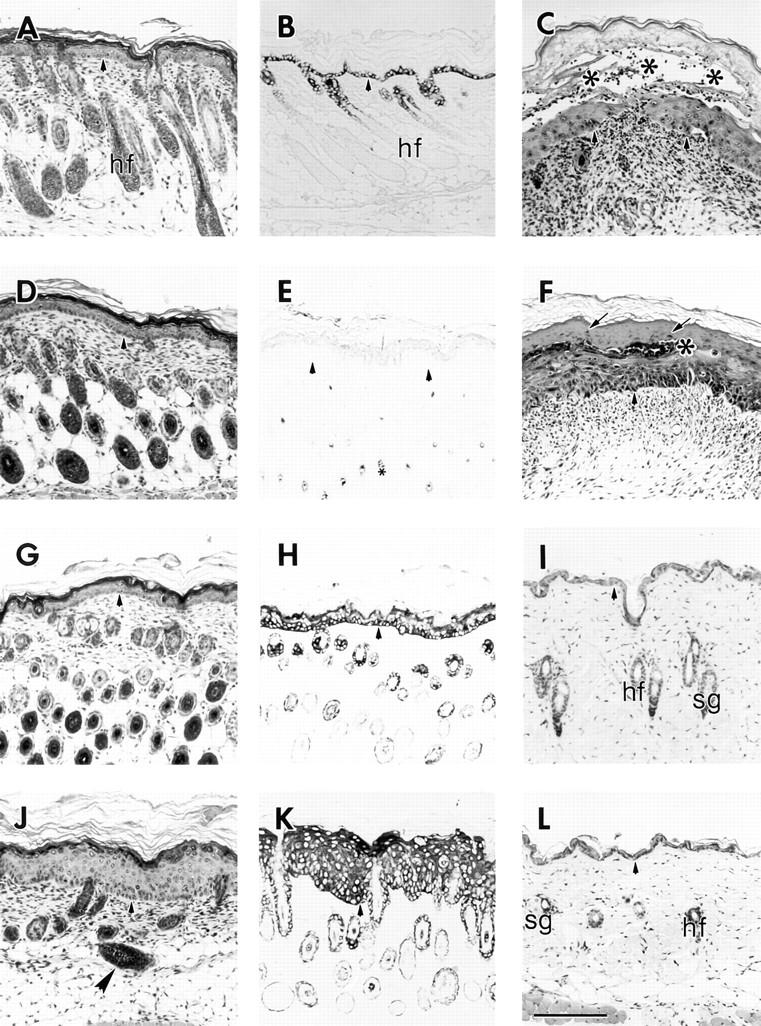
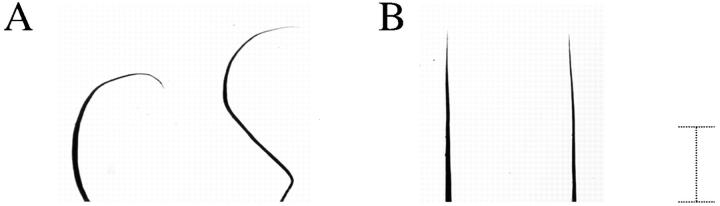
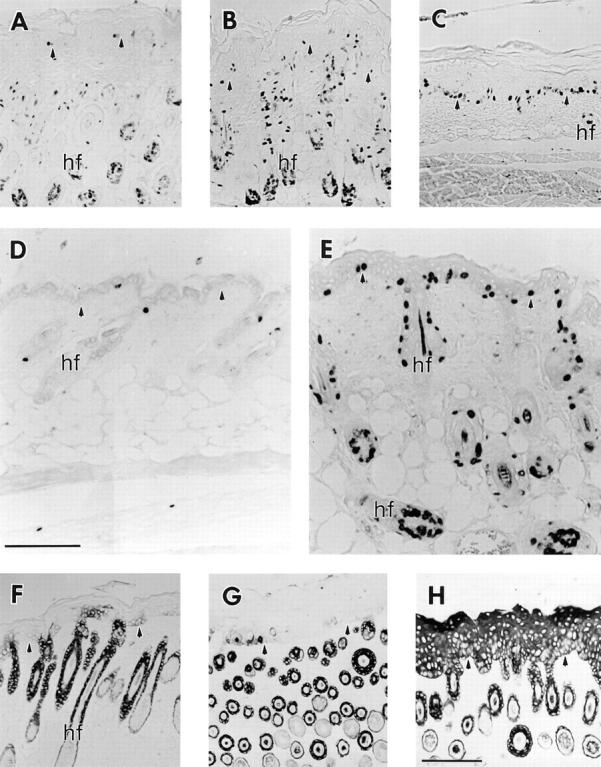
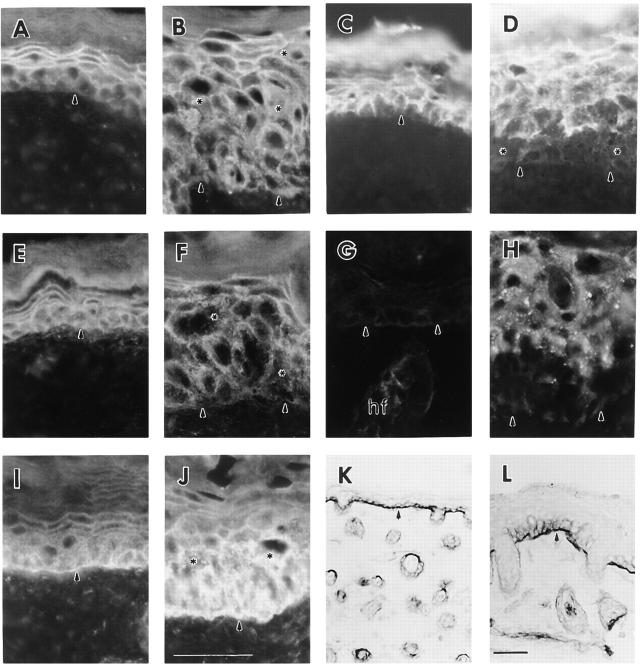
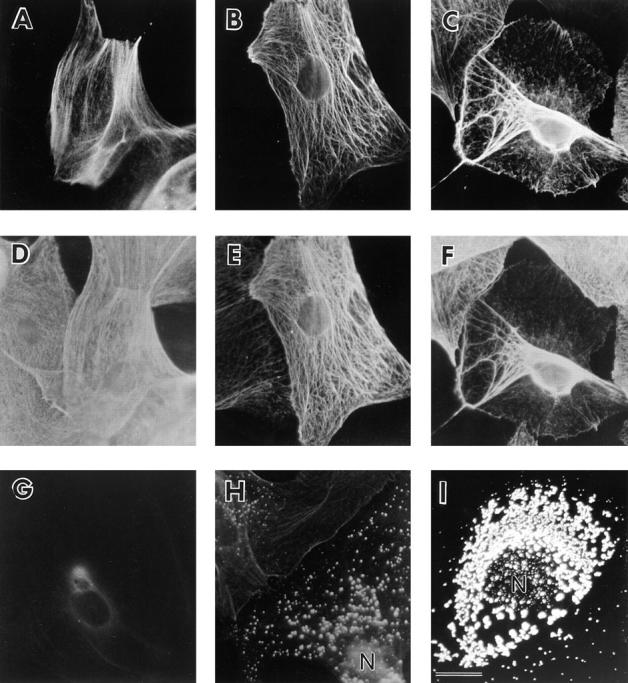
We previously hypothesized that the type I keratin 16 (K16) plays a role in the process of keratinocyte activation that occurs in response to skin injury (Paladini, R.D., K. Takahashi, N.S. Bravo, and P.A. Coulombe. 1996. J. Cell Biol. 132:381-397). To further examine its properties in vivo, the human K16 cDNA was constitutively expressed in the progenitor basal layer of transgenic mouse skin using the K14 gene promoter. Mice that express approximately as much K16 protein as endogenous K14 display a dramatic postnatal phenotype that consists of skin that is hyperkeratotic, scaly, and essentially devoid of fur. Histologically, the epidermis is thickened because of hyperproliferation of transgenic basal cells, whereas the hair follicles are decreased in number, poorly developed, and hypoproliferative. Microscopically, the transgenic keratinocytes are hypertrophic and feature an altered keratin filament network and decreased cell-cell adhesion. The phenotype normalizes at approximately 5 wk after birth. In contrast, control mice expressing a K16-K14 chimeric protein to comparable levels are normal. The character and temporal evolution of the phenotype in the K16 transgenic mice are reminiscent of the activated EGF receptor- mediated signaling pathway in skin. In fact, tyrosine phosphorylation of the EGF receptor is increased in the newborn skin of K16 transgenic mice. We conclude that expression of K16 can significantly alter the response of skin keratinocytes to signaling cues, a distinctive property likely resulting from its unique COOH-terminal tail domain.


Figures

Figure 1
Figure 1
Generation of transgenic mice. (A) Schematic representation of the DNA constructs used. The human K16 and K16-C14 cDNAs were subcloned into a modified version of the K14 expression cassette (75). The cassette features 0.6 kb of human K14 polyA sequence, the rabbit β-globin intron, and 2 kb of human K14 promoter sequence (88). Arrow, direction and initiation site of transcription. (B) Phenotype of the K16 transgenic mice at 9 d after birth (No. 21 line). Wild-type (top) and homozygous transgenic (bottom) littermates are pictured. The smaller phenotypic mouse shows an absence of fur coat and a flaky, wrinkled, and thickened skin surface. Also, the ears have not yet completely erupted. (C) Phenotype at 3 wk (No. 10 line). Wild-type (top) and homozygous transgenic (bottom) littermates are pictured. The first hair cycle in mice is complete at ∼3 wk (5, 20) and the phenotypic littermate is essentially lacking the first hair coat. The epidermis, however, is no longer flaky and wrinkled in appearance. In contrast, the K16-C14 transgenic mice have a wild-type appearance (data not shown).
Figure 2
Figure 2
Determination of the level of transgene expression in the epidermis. Urea-soluble protein extracts were obtained from the epidermides of 7-d-old control, heterozygous, and homozygous littermates from the various transgene lines. Equivalent amounts of total urea-extractable protein (20 μg) were electrophoresed via SDS-PAGE and transferred to nitrocellulose for subsequent Western blot analysis. (A) Western blot analysis of the K16 transgenics. The indicated amounts of purified human recombinant K14 and K16 were used to establish a standard curve for densitometric analysis. The LL001 antibody (71) was used to detect K14 and the 1275 antibody (82) to detect K16. (B) Western blot analysis of the K16-C14 chimera transgenics. The LL001 antibody was used to detect both mouse K14 and the K16-C14 transgene protein. Their position of migration of each protein is indicated by the arrows on the right. Purified recombinant K16-C14 was used to determine the migration position of the transgene product. (C) The three No. 21 line samples were subjected to Western blot analysis using the K8.12 antibody (this antibody is known to react with at least K13, K15, and K16). No bands of molecular weight ⪝40 kD were detected in any of the three samples. Note that a minor degradation product of the purified K16 (see D) reacts with the antibody. The lower arrow indicates the bottom of the gel. (D) The same samples were subjected to SDS-PAGE and stained with Coomassie blue. The are no significant protein products below the type I keratin cluster (⪝40 kD) and no significant differences in the total amount of keratin proteins among the three samples.
Figure 2
Figure 2
Determination of the level of transgene expression in the epidermis. Urea-soluble protein extracts were obtained from the epidermides of 7-d-old control, heterozygous, and homozygous littermates from the various transgene lines. Equivalent amounts of total urea-extractable protein (20 μg) were electrophoresed via SDS-PAGE and transferred to nitrocellulose for subsequent Western blot analysis. (A) Western blot analysis of the K16 transgenics. The indicated amounts of purified human recombinant K14 and K16 were used to establish a standard curve for densitometric analysis. The LL001 antibody (71) was used to detect K14 and the 1275 antibody (82) to detect K16. (B) Western blot analysis of the K16-C14 chimera transgenics. The LL001 antibody was used to detect both mouse K14 and the K16-C14 transgene protein. Their position of migration of each protein is indicated by the arrows on the right. Purified recombinant K16-C14 was used to determine the migration position of the transgene product. (C) The three No. 21 line samples were subjected to Western blot analysis using the K8.12 antibody (this antibody is known to react with at least K13, K15, and K16). No bands of molecular weight ⪝40 kD were detected in any of the three samples. Note that a minor degradation product of the purified K16 (see D) reacts with the antibody. The lower arrow indicates the bottom of the gel. (D) The same samples were subjected to SDS-PAGE and stained with Coomassie blue. The are no significant protein products below the type I keratin cluster (⪝40 kD) and no significant differences in the total amount of keratin proteins among the three samples.
Figure 3
Figure 3
Light microscopy of the skin of control and transgenic mice. 5-μm paraffin sections from mice were counterstained with hematoxylin and eosin (H & E) or were subjected to immunostaining using the HRP procedure (No. 6 line). (A, D, G, and J) H & E–stained section of trunk skin from 7 d mice are shown. The epidermides of a homozygote chimera (A), a control wild-type (D) and a K16 heterozygote (G) have a comparable thickness and similar hair follicle profiles. The epidermis of the K16 homozygote (J) is significantly thickened compared with the others and there is a reduction in the number of hair follicles. Some of the follicles are also incorrectly oriented (large arrowhead). (B, E, H, and K) Immunohistochemical detection of the transgene in skin section from 7 d chimera homozygote (B), control wild-type (E), K16 heterozygote (H), and K16 homozygote (K). The LL001 antibody was used to detect the chimera transgene (B) and the 1275 antibody to detect the K16 transgene (E, H, K). The chimera transgene expression is correctly restricted to the outer root sheath of hair follicles and the basal layer of the epidermis. Control skin (E) shows no expression of human K16 (small asterisk, melanin granules in hair follicle profiles) while the K16 heterozygote (H) features the correct regulation of the transgene. The K16 homozygote (K), however, shows K16 expression throughout all layers of the epidermis. (C) H & E staining of 7 d ventral skin from a K16 homozygote that features blistering. Note the large blister (asterisks) that occurs within the suprabasal layers of the epidermis. (F) H & E of ventral skin from the same mouse that features parakeratosis. The arrows indicate parakeratotic nuclei and the asterisk denotes a Munro microabcess, a common feature of psoriasis. C and F also illustrate the presence of a large dermal infiltrate suggesting an inflammatory response. (I and L) H & E staining of 41 d dorsal skin from a wild-type control (I) and K16 homozygote (L), (No. 10 line). Note that at this age the epidermides of the two mice are of comparable thickness. hf, hair follicle; sg, sebaceous gland. Arrowheads, indicate the dermal–epidermal junction. Bar, 100 μm.
Figure 4
Figure 4
Light microscopy of hair from control and transgenic mice (No. 10 line). Dorsal hairs from a 41-d-old wild-type and homozygous transgenic litter mate were placed on slides, coverslipped, and examined using light microscopy. Control hairs (B) are long and straight whereas the hairs from the homozygous littermate (A) are shorter and feature distal ends that are curved and sickle shaped. Bar, 100 μm.
Figure 5
Figure 5
Immunolocalization of epidermal differentiation markers in the skin. 5-μm paraffin sections were stained using the HRP procedure (No. 21 line). (A–C) Expression of K14 in the chimera homozygote (A), wild-type control (B), and K16 homozygote (C). K14 is properly expressed in the basal layer of the epidermis and the outer root sheath in the two controls. However, in the K16 homozygote (C), the expression is now detected primarily suprabasally. (D–F) Expression of K10 in the chimera homozygote (D), wild-type control (E), and K16 homozygote (F). K10 is properly localized to the suprabasal layers of the epidermis in all three samples. Expansion of K10 expression in F is due to the increased thickness of the suprabasal layers. (G–I) Filaggrin expression in the chimera homozygote (G), wild-type control (H), and K16 homozygote (I). Filaggrin is expressed in the granular layer of the epidermis in both G and H. In the K16 homozygote (I) some areas of agranulosis are observed (large asterisk) along with ectopic spinous layer expression (arrows). Arrowheads, dermal–epidermal junction. hf, hair follicle. Small asterisks, melanin granules in hair follicle profiles. Bar, 100 μm.
Figure 6
Figure 6
Immunolocalization of hyperproliferation markers in the skin. Mice were injected with BrdU 2 h before sacrifice, and samples from dorsal trunk skin were paraffin-embedded, sectioned, and immunostained using the HRP procedure (No. 6 line). (A–C) Trunk skin from a 7 d chimera homozygote (A), a wild-type control (B), and a K16 homozygote (C) were stained with an anti-BrdU antibody. The two controls (A and B) exhibit low labeling in the epidermis while the hair follicles are highly labeled. In the K16 homozygote (C), however, the follicles show little mitotic activity while the epidermis is highly labeled. (D and E) Skin from 21-d-old wild-type control (D) and a K16 homozygote (E) stained with the anti-BrdU antibody. Note that the control shows very little labeling in both the epidermis and the telogen stage hair follicles. In contrast, phenotypic epidermis still features high mitotic activity and, in addition, the anagen stage hair follicles are now highly labeled. (F–H) Trunk skin from a 7-d-old chimera homozygote (F), a wild-type control (G), and a K16 homozygote (H) were stained with an anti-K17 antibody. K17 expression was restricted to the outer root sheath of hair follicles in the two controls (F and G). In the K16 homozygote, however, K17 expression was detected in all layers of the epidermis. Arrowheads, the dermal–epidermal junction. hf, hair follicle. Bar, 100 μm.
Figure 7
Figure 7
Transmission electron microscopy of phenotypic transgenic mouse epidermis (No. 6 line). Ventral skin was isolated from 6-d-old wild-type control and K16 homozygous littermates and processed for electron microscopy. (A and C) Low magnification of epidermis. While all layers of the epidermis can be visualized in the control (A), only the basal and spinous layers can be seen in the phenotypic epidermis (C), underscoring the dramatic difference in thickness between the two. (B and D) Basal cells shown at higher magnification. (B) Control mouse epidermis. (D) Phenotypic K16 transgenic mouse epidermis shown at the same magnification. Note the elongated shape of the basal cells, the bundling of keratin filaments (kf), cytoplasmic areas devoid of keratin filaments (large asterisks), and the numerous gaps between cells (small asterisks). The inset shows electron dense inclusions in mitochondria (short arrows) near the nucleus of a suprabasal cell. Large arrowheads, the basal lamina. Small arrowheads, desmosomes. ba, basal layer; sp, stratum spinosum; sg, stratum granulosum; sc, stratum corneum; Nu, nucleus; m, mitochondria; kf, keratin filaments. Bars: (A and C) 10 μm; (B and D) 2 μm.
Figure 8
Figure 8
Immunolocalization of cell adhesion molecules in the epidermis (No. 10 line). 8-μm frozen sections of skin from control (A, C, E, G, I, and K) and K16 homozygote littermates (B, D, F, H, J, and L) were used for the localization of cell adhesion molecules by indirect immunofluorescence. For the α6 integrin the HRP method was used. Sections were stained for Desmoplakin (A and B), E-cadherin (C and D), β-catenin (E and F), Connexin 26 (G and H), α3 integrin (I and J), and α6 integrin (K and L). Desmoplakin staining in the homozygote was not only reduced at regions of cell– cell contact but was also prevalent in the cytoplasm of cells (asterisks, compare B and A). E-Cadherin was absent from the basal layer of the homozygote (asterisks in D) and was more disorganized suprabasally compared with control (C). The results of the β-catenin staining were similar to those obtained with desmoplakin with the additional fact that staining seemed reduced in the basal layer of the homozygote (asterisks, compare F and E). Connexin 26, which is normally expressed in the hair follicle (arrow) and not the epidermis (G) in control skin, was dramatically induced suprabasally in the homozygote (H). Expression of α3 integrin extended suprabasally (asterisks) in homozygous epidermis (J) as opposed to its normal basal expression in control (I). α6 integrin expression appeared comparable between homozygous (L) and control (K) epidermis with the possible exception of increased lateral and apical staining of basal cells in the homozygote. Arrowheads, the dermal–epidermal junction. hf, hair follicle. Bars: (A–J) 50 μm; (K and L) 50 μm.
Figure 9
Figure 9
Immunofluorescent analysis of keratins in cultured primary mouse keratinocytes (No. 10 line). Keratinocytes were isolated from the epidermides of newborn control, K16 heterozygote, and K16 homozygote littermates, cultured, and processed for indirect, double-immunofluorescence to analyze the keratin filament networks. (A–C) Keratinocytes from wild-type control (A), heterozygote (B), and homozygote littermates (C) were stained with the 1275 antibody to detect K16. (D–F) These same cells were double stained with the LL001 antibody to detect K14. A low percentage of wild-type cells express a keratin that is recognized by the 1275 antibody (A). Transgene expression in the heterozygote sample was detectable in all cells (B) and colocalized with the endogenous network (E). A subset of homozygous cells (C) featured a network in which the bulk of keratin filaments were located near the nucleus. This included the endogenous keratins (F). (G–I) Wild-type (G), heterozygote (H), and homozygote (I) keratinocytes were stained with K8.12 antibody, which recognizes K16 in an aggregated form (82). A small subset of heterozygote cells (H) featured punctate staining distributed throughout the cytoplasm. In contrast, many homozygous cells as shown in I feature a much higher density of punctate staining near the nucleus. N, nucleus. Bar, 25 μm.
Figure 10
Figure 10
Determination of EGFR levels and tyrosine phosphorylation in the K16 transgenic mice (No. 6 line). Equivalent amounts (∼30 μg) of newborn skin lysates from control, heterozygous, and homozygous K16 transgenic littermates were electrophoresed via SDS-PAGE and transferred to nitrocellulose for Western blot analysis (in duplicate). Top blot, the four samples were probed with an antibody specific for the EGFR. Approximately equivalent amounts of the receptor were present in each of the samples as determined by densitometry. Bottom blot, the samples were probed with an antibody specific for phosphotyrosine. The control + EGF sample featured a strong band migrating at the same apparent molecular weight as the EGFR. The control and heterozygous samples featured faint reactivity. The homozygous sample is increased twofold with respect to the non-stimulated controls.

References

    1. Albers KM, Davis FE, Perrone TN, Lee EY, Liu Y, Vore M. Expression of an epidermal keratin protein in liver of transgenic mice causes structural and functional abnormalities. J Cell Biol. 1995;128:157–169. - PMC - PubMed
    1. Amagai M, Fujimori T, Masunaga T, Shimizu H, Nishikawa T, Shimizu N, Takeichi M, Hashimoto T. Delayed assembly of desmosomes in keratinocytes with disrupted classic-cadherin-mediated cell adhesion by a dominant negative mutant. J Invest Dermatol. 1995;104:27–32. - PubMed
    1. Bereiter-Hahn, J. 1986. Epidermal cell migration and wound repair. In Biology of the Integument, Vol. 2: Vertebrates. J. Bereiter-Hahn, A.G. Matoltsy, and K.S. Richards, editors. Springer-Verlag, Berlin. 443–471.
    1. Blessing M, Ruther U, Franke WW. Ectopic synthesis of epidermal cytokeratins in pancreatic islet cells of transgenic mice interferes with cytoskeletal order and insulin production. J Cell Biol. 1993;120:743–755. - PMC - PubMed
    1. Borum K. Hair patterns and hair succession in the albino mouse. Acta Pathol Microbiol Scand. 1954;34:521–541. - PubMed

Publication types

MeSH terms