. 1998 Aug 24;142(4):1105-19.
doi: 10.1083/jcb.142.4.1105.

Mechanisms of epithelial cell-cell adhesion and cell compaction revealed by high-resolution tracking of E-cadherin-green fluorescent protein

Affiliations

Mechanisms of epithelial cell-cell adhesion and cell compaction revealed by high-resolution tracking of E-cadherin-green fluorescent protein

C L Adams et al. J Cell Biol. .

Abstract

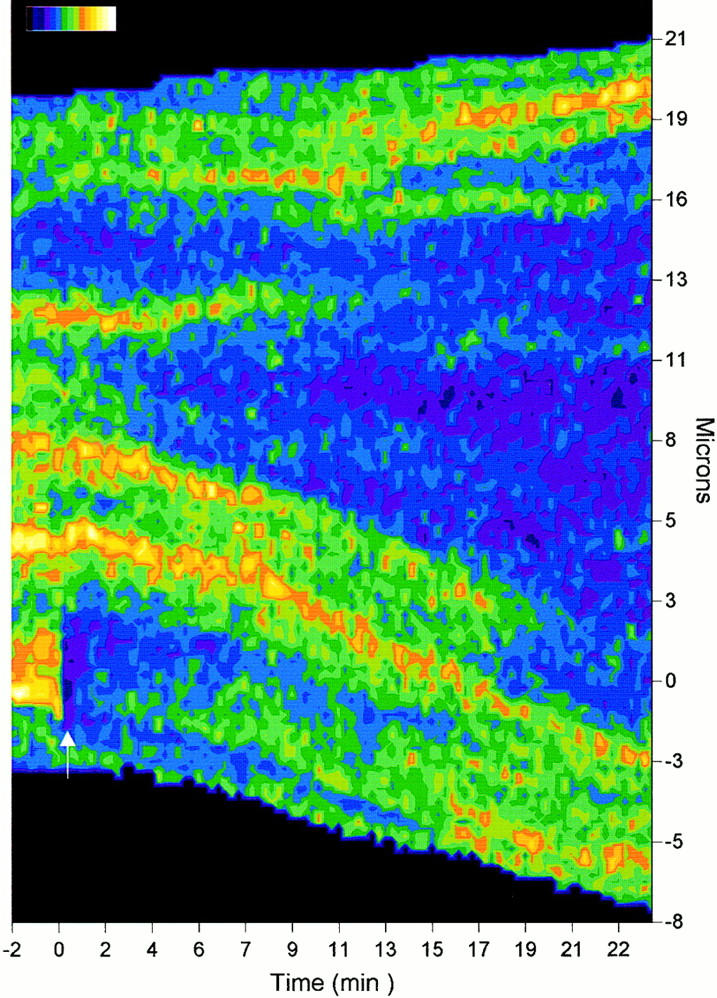
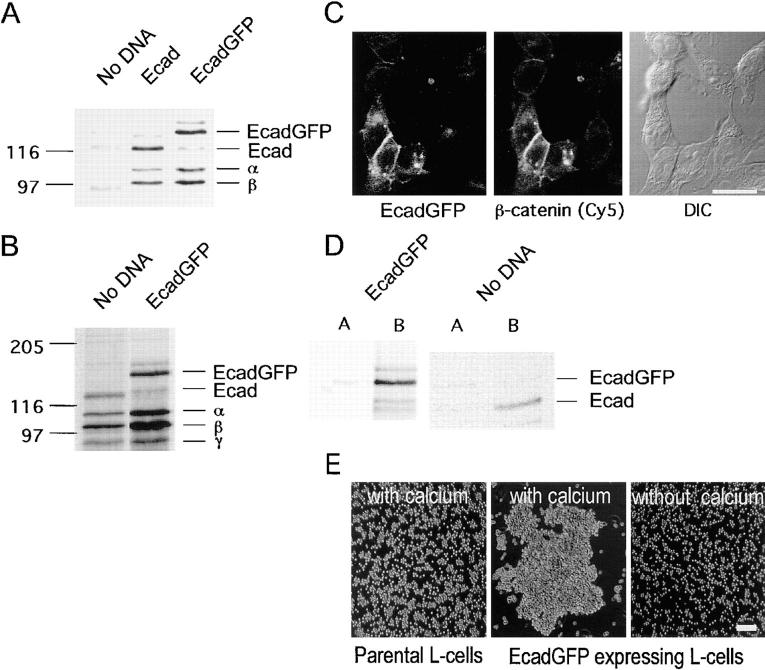
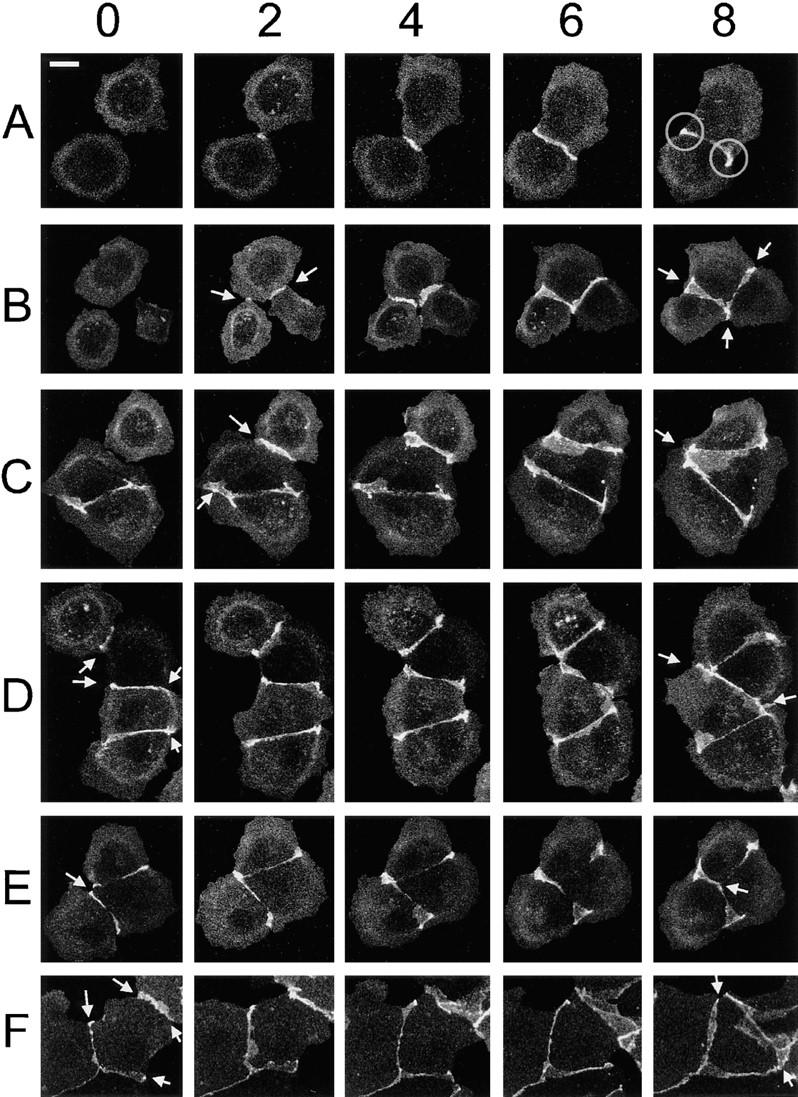
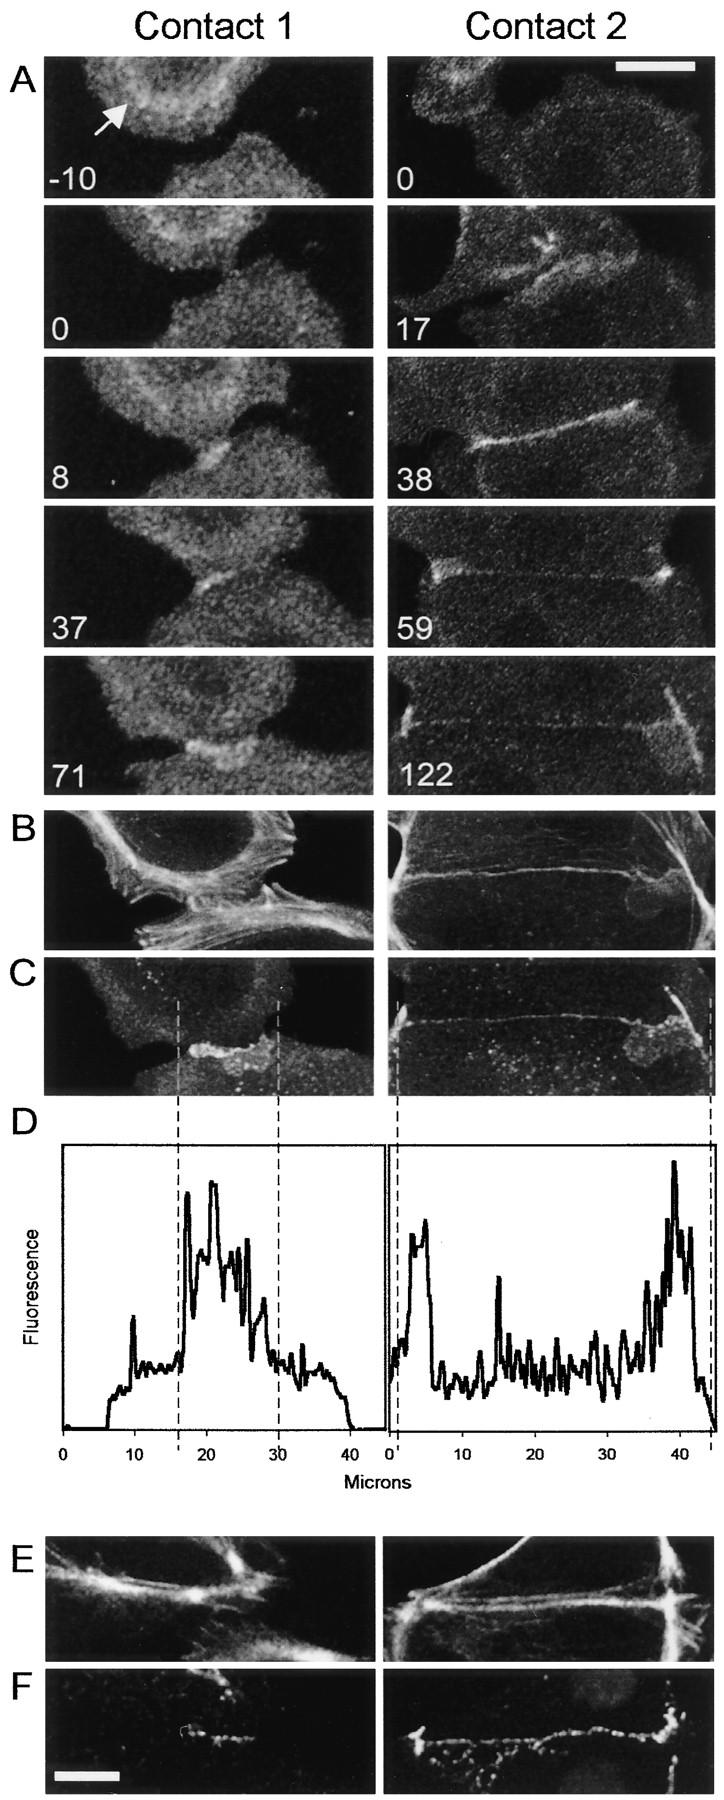
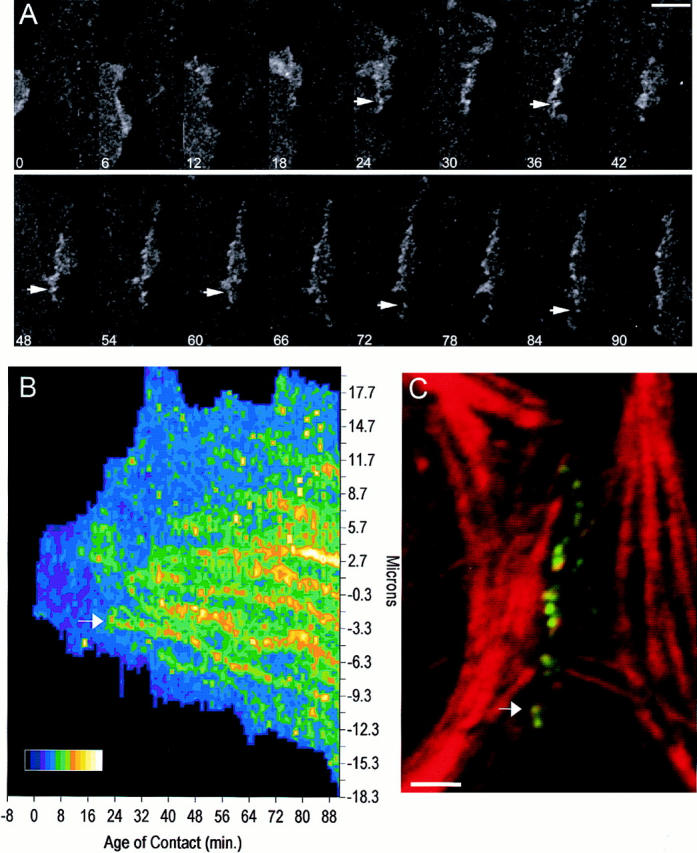
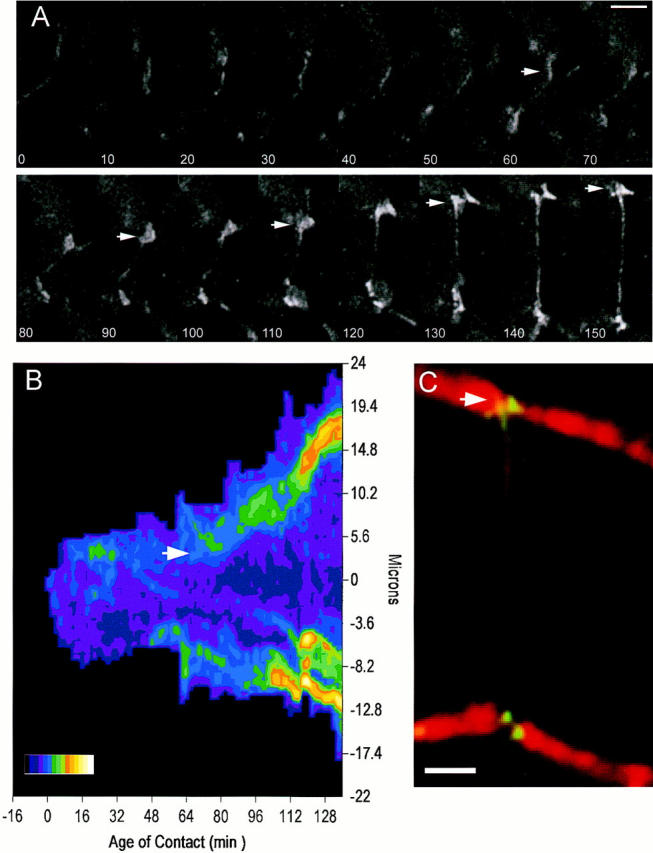
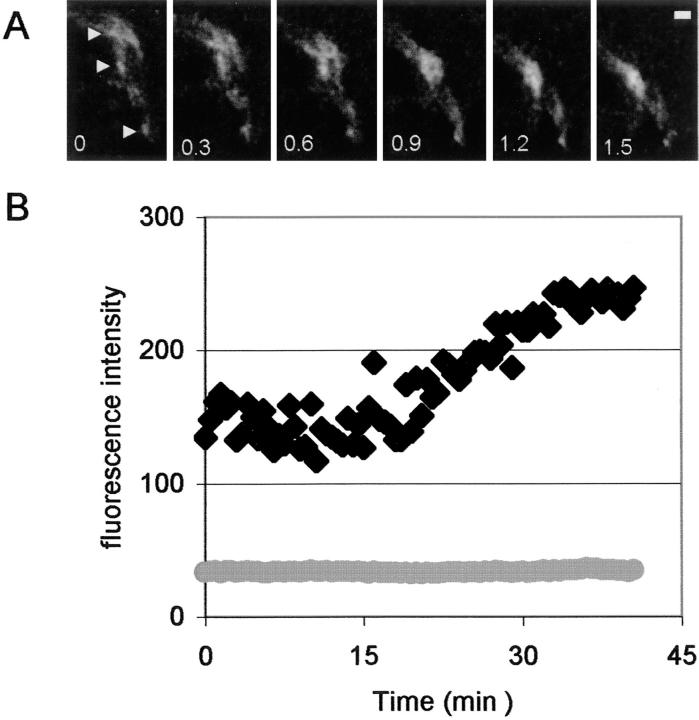
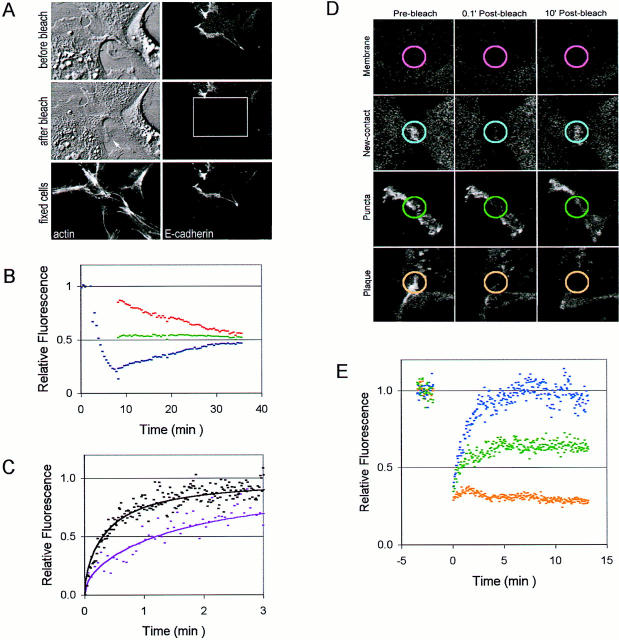
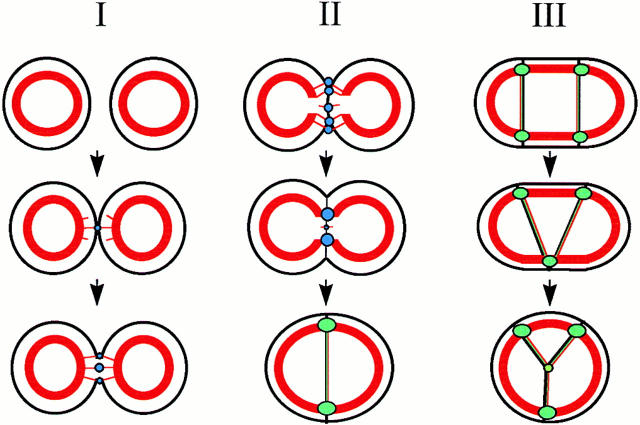
Cadherin-mediated adhesion initiates cell reorganization into tissues, but the mechanisms and dynamics of such adhesion are poorly understood. Using time-lapse imaging and photobleach recovery analyses of a fully functional E-cadherin/GFP fusion protein, we define three sequential stages in cell-cell adhesion and provide evidence for mechanisms involving E-cadherin and the actin cytoskeleton in transitions between these stages. In the first stage, membrane contacts between two cells initiate coalescence of a highly mobile, diffuse pool of cell surface E-cadherin into immobile punctate aggregates along contacting membranes. These E-cadherin aggregates are spatially coincident with membrane attachment sites for actin filaments branching off from circumferential actin cables that circumscribe each cell. In the second stage, circumferential actin cables near cell-cell contact sites separate, and the resulting two ends of the cable swing outwards to the perimeter of the contact. Concomitantly, subsets of E-cadherin puncta are also swept to the margins of the contact where they coalesce into large E-cadherin plaques. This reorganization results in the formation of a circumferential actin cable that circumscribes both cells, and is embedded into each E-cadherin plaque at the contact margin. At this stage, the two cells achieve maximum contact, a process referred to as compaction. These changes in E-cadherin and actin distributions are repeated when additional single cells adhere to large groups of cells. The third stage of adhesion occurs as additional cells are added to groups of >3 cells; circumferential actin cables linked to E-cadherin plaques on adjacent cells appear to constrict in a purse-string action, resulting in the further coalescence of individual plaques into the vertices of multicell contacts. The reorganization of E-cadherin and actin results in the condensation of cells into colonies. We propose a model to explain how, through strengthening and compaction, E-cadherin and actin cables coordinate to remodel initial cell-cell contacts to the final condensation of cells into colonies.


Figures

Figure 9
Figure 9
Mobility of E-cadherin puncta within the cell–cell contact interface. Fig. 9 shows a TIP scan of an entire contact during a photobleach-recovery experiment. A newly developing plaque in a 1.5-h-old contact was photobleached with a 2.8-μm-diameter bleach circle (0 mins, 0 μm) on the TIP scan (arrow). Images were collected every 16 s for 24 min at 0.11 μm/pixel. The fluorescence intensity scale bar ranges from 0–255 units divided into 15 colors.
Figure 1
Figure 1
EcadGFP has properties similar to those of endogenous E-cadherin. (A and B) Catenins were coimmunoprecipitated with EcadGFP from HEK 293 cells transiently transfected with EcadGFP (A) or stably transfected MDCK cells (B). Cells were labeled with [35S]Met/Cys for 24 h before immunoprecipitation. (A) Proteins in cadherin immunoprecipitates are compared among mock-transfected HEK 293 cells (No DNA), HEK 293 cells transfected with canine E-cadherin (Ecad), and HEK 293 cells transfected with EcadGFP, and (B) between untransfected MDCK cells (No DNA) and MDCK cells stably transfected with EcadGFP. (C) EcadGFP fluorescence and β-catenin immunofluorescence from HEK 293 cells transiently transfected with EcadGFP. Bar, 30 μm. (D) Preferential delivery of newly synthesized EcadGFP to the basal-lateral plasma membrane of fully polarized MDCK cells stably transfected with EcadGFP, or of endogenous E-cadherin in untransfected cells (No DNA); A, apical membrane; B, basal-lateral membrane. (E) Phase contrast images of L-cells and L-cells expressing EcadGFP after 18 h of aggregation in suspension culture in the presence or absence of extracellular Ca2+. Bar, 60 μm.
Figure 2
Figure 2
Distribution of EcadGFP during monolayer formation. A single confocal image was collected from EcadGFP expressing cells every 10 min for 12 h at 0.12 μm/pixel at 12 sites. Five representative images from each time-lapse are shown. Elapsed time is indicated on top of each column in h (0, 2, 4, 6, and 8, respectively). The circles in A highlight the edges of a cell–cell contact that have developed large aggregates of EcadGFP plaques. The arrows in B–F, columns 0 or 2 h point to the well-separated plaques at the edges of developing cell–cell contacts that reorganize into a multicellular vertex by 8 h. Note that the 0-h designation is arbitrarily set as the first time point shown. Bar, 15 μm.
Figure 3
Figure 3
Redistribution of EcadGFP during cell–cell contact occurs in two stages and correlates with reorganization of the actin cytoskeleton. Three 0.3-μm z-sections were collected from EcadGFP-expressing cells every 4.2 min at 0.5 micron/pixel at 6 sites. (A) Combined stacks from two sites are shown (Contact 1 and Contact 2). The age of each contact is displayed in min; the zero time point defines when a stable cell–cell contact had formed. Bar, 12 μm. The arrow points to a circumferential pattern of EcadGFP observed in single cells. (B and C) Immunofluorescence of the same cells stained, after formaldehyde fixation, with rhodamine phalloidin (actin; B) and mAb 3G8/CY5 (E-cadherin; C). (D) EcadGFP organization shown in C is plotted as a function of fluorescence intensity (y axis, arbitrary fluorescence units) vs. position in the contact (x axis, μm). The dashed gray lines running between C and D approximately register the edges of the contact in the image and graph. (E and F) Triton X-100 extracted wild-type MDCK cells (i.e., without EcadGFP) that had formed a contact for <1 h (Contact 1) or >2 h (Contact 2) stained with FITC-phalloidin and mAb 3G8/CY5, respectively. Bar, 10 μm.
Figure 4
Figure 4
EcadGFP puncta are formed and stabilized along newly formed cell–cell contacts. (A) 16 time-lapse images of EcadGFP cells taken from a sequence recorded every 1 min for 100 min at 0.11 μm/pixel; time in min after formation of the contact is shown. Arrows follow a single punctum. (B) TIP scan of all of the time-lapse images from the experiment represented in A. The contact was divided into 129 0.22-μm sections, and the maximum fluorescence intensity at 100 time points was collected for a total of 12,900 data points. The contact originates at 0 min and 0 μm. Small fluctuations in the apparent intensity of stable puncta are near the limits of instrumental noise sources such as laser output fluctuations and noise processes in the photomultiplier tube detector. (C) Double immunofluorescence of the same contact extracted with Triton X-100, fixed with formaldehyde, and stained with rhodamine phalloidin and E-cadherin mAb 3G8/CY5. The arrows in all panels point to the same punctum. Bars: (A) 10 μm; (C) 5 μm. (B) 0–210 gray scale fluorescence intensity units divided into 15 colors.
Figure 5
Figure 5
Two large plaques of EcadGFP form and move to the edges of the cell–cell contact. (A) 16 time-lapse images of EcadGFP cells taken from a sequence recorded every 2 min for 2.7 h at 0.23 μm/pixel. Arrows follow a single plaque. (B) TIP scan of all of the time-lapse images from the experiment represented in A. The contact was divided into 101, 0.46-μm sections, and the fluorescence intensity at 85 time points was collected for a total of 8,585 data points. The contact originates at 0 min and 0 μm. Note that the TIP scan at this reduced resolution shows a relatively homogeneous distribution of EcadGFP within the contact during the first hour, whereas the TIP scan at a higher resolution revealed individual punctum (see Fig. 4). (C) Double immunofluorescence of the same contact stained with rhodamine phalloidin and E-cadherin mAb 3G8/CY5. The arrows in all panels point to the same plaque. (B) 0– 151 gray scale fluorescence intensity units divided into 15 colors. Bars: (A) 10 μm and (C) 5 μm.
Figure 6
Figure 6
EcadGFP puncta cluster into plaques during transition between early and late stages of adhesion. (A) Representative images of a time-lapse sequence taken at 0.8 Hz for 300 s at 0.12 μm/pixel in a region of the cell–cell contact in which a plaque is developing. Time is in min; arrows point to individual puncta; bar, 2 μm. (B) Quantitative fluorescence intensities of EcadGFP. The average (gray circles) and maximum (black diamonds) intensities in a 20-μm2 region surrounding a developing plaque area are plotted over a 40-min period. The average fluorescence intensity of the same number of EcadGFP in a fixed area is constant regardless of its distribution. However, the maximum fluorescence intensity increases as EcadGFP clusters into a smaller region within that fixed area. For details, see Materials and Methods.
Figure 7
Figure 7
Cytochalasin D selectively disassembles new cell–cell contacts. Representative images of a time-lapse sequence taken at 1 frame/2 min for 2 h at 0.4 μm/pixel before and after adding 2 μM CD. (A) 14 min before CD; (B) 1 min before CD; (C) 30 min after CD; (D) 60 min after CD. Immunofluorescence of the same area is shown using rhodamine phalloidin (E) or β-catenin/ CY5 (F). The arrows in D–F point to CD-induced EcadGFP clusters; bar, 10 μm. (G) The number of cells that were in contact before the time-lapse experiment began (>60 min old), and those that made contact during the imaging experiment (<60 min old) were counted and the totals shown for three independent experiments (black bars). The number of those contacts that disassembled within 1 h after CD treatment was determined (striped bars). The percentage of cell–cell contacts disassembled by CD treatment is 14% for old contacts and 73% for new contacts.
Figure 8
Figure 8
Photobleach-recovery analysis shows a highly mobile pool of EcadGFP coalesces into immobile puncta. A shows a live cell before and after photobleaching. The box indicates where the cell was photobleached. The arrow points to an area that formed a contact during the photobleach. The cells were fixed in formaldehyde and stained with phalloidin and mAb 3G8. B shows the fluorescence recovery curves of a single noncontacting cell in which half of the cell was photobleached (blue). EcadGFP fluorescence of the nonbleached region (red) and the entire cell (green) was monitored during recovery. Notice that the EcadGFP fluorescence values equalize in the photobleached and nonphotobleached areas. C shows the first 3 min of photobleach-recovery data of noncontacting membrane regions photobleached with a 5.8-μm (pink) and 3-μm (black) circle. The relative fluorescence is scaled between the fluorescence intensity just after bleaching and equilibrium. The lines show the theoretical recovery curves for each region with a diffusion coefficient of 3 × 10⁻¹⁰ cm2/s. Note that the smaller photobleach circle (black line) recovers more quickly. D shows images taken before, 0.1 min after, and 10 min after photobleaching a 5.8-μm-diameter circle in a region of membrane not involved in cell–cell contact (Membrane), a region of membrane in a <15-min-old contact (New contact), a region of membrane in the middle of a <60-min-old contact (Puncta), and a membrane at the edge of a >2-h-old contact (Plaque). For each experiment, 300 images were collected every 3.2 s at 0.11 μm/pixel. The circles mark the photobleach region, and the colors correspond to the recovery curves shown in C (pink) and E. E shows photobleach-recovery data for the bleached contact regions identified in D. The relative fluorescence is scaled to the pre-bleach intensity value. The mobile fraction of EcadGFP in the new contact (blue), puncta (green), and plaque (orange) is 100, 50, and <10%, respectively.
Figure 10
Figure 10
A three-stage model for cell–cell adhesion and colony formation. Stage I: multiple E-cadherin puncta form along the developing contact and loosly hold contacting cells together. A circumferential actin cable (thick red line) surrounds isolated cells. As cells adhere, E-cadherin clusters into puncta within the cell–cell contact interface (blue circle) and rapidly associates with thin actin bundles and filaments (thin red lines). As the contact lengthens, puncta continue to develop along the length of the contact at a constant average density during the first 2 h. Stage II: E-cadherin plaques develop at the edges of the contact which compact and strengthen cell–cell interactions. Stabilization of actin filaments by E-cadherin puncta within the cell–cell contact results in gradual dissolution of the circumferential actin cable behind the developing contact and insertion of the circumferential actin cables into the cell–cell contact accompanied by additional clustering of E-cadherin puncta into E-cadherin plaques (green ovals). Between cell plaques, E-cadherin is more diffusely distributed (green line) and associates with actin filaments oriented along the axis of the cell–cell contact (red line). Stage III: E-cadherin plaques cinch together to form multicellular vertices, further condensing cell colonies. In multicellular colonies, contractility within the circumferential actin cable brings E-cadherin plaques from adjacent cells together. Dynamics within the cytoskeleton result in continual rearrangement.

References

    1. Aberle H, Butz S, Stappert J, Weissig H, Kemler R, Hoschuetzky H. Assembly of the cadherin-catenin complex in vitro with recombinant proteins. J Cell Sci. 1994;107:3655–3663. - PubMed
    1. Aberle H, Schwartz H, Kemler R. Cadherin-catenin complex: protein interactions and their implications for cadherin function. J Cell Biochem. 1996;61:514–523. - PubMed
    1. Adams CL, Nelson WJ, Smith SJ. Quantitative analysis of cadherin-catenin-actin reorganization during development of cell-cell adhesion. J Cell Biol. 1996;135:1899–1911. - PMC - PubMed
    1. Angres B, Barth A, Nelson WJ. Mechanisms for transition from initial to stable cell-cell adhesion: kinetic analysis of E-cadherin-mediated adhesion using a quantitative adhesion assay. J Cell Biol. 1996;134:549–557. - PMC - PubMed
    1. Axelrod D, Koppel DE, Schlessinger J, Elson E, Webb WW. Mobility measurement by analysis of fluorescence photobleaching recovery kinetics. Biophys J. 1976;16:1055–1069. - PMC - PubMed

Publication types