. 1998 Sep 1;95(18):10356-60.
doi: 10.1073/pnas.95.18.10356.

Altering the biochemical state of individual cultured cells and organelles with ultramicroelectrodes

Affiliations

Altering the biochemical state of individual cultured cells and organelles with ultramicroelectrodes

J A Lundqvist et al. Proc Natl Acad Sci U S A. .

Abstract

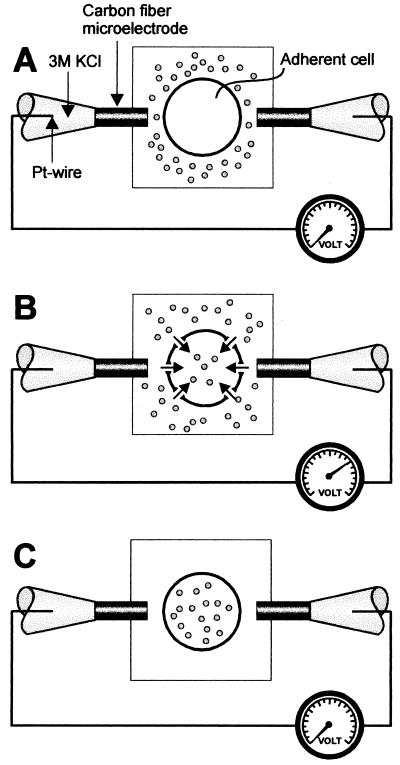
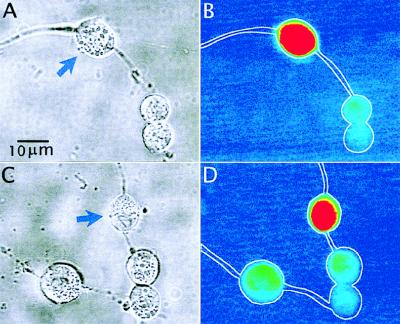
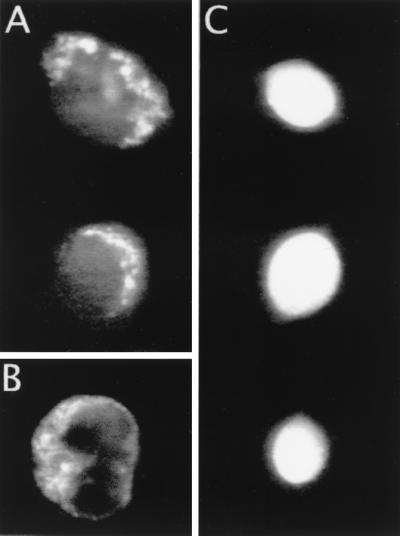
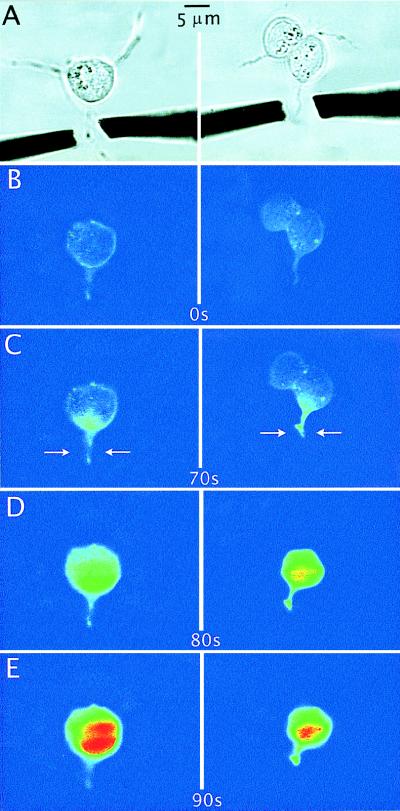
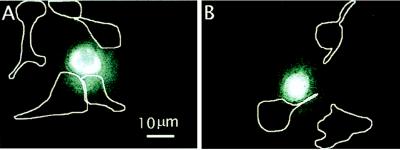
We describe an efficient technique for the selective chemical and biological manipulation of the contents of individual cells. This technique is based on the electric-field-induced permeabilization (electroporation) in biological membranes using a low-voltage pulse generator and microelectrodes. A spatially highly focused electric field allows introduction of polar cell-impermeant solutes such as fluorescent dyes, fluorogenic reagents, and DNA into single cells. The high spatial resolution of the technique allows for design of, for example, cellular network constructions in which cells in close contact with each other can be made to possess different biochemical, biophysical, and morphological properties. Fluorescein, and fluo-3 (a calcium-sensitive fluorophore), are electroporated into the soma of cultured single progenitor cells derived from adult rat hippocampus. Fluo-3 also is introduced into individual submicrometer diameter processes of thapsigargin-treated progenitor cells, and a plasmid vector cDNA construct (pRAY 1), expressing the green fluorescent protein, is electroporated into cultured single COS 7 cells. At high electric field strengths, observations of dye-transfer into organelles are proposed.


Figures

Figure 1
Figure 1
Schematic picture showing the positioning of the electrodes for single-cell electroporation. (A) Before electroporation. The electrodes are positioned close to the cell with a distance of ≈2 to 5 μm from the cell surface. The buffer contains the solute (dots) to be introduced into the cytosol. (B) Electroporation by application of a rectangular low-voltage pulse. The applied electric field, highly focused over the selected cell, causes membrane-pore formation, allowing the solute in the extracellular solution to freely diffuse into the cell. (C) After electroporation, the pores are resealed, and the solute is trapped inside the cell. After exchange of the extracellular medium, solute molecules are present in the cell but not in the extracellular solution.
Figure 2
Figure 2
Photomicrographs demonstrating electroporation of single progenitor cells from the adult rat brain to incorporate fluorescein (10 μM). (A and C) Bright-field images of small groups of progenitor cells in which one was electroporated (arrow). The cells were electroporated with 10 pulses of ≈1 V at 0.5-Hz repetition rate. The false-color coded fluorescence images (fluorescence intensity proportional to color wavelength) of the respective images are shown in B and D. The fluorescence from fluorescein is localized preferentially to the electroporated cells. The fluorescence intensity (measured as pixel intensity per square micrometer over the total cross sectional area of a single cell at the same laser intensity and detector settings) of electroporated cells (n = 10) was 4.3-fold higher (P < 0.001, using an unpaired one-tailed Student’s t test) than the background fluorescence intensity from untreated cells (n = 6).
Figure 3
Figure 3
Photomicrographs demonstrating differential fluorescence staining resulting from electroporation of fluorescein into single progenitor cells at high and low electric field strengths, respectively. (A) Two cells electroporated at plasma membrane superthreshold potentials of ≈2 V (10 pulses at 0.5-Hz repetition rate), both of which display a punctuate cytoplasmic fluorescence pattern. (B) Single progenitor cell after incubation with rhodamine 123, a mitochondria-specific dye. (C) Images of three cells after electroporation at the plasma membrane threshold potential of ≈1 V (10 pulses at 0.5-Hz repetition rate) in which the fluorescence is diffuse and evenly distributed over the entire cell.
Figure 4
Figure 4
Images showing electroporation of fluo-3 into individual cellular processes of thapsigargin-treated progenitor cells. (A) Bright-field image of two progenitor cells. The position of the microelectrodes in relation to the cellular process undergoing permeabilization is shown. (B) The same image as A in false-color coded fluorescence (fluorescence intensity proportional to color wavelength) before application of the electric field. (CE) Time sequences starting at 70 s after electroporation (C) and ending 90 s after electroporation (E). In D and E, the background fluorescence was subtracted from the images. The arrows in C indicate the location of electroporation along the cellular process. In C, right, the process loosened from the substratum after electroporation. The processes were electroporated with three 1-ms pulses of ≈0.5 V.
Figure 5
Figure 5
Fluorescence images demonstrating selective transfection of single COS 7 cells with the pRAY 1 expression vector containing the cDNA for green fluorescent protein. The images were taken 36 hours after electroporation. Control cells exposed to plasmid but not electroporated are outlined with white contour lines. The location of control cells was identified from bright-field images and superimposed onto the fluorescence images.

References

    1. Hamill O P, Marty A, Neher E, Sakman B, Sigworth F J. Pflügers Arch. 1981;391:85–100. - PubMed
    1. Chow R H, von Rüden L, Neher E. Nature (London) 1992;356:60–63. - PubMed
    1. Wightman R M, Jankowski J A, Kennedy R T, Kawagoe K T, Schroeder T J, Leszczyszyn D J, Near J A, Diliberto E J, Jr, Viveros O H. Proc Natl Acad Sci USA. 1991;88:10754–10758. - PMC - PubMed
    1. Bacskai B J, Wallen P, Lev-Ram V, Grillner S, Tsien R Y. Neuron. 1995;14:19–28. - PubMed
    1. Maiti S, Shear J B, Williams R M, Zipfel W R, Webb W W. Science. 1997;275:530–532. - PubMed

Publication types

Substances

LinkOut - more resources