. 1998 Sep 1;95(18):10402-6.
doi: 10.1073/pnas.95.18.10402.

Defective insulin secretion and enhanced insulin action in KATP channel-deficient mice

Affiliations

Defective insulin secretion and enhanced insulin action in KATP channel-deficient mice

T Miki et al. Proc Natl Acad Sci U S A. .

Abstract

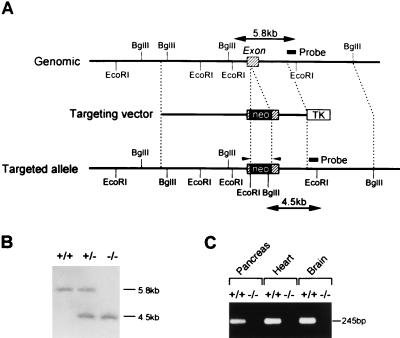
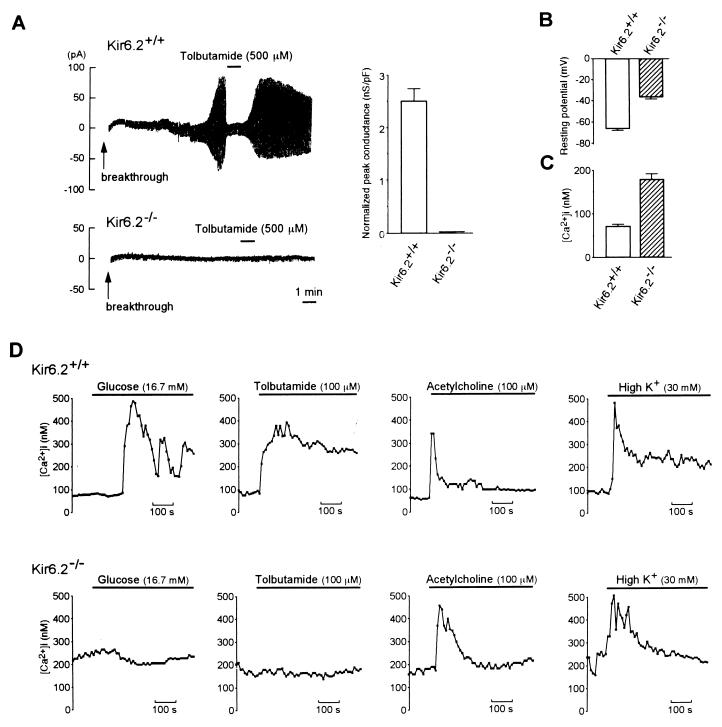
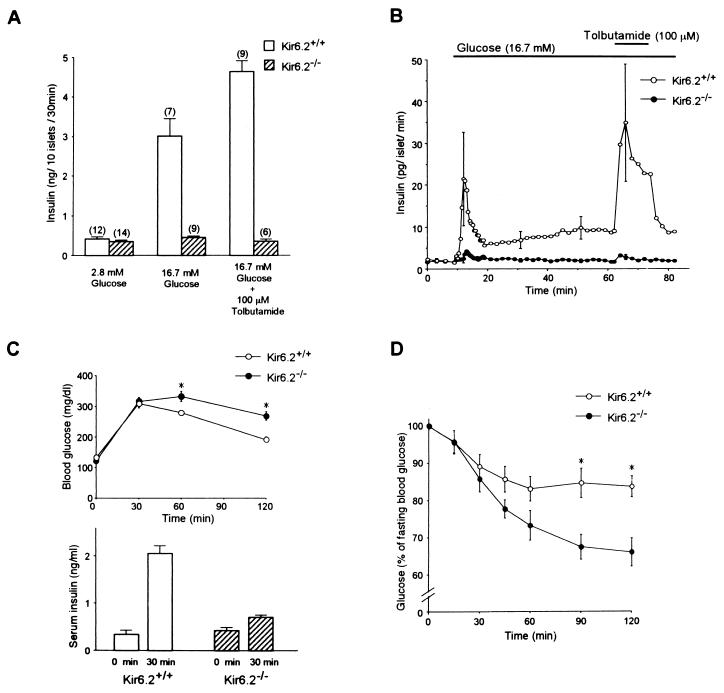
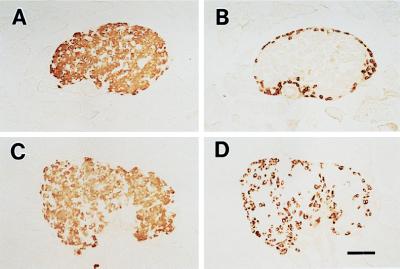
ATP-sensitive K+ (KATP) channels regulate many cellular functions by linking cell metabolism to membrane potential. We have generated KATP channel-deficient mice by genetic disruption of Kir6.2, which forms the K+ ion-selective pore of the channel. The homozygous mice (Kir6.2(-/-)) lack KATP channel activity. Although the resting membrane potential and basal intracellular calcium concentrations ([Ca2+]i) of pancreatic beta cells in Kir6.2(-/-) are significantly higher than those in control mice (Kir6.2(+/+)), neither glucose at high concentrations nor the sulfonylurea tolbutamide elicits a rise in [Ca2+]i, and no significant insulin secretion in response to either glucose or tolbutamide is found in Kir6.2(-/-), as assessed by perifusion and batch incubation of pancreatic islets. Despite the defect in glucose-induced insulin secretion, Kir6.2(-/-) show only mild impairment in glucose tolerance. The glucose-lowering effect of insulin, as assessed by an insulin tolerance test, is increased significantly in Kir6.2(-/-), which could protect Kir6.2(-/-) from developing hyperglycemia. Our data indicate that the KATP channel in pancreatic beta cells is a key regulator of both glucose- and sulfonylurea-induced insulin secretion and suggest also that the KATP channel in skeletal muscle might be involved in insulin action.


Figures

Figure 1
Figure 1
(A) Schematic representation of the mouse Ki6.2 gene, targeting vector, and targeted allele. The exon is indicated by shaded boxes. Neo and TK indicate a neomycin-resistant gene and a herpes simplex virus thymidine kinase gene, respectively. Restriction sites are indicated. The probe used for Southern blot analysis is shown. Primers used for reverse transcription–PCR (RT-PCR) are indicated by arrowheads. (B) Southern blot analysis of F2 offspring. Genomic DNA was digested with EcoRI and BglII and hybridized with the probe. Lanes: +/+, wild type; +/−, heterozygote; −/−, homozygote. (C) RT-PCR analysis of pancreas, heart, and brain of Kir6.2+/+ and Kir6.2−/−. cDNAs were synthesized from total RNA (10 μg) from the tissues of Kir6.2+/+ and Kir6.2−/−. The expected size of the PCR product (245 bp) is indicated. Lanes: +/+, heterozygote; −/−, homozygote. The Kir6.2 transcript was not detected in tissues of Kir6.2−/−.
Figure 2
Figure 2
(A Left) Representative traces of whole-cell recordings of pancreatic beta cells in Kir6.2+/+ and Kir6.2−/−. The holding potential was −70 mV, and alternate voltage pulses of ±10 mV and 200-ms duration every 2 s were applied. In Kir6.2+/+ beta cells (Upper), dialysis of the beta cells intracellularly with the ATP-free pipette solution (breakthrough) caused a progressive increase in K+ conductance, and addition of 500 μM tolbutamide promptly inhibited this conductance. In contrast, no increase in K+ conductance was observed in Kir6.2−/− beta cells (Lower). (A Right) Normalized peak KATP channel conductance of pancreatic beta cells in Kir6.2+/+ and Kir6.2−/−. Since the membrane area of each beta cell varied, ATP-sensitive conductance was normalized by dividing by the membrane capacitance for each cell. The KATP channel conductance in Kir6.2+/+ beta cells was 2.50 ± 0.25 nS/pF (n = 36) and was completely lost in Kir6.2−/− (0 nS/pF, n = 38). (B) Resting membrane potential of Kir6.2+/+ and Kir6.2−/− beta cells. (C) Basal [Ca2+]i in Kir6.2+/+ and Kir6.2−/− beta cells. (D) Effects of various insulin secretagogues on [Ca2+]i in Kir6.2+/+ and Kir6.2−/− beta cells. The secretagogues used were glucose (16.7 mM), tolbutamide (100 μM), acetylcholine (100 μM), and K+ (30 mM). In Kir6.2+/+ beta cells, these secretagogues all increased [Ca2+]i. In contrast, in Kir6.2−/− beta cells, acetylcholine or K+ increased [Ca2+]i, but neither glucose nor tolbutamide increased [Ca2+]i. Horizontal bars indicate application periods of the agents. Representative examples are shown.
Figure 3
Figure 3
(A) Insulin secretion in batch-incubated pancreatic islets of Kir6.2+/+ and Kir6.2−/−. There was no significant difference in the basal levels of insulin secretion in the presence of 2.8 mM glucose (Kir6.2+/+, 0.42 ± 0.05 ng/10 islets per 30 min; Kir6.2−/−, 0.35 ± 0.04 ng/10 islets per 30 min). In the islets of Kir6.2+/+, there was a 7.2-fold increase in insulin secretion in response to 16.7 mM glucose, and the secretion was further increased by addition of 100 μM tolbutamide. In contrast, in the islets of Kir6.2−/−, there was no increase in insulin secretion in response to 16.7 mM glucose, and addition of 100 μM tolbutamide did not elicit any insulin secretion. The number of experiments is indicated above each bar. (B) Insulin secretory responses to glucose and tolbutamide in perifused pancreatic islets of Kir6.2+/+ and Kir6.2−/−. There was no significant difference in the basal levels of insulin secretion in the presence of 2.8 mM glucose (Kir6.2+/+, 2.04 ± 0.50 pg/islet per min; Kir6.2−/−, 1.92 ± 0.41 pg/islet per min). Only a trace in the first phase of the insulin secretory response to 16.7 mM glucose was detected in Kir6.2−/−. There was no insulin response in the second phase in Kir6.2−/−. Tolbutamide (100 μM) in the presence of 16.7 mM glucose did not stimulate insulin secretion in Kir6.2−/−. For each experiment, pancreatic islets were isolated from three to five Kir6.2+/+ or Kir6.2−/−. The mean values ± SE were obtained from four and five independent experiments for Kir6.2+/+ and Kir6.2−/−, respectively. Horizontal bars indicate application periods of the agents. (C Upper) Intraperitoneal glucose tolerance test. Fasting blood glucose levels in Kir6.2+/+ and Kir6.2−/− were 132 ± 6 mg/dl (n = 11) and 121 ± 8 mg/dl (n = 11), respectively. The blood glucose levels of Kir6.2−/− 60 and 120 min after glucose load were slightly but significantly higher than those of Kir6.2+/+ (332 ± 16 mg/dl to 279 ± 8 mg/dl at 60 min) (n = 11) (268 ± 14 mg/dl to 192 ± 8 mg/dl at 120 min) (n = 11). ∗, P < 0.01. (C Lower) Insulin response to glucose load. The serum insulin concentrations before and 30 min after glucose load increased from 0.34 ± 0.09 to 2.05 ± 0.17 ng/ml in Kir6.2+/+ (n = 6, P < 0.001) and from 0.42 ± 0.07 to 0.70 ± 0.05 ng/ml in Kir6.2−/− (n = 6, P < 0.01). (D) Insulin tolerance test. The blood glucose levels of Kir6.2−/− (n = 10) 90 and 120 min after glucose load were significantly lower than those of Kir6.2+/+ (n = 10) (67.4 ± 3.4% to 84.7 ± 3.9% at 90 min; 66.0 ± 3.8% to 83.7 ± 2.8% at 120 min). ∗, P < 0.01.
Figure 4
Figure 4
Histology of pancreatic islets in Kir6.2+/+ and Kir6.2−/−. Pancreatic beta cells (A and C) and alpha cells (B and D) were stained by using guinea pig antiinsulin and rabbit antiglucagon antibodies, respectively, as described previously (25). In the islets of Kir6.2−/−, glucagon-positive alpha cells (D), which are present in the periphery of the islets of Kir6.2+/+ (B), are seen also in the central region of the islets. The beta cell population in Kir6.2−/− (C) is not different from that in Kir6.2+/+ (A). (Bar = 100 μm.)

Similar articles

Cited by

References

    1. Noma A. Nature (London) 1983;305:147–148. - PubMed
    1. Cook D L, Hales C N. Nature (London) 1984;310:271–273. - PubMed
    1. Ashcroft F M, Harrison D E, Ashcroft S J H. Nature (London) 1984;312:446–448. - PubMed
    1. Spruce A E, Standen N B, Stanfield P R. Nature (London) 1985;316:736–738. - PubMed
    1. Standen N B, Quayle J M, Davies N W, Brayden J E, Huang Y, Nelson M T. Science. 1989;245:177–180. - PubMed

Publication types