. 1998 Sep 1;95(18):10547-52.
doi: 10.1073/pnas.95.18.10547.

Implications of macromolecular crowding for signal transduction and metabolite channeling

Affiliations

Implications of macromolecular crowding for signal transduction and metabolite channeling

J M Rohwer et al. Proc Natl Acad Sci U S A. .

Abstract

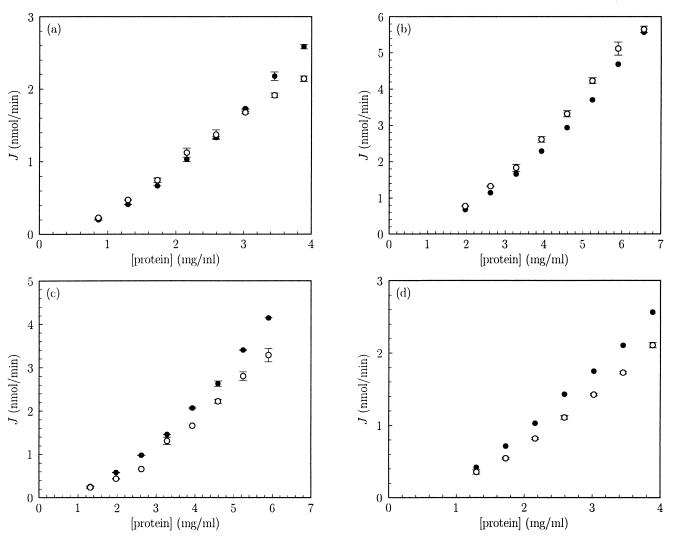
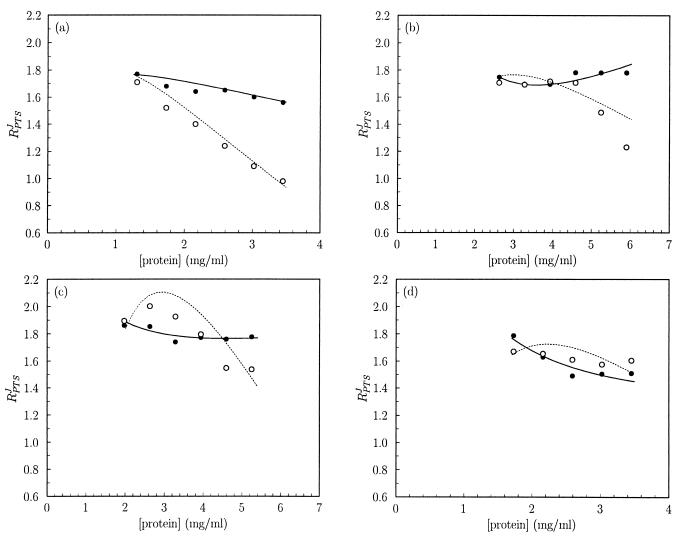
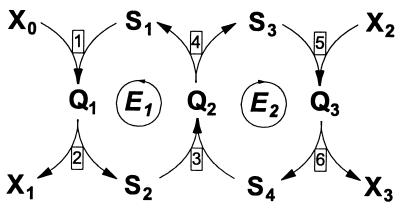
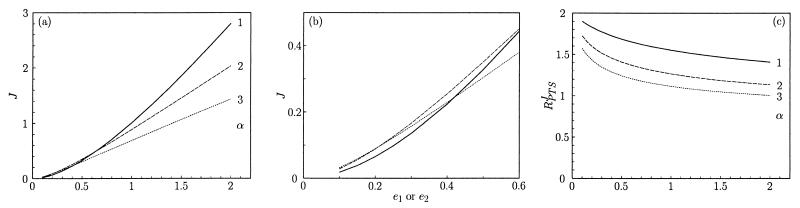
The effect of different total enzyme concentrations on the flux through the bacterial phosphoenolpyruvate:carbohydrate phosphotransferase system (PTS) in vitro was determined by measuring PTS-mediated carbohydrate phosphorylation at different dilutions of cell-free extract of Escherichia coli. The dependence of the flux on the protein concentration was more than linear but less than quadratic. The combined flux-response coefficient of the four enzymes constituting the glucose PTS decreased slightly from values of approximately 1.8 with increasing protein concentrations in the assay. Addition of the macromolecular crowding agents polyethylene glycol (PEG) 6000 and PEG 35000 led to a sharper decrease in the combined flux-response coefficient, in one case to values of approximately 1. PEG 6000 stimulated the PTS flux at lower protein concentrations and inhibited the flux at higher protein concentrations, with the transition depending on the PEG 6000 concentration. This suggests that macromolecular crowding decreases the dissociation rate constants of enzyme complexes. High concentrations of the microsolute glycerol did not affect the combined flux-response coefficient. The data could be explained with a kinetic model of macromolecular crowding in a two-enzyme group-transfer pathway. Our results suggest that, because of the crowded environment in the cell, the different PTS enzymes form complexes that live long on the time-scale of their turnover. The implications for the metabolic behavior and control properties of the PTS, and for the effect of macromolecular crowding on nonequilibrium processes, are discussed.


Figures

Figure 1
Figure 1
Dependence of PTS flux in vitro on the total protein concentration. The rate of MeGlc phosphorylation by cell-free extracts of E. coli was determined as described in the text. Closed symbols refer to fluxes without extra assay additions. Open symbols refer to fluxes under identical conditions, except that the assay mixture contained, additionally, 9% (m/V) PEG 6000 (a), 4.5% (m/V) PEG 6000 (b), 5% (m/V) PEG 35000 (c), and 1.2 M glycerol (d). Data points reflect means of two independent experiments, except the experiments depicted by the closed symbols in b and d, in which each data point reflects an individual determination. Error bars indicate SEMs. Experiments ad were performed with different cell-free extracts. The control experiment (closed symbols) was always included as a reference.
Figure 2
Figure 2
The effect of PEG 6000, PEG 35000, and glycerol on the combined flux–response coefficient of the PTS enzymes in vitro. The data from Fig. 1 were differentiated and scaled to determine RPTSJ as described in the text. The lines refer to slopes calculated by the first derivative of a third-order polynomial fitted through the flux vs. protein concentration data in double-logarithmic space. The points refer to scaled slopes determined by fitting a cubic spline through the flux vs. protein concentration data in linear space. Solid lines and closed symbols refer to assays without extra additions. Dotted lines and open symbols refer to assays with the following extra additions, as in Fig. 1: 9% (m/V) PEG 6000 (a), 4.5% (m/V) PEG 6000 (b), 5% (m/V) PEG 35000 (c), and 1.2 M glycerol (d).
Figure 3
Figure 3
Kinetic model of a two-enzyme group-transfer pathway. Arrows indicate the direction of the flux; all elementary reactions are assumed to be reversible. The rate constants used for the simulation were as follows (ki denotes the rate constant in the forward direction relative to the arrowheads; ki indicates the rate constant in the reverse direction): k1 = 1, k−1 = 0.5, k2 = 5, k−2 = 2, k3 = 500, k−3 = 250, k4 = 10, k−4 = 20, k5 = 1, k−5 = 0.5, k6 = 5, and k−6 = 1. A series of steady states was calculated in which the concentrations x0 and x2 were varied from 0.5 to 10 and the concentrations x1 and x3 were varied from 0.05 to 1 whereas the total concentrations e1 and e2 were increased from 0.1 to 2 concomitantly. Units are arbitrary.
Figure 4
Figure 4
Simulation results of the model described in Fig. 3. Macromolecular crowding agents were assumed to increase the on-rate constants for complex formation (k1, k−2, k3,k−4, k5, and k−6) by a factor α and to decrease the off-rate constants for complex dissociation (k−1, k2, k−3, k4, k−5, and k6) by the same factor α. The other parameters were as per the legend of Fig. 3. For α= 1, crowding effects are assumed to be absent. (a) The flux J. (b) Magnification of the area near the origin in a. (c) The combined flux–response coefficient, for α = 1, 2, and 3.

Similar articles

Cited by

References

    1. Zimmerman S B, Trach S O. J Mol Biol. 1991;222:599–620. - PubMed
    1. Zimmerman S B, Minton A P. Annu Rev Biophys Biomol Struct. 1993;22:27–65. - PubMed
    1. Garner M M, Burg M B. Am J Physiol. 1994;266:C877–C892. - PubMed
    1. Adair G S. Proc R Soc Lond Ser A. 1928;120:573–603.
    1. Zimmerman S B, Harrison B. Proc Natl Acad Sci USA. 1987;84:1871–1875. - PMC - PubMed

Publication types

MeSH terms

Substances

LinkOut - more resources