. 1998 Sep 1;95(18):10655-60.
doi: 10.1073/pnas.95.18.10655.

DNase I-hypersensitive sites I and II of the human growth hormone locus control region are a major developmental activator of somatotrope gene expression

Affiliations

DNase I-hypersensitive sites I and II of the human growth hormone locus control region are a major developmental activator of somatotrope gene expression

I M Bennani-Baïti et al. Proc Natl Acad Sci U S A. .

Abstract

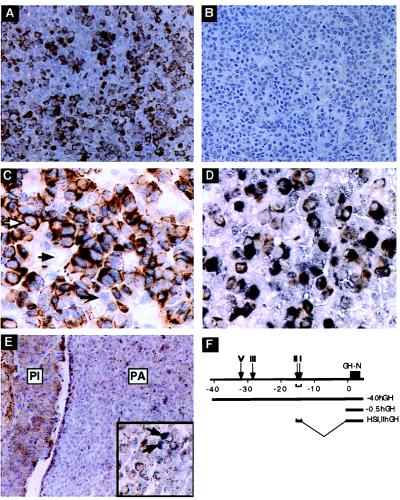
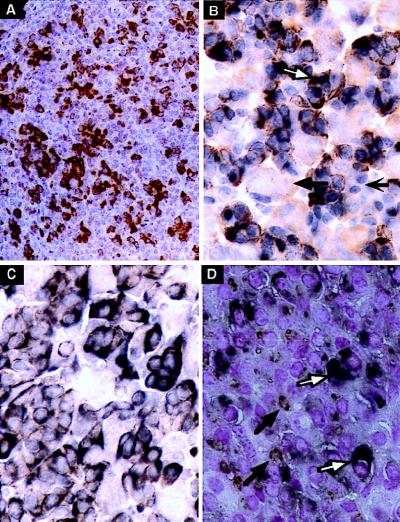
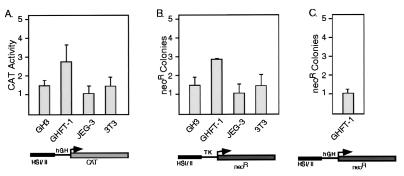
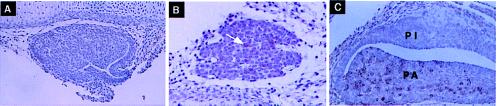
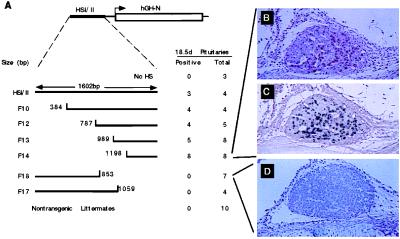
High-level expression of the human growth hormone (hGH) gene is limited to somatotrope and lactosomatotrope cells of the anterior pituitary. We previously identified a locus control region (LCR) for the hGH gene composed of four tissue-specific DNase I-hypersensitive sites (HS) located between -14.6 kb and -32 kb 5' to the hGH transcription start site that is responsible for establishing a physiologically regulated chromatin domain for hGH transgene expression in mouse pituitary. In the present study we demonstrated that the LCR mediates somatotrope and lactosomatotrope restriction on an otherwise weakly and diffusely expressed hGH transgene. The subregion of the LCR containing the two pituitary-specific HS, HSI and HSII (-14.6 to -16.2 kb relative to the hGH promoter and denoted HSI,II), was found to be sufficient for mediating somatotrope and lactosomatotrope restriction, for appropriately timed induction of hGH transgene expression between embryonic days 15.5 and 16.5, and for selective extinction of hGH expression in mature lactotropes. When studied by cell transfection, the HSI,II fragment selectively enhanced transcription in a presomatotrope-derived cell line, although at levels (2- to 3-fold) well below that seen in vivo. The LCR activity of the HSI,II element was therefore localized by scoring transgene expression in fetal founder pituitaries at embryonic day 18.5. The data from these studies indicated that a 404-bp segment of the HSI,II region encodes a critical subset of LCR functions, including the establishment of a productive chromatin environment, cell-specific restriction and enhancement of expression, and appropriately timed induction of the hGH transgene during embryonic development.


Figures

Figure 1
Figure 1
−40hGH transgene expression in mouse pituitary was restricted to somatotrope cells. (A) Representative section of a pituitary from a −40hGH (F) adult transgenic mouse. A subset of cells stained positively with mAb9, which is specific for hGH (brown cytoplasmic stain). (B) A nontransgenic mouse pituitary stained with mAb9 was negative, indicating the specificity of mAb9 for hGH. (C) −40hGH pituitary cells were doubly immunostained with mAb9 and anti-Pit-1 (blue-gray nuclear stain). mAb9 positivity (brown) was detected only in the cytoplasm of cells that also exhibited nuclear staining for Pit-1 (white arrow). Pit-1-positive cells unreactive with mAb9 represent lactotrope or thyrotrope populations (black, barbed arrow). Other cells were negative for both stains (solid black arrow). (D) Double stain of the −40hGH pituitary with mAb9 and anti-rGH colocalized mGH (brown) and hGH using mAb9 (charcoal black) in the same cells, resulting in a dirty brown appearance. (E) Representative section of a pituitary from a −0.5hGH adult transgenic mouse. The weakly staining mAb-positive cells (brown cytoplasmic stain) were widely and nonspecifically distributed throughout the anterior (PA, pars anterior) and intermediate (PI, pars intermedia) lobes of the pituitary. The higher-power (×170) Inset shows a double stain for mGH and hGH; the reactivity showed distinct mGH-positive somatotropes (charcoal black; white arrows) in contrast to the diffuse and generalized positivity for hGH (mAb9; brown) visible in most of the cells. (F) The hGH gene cluster, pituitary HS, and the hGH-N transgenes used in these studies. (A, B, D, and E were counterstained with hematoxylin; C had no counterstain. A, B, and E, ×70; C and D ×170.)
Figure 2
Figure 2
The HSI,IIhGH transgene was expressed in somatotropes but silenced in lactotropes. (A) Representative section of a pituitary from an HSI,IIhGH (Fig. 1E) adult transgenic mouse stained with mAb9. The number and distribution of mAb9-positive cells (brown cytoplasm) corresponded to that seen with the −40hGH transgene (Fig. 1A) but the staining is more intense because of the higher level of transgene expression. (B) Following double immunostaining, mAb9 positivity (brown) was detected only in the cytoplasm of cells also positive with anti-Pit-1 (blue nuclei). A representative pituitary cell positive for both Pit-1 and hGH (white arrow), another pituitary cell-type positive for Pit-1 but not hGH (barbed black arrow), and a cell negative for both (black arrow) are indicated. (C) Double staining colocalized mGH (brown) and hGH (mAb9; charcoal black) in the cytoplasm of the same cells, yielding a dirty brown reaction product (compare with the pure brown reaction product in A). (D) Double staining was also carried out with mAb9 (charcoal black diffuse cytoplasmic stain; white arrows) and anti-Prl (granular rust-colored stain with juxtanuclear Golgi pattern of reactivity; black arrows). Mature lactotropes that expressed mPrl but not hGH, indicating appropriate silencing of the HSI,IIhGH transgene, were clearly identifiable (black arrow) and were distinct from cells expressing hGH (white arrow). (A and C were counterstained with hematoxylin, B was not counterstained, and in D the nuclei were counterstained with nuclear fast red. A, ×70; BD, ×170.)
Figure 3
Figure 3
HSI,II demonstrated minimal function following transient and stable transfections into pituitary and placental cell lines. (A) Transient transfection studies. The hGH-N promoter was fused to CAT with or without the linked HSI,II fragment (diagrammed below the histogram). The effect of HSI,II on CAT expression was determined after transfections into GH3, GHFT1, JEG3, and NIH 3T3 cells. The ordinate represents the ratio of the pHSI,II-hGH-CAT expression to phGHN-CAT. (B) Stable transfections and neor (neomycin-resistant) colony assay. The tk (thymidine kinase) promoter was linked to the neor gene in the presence or absence of HSI,II. The ordinate represents the ratio of neor colonies generated by pHSI,II-tk-neor to those generated with ptk-neor. (C) Stable transfections and neor colony assay in GHFT1 cells using the hGH gene promoter linked to the neor gene in the presence or absence of HSI,II. The ordinate represents the ratio of neor colonies generated by pHSI,II-hGHN-neor to those generated with phGHN-neor. Error bars span one standard deviation.
Figure 4
Figure 4
HSI,IIhGH transgene expression was induced between E15.5 and E16.5. Representative pituitary sections from HSI,IIhGH transgenic fetal mice stained with mAb9 are shown. Sections obtained at E15.5, E16.5, and E18.5 were stained with mAb9. No staining was detectable at E15.5 (A), a few cells were positive by E16.5 (B; white arrow), and many cells were positive by E18.5 (C), whereas the pars intermedia (PI) remained negative. (×70.)
Figure 5
Figure 5
HSI,II activity sublocalized to a 404-bp fragment. (A) The E18.5 fetal pituitary transgene expression assay. The structure of the HSI,IIhGH transgene is shown on the first line. The lines below this diagram represent each of the 7 HSI,II segments studied, as well as the nontransgenic littermate controls. The first transgene contained only the hGH-N gene and promoter (No HS; equivalent to −0.5hGH), and the remainder contained HSI,II or subsegments of this element linked to the −0.5hGH. The full-length 1,602-bp HSI,II fragment (HSI,II), and 6 transgenes with 5′-terminal or 3′-terminal deletions (F10, F12, F13, F14, F18, and F17) are depicted. The base positions of the deletion termini are indicated. Pituitaries from transgenic E18.5 embryos were stained with mAb9. To the right of each transgene are the number of pituitaries positive by mAb9 staining as well the total number of transgenic embryos with that construct. Nontransgenic fetuses were assayed in parallel with their transgenic littermates (Nontransgenic Littermates). (B) The pituitary of an F14 fetus stained with mAb9 showed scattered cells immunoreactive for hGH. (C) A subsequent section of the pituitary shown in B was doubly stained for hGH (brown) and mGH (charcoal black). There were no cells showing only brown staining (compare with brown color of frame B), indicating that all high-expressing cells also produced mGH. (D) An F18 pituitary stained with mAb9 was negative for hGH expression. (B–D, ×60.)

References

    1. Felsenfeld G. Cell. 1996;86:13–19. - PubMed
    1. Grosveld F, Blom van Assendelft G, Greaves D R, Kollias G. Cell. 1987;51:975–985. - PubMed
    1. Jones B K, Monks B R, Liebhaber S A, Cooke N E. Mol Cell Biol. 1995;15:7010–7021. - PMC - PubMed
    1. Seeburg P H. DNA. 1982;1:239–249. - PubMed
    1. McWilliams D, Boime I. Endocrinology. 1980;107:761–765. - PubMed

Publication types

Associated data

LinkOut - more resources