

Equilibrium distributions of microsatellite repeat length resulting from a balance between slippage events and point mutations
- PMID: 9724780
- PMCID: PMC27971
- DOI: 10.1073/pnas.95.18.10774
Equilibrium distributions of microsatellite repeat length resulting from a balance between slippage events and point mutations
Abstract
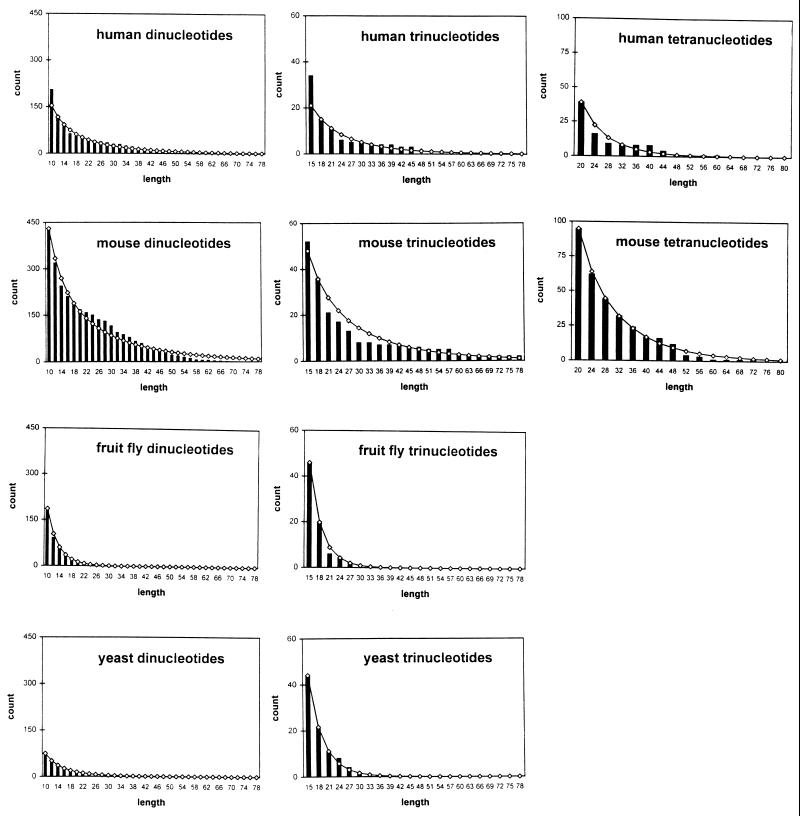
We describe and test a Markov chain model of microsatellite evolution that can explain the different distributions of microsatellite lengths across different organisms and repeat motifs. Two key features of this model are the dependence of mutation rates on microsatellite length and a mutation process that includes both strand slippage and point mutation events. We compute the stationary distribution of allele lengths under this model and use it to fit DNA data for di-, tri-, and tetranucleotide repeats in humans, mice, fruit flies, and yeast. The best fit results lead to slippage rate estimates that are highest in mice, followed by humans, then yeast, and then fruit flies. Within each organism, the estimates are highest in di-, then tri-, and then tetranucleotide repeats. Our estimates are consistent with experimentally determined mutation rates from other studies. The results suggest that the different length distributions among organisms and repeat motifs can be explained by a simple difference in slippage rates and that selective constraints on length need not be imposed.
Figures
References
Publication types
MeSH terms
Grants and funding
LinkOut - more resources
Full Text Sources
Molecular Biology Databases
