. 1998 Sep;112(3):297-316.
doi: 10.1085/jgp.112.3.297.

Model of sarcomeric Ca2+ movements, including ATP Ca2+ binding and diffusion, during activation of frog skeletal muscle

Affiliations

Model of sarcomeric Ca2+ movements, including ATP Ca2+ binding and diffusion, during activation of frog skeletal muscle

S M Baylor et al. J Gen Physiol. 1998 Sep.

Abstract

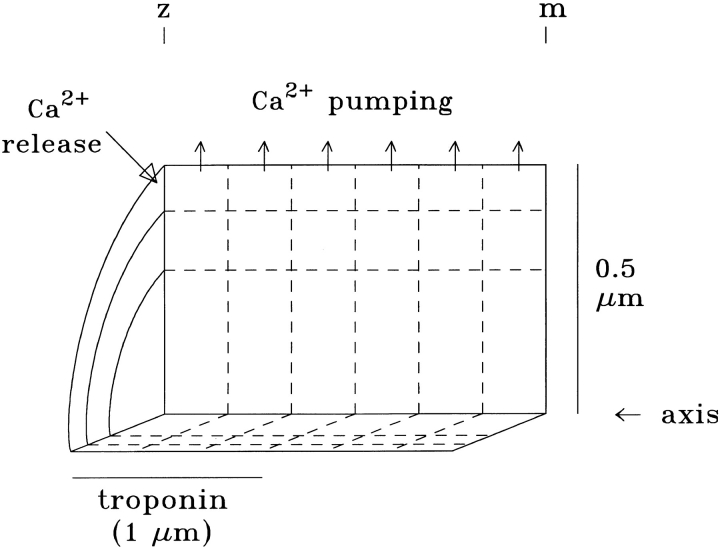
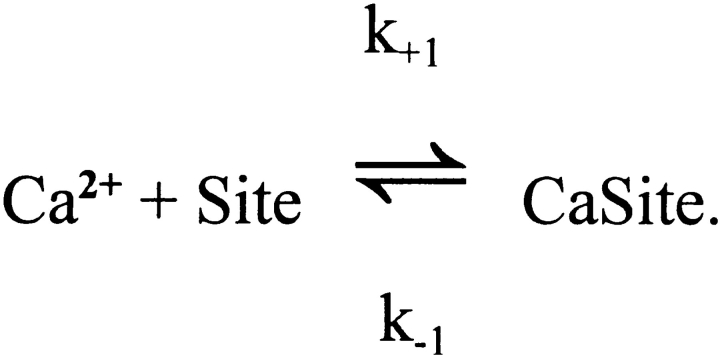
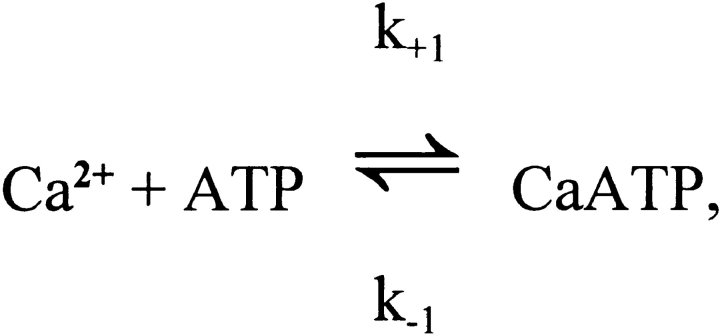
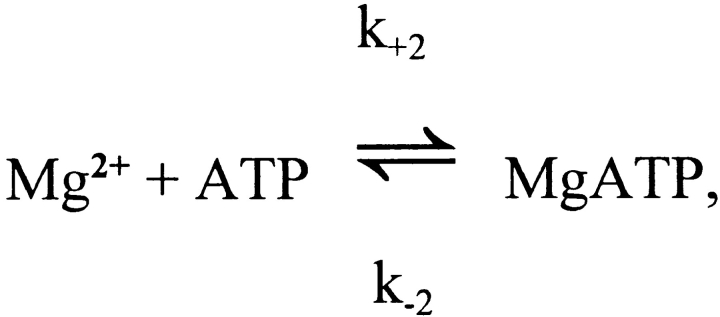
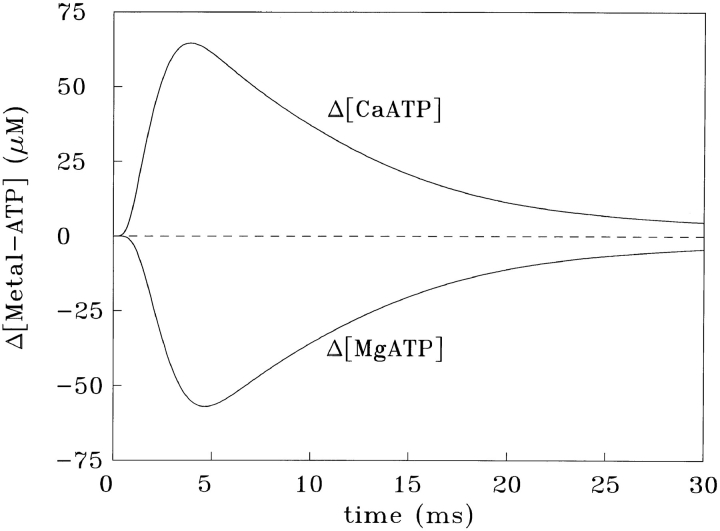
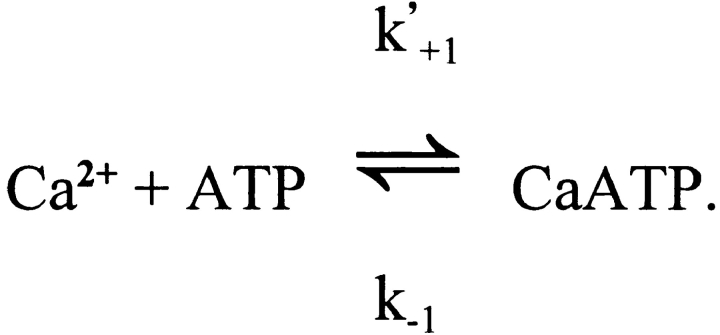
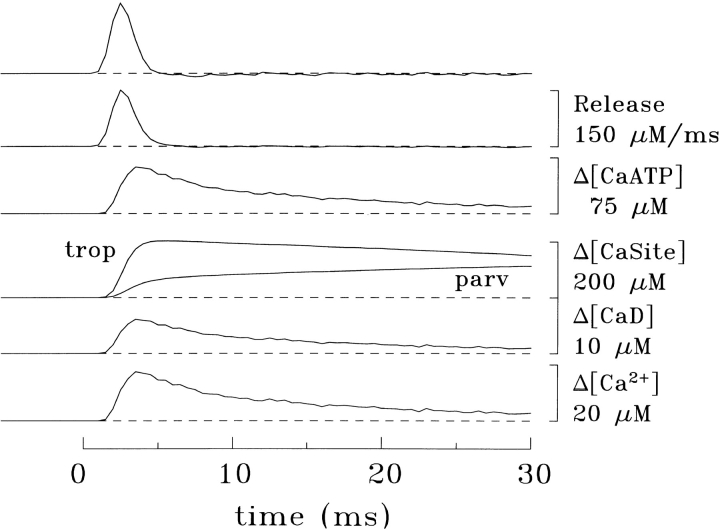
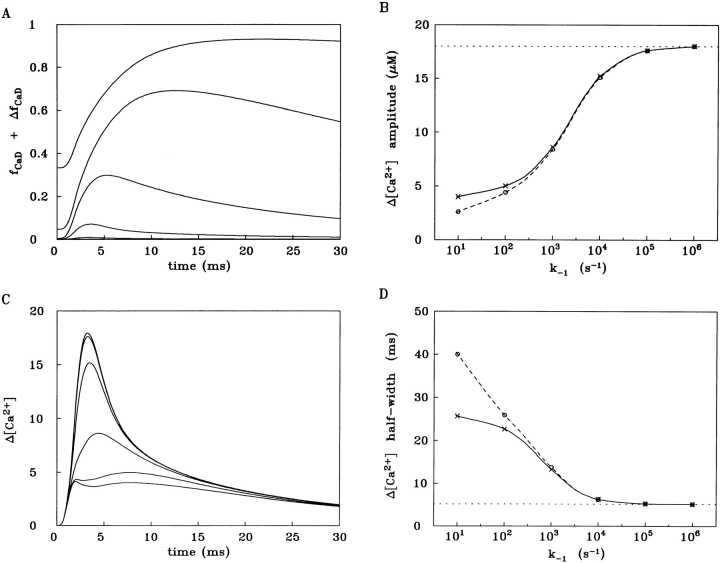
Cannell and Allen (1984. Biophys. J. 45:913-925) introduced the use of a multi-compartment model to estimate the time course of spread of calcium ions (Ca2+) within a half sarcomere of a frog skeletal muscle fiber activated by an action potential. Under the assumption that the sites of sarcoplasmic reticulum (SR) Ca2+ release are located radially around each myofibril at the Z line, their model calculated the spread of released Ca2+ both along and into the half sarcomere. During diffusion, Ca2+ was assumed to react with metal-binding sites on parvalbumin (a diffusible Ca2+- and Mg2+-binding protein) as well as with fixed sites on troponin. We have developed a similar model, but with several modifications that reflect current knowledge of the myoplasmic environment and SR Ca2+ release. We use a myoplasmic diffusion constant for free Ca2+ that is twofold smaller and an SR Ca2+ release function in response to an action potential that is threefold briefer than used previously. Additionally, our model includes the effects of Ca2+ and Mg2+ binding by adenosine 5'-triphosphate (ATP) and the diffusion of Ca2+-bound ATP (CaATP). Under the assumption that the total myoplasmic concentration of ATP is 8 mM and that the amplitude of SR Ca2+ release is sufficient to drive the peak change in free [Ca2+] (Delta[Ca2+]) to 18 microM (the approximate spatially averaged value that is observed experimentally), our model calculates that (a) the spatially averaged peak increase in [CaATP] is 64 microM; (b) the peak saturation of troponin with Ca2+ is high along the entire thin filament; and (c) the half-width of Delta[Ca2+] is consistent with that observed experimentally. Without ATP, the calculated half-width of spatially averaged Delta[Ca2+] is abnormally brief, and troponin saturation away from the release sites is markedly reduced. We conclude that Ca2+ binding by ATP and diffusion of CaATP make important contributions to the determination of the amplitude and the time course of Delta[Ca2+].


Figures

Figure 1
Figure 1
Cut-away view of a portion of a half-sarcomere of one myofibril, illustrating the compartment geometry of the model. The fiber axis extends horizontally. As shown here, a typical calculation divides the myoplasm into 18 radially symmetric compartments of equal volume (six axial times three radial). Troponin is assumed to be restricted to the compartments located axially within 1 μm of the Z line (i.e., the length of the thin filaments), whereas the diffusible species (parvalbumin and ATP) are assumed to have access to all compartments. Note that the vertical and horizontal scales are different. See Table I for additional information.
Scheme A
Scheme A
Scheme B
Scheme B
Scheme C
Scheme C
Figure 2
Figure 2
Single-compartment simulation of the response of 8 mM total ATP to a [Ca2+] transient of peak amplitude 18.0 μM, time-to-peak 2.90 ms, and half-width 5.90 ms. Schemes SB and SC were simulated with the Ca2+ and Mg2+ reaction rates given in the text; free [Mg2+] was 1 mM and constant.
Scheme D
Scheme D
Figure 4
Figure 4
18-compartment calculation with ATP included. A shows spatially averaged Δ[Ca2+]. B shows the Δ[CaTrop] responses for the nine compartments that contain troponin; a value of 446 μM on the ordinate corresponds to 100% occupancy of troponin with Ca2+. The three largest Δ[CaTrop] changes are from the three radial compartments adjacent to the Z line. Among these three, the peak rate of rise progressively decreases from edge to middle to center of the myofibril. A similar progression is seen for the three Δ[CaTrop] changes of intermediate size (which correspond to the middle third of the thin filament) and for the three smallest Δ[CaTrop] changes (which correspond to the thin filament regions most distant from the Z line). C shows the 18 individual Δ[CaATP] responses. Their amplitudes decrease progressively in a manner analogous to that described in B. Only the three largest Δ[CaATP] responses (from the three radial compartments adjacent to the Z line) are well resolved individually; for the other changes, the radial gradient is almost negligible, and thus, at the display gain shown, traces for the radial compartments at other axial locations are indistinguishable. D shows the 18 individual Δ[CaParv] changes, again with an analogous progression in amplitudes. The amplitude of the SR Ca2+ release function (cf., Eq. 3) was 141 μM/ms if referred to the myoplasmic volume of the half-sarcomere. See Table I for a summary of other model parameters.
Figure 3
Figure 3
Example of the single-compartment model of Baylor et al. (1983) to estimate SR Ca2+ release (top two traces, referred to in the text as the dΔ[CaT]/dt signal); the uppermost calibration bar applies to both traces. The furaptra Δ[CaD] signal (second trace from the bottom) was measured in a frog fiber of small diameter (45 μm). Δ[Ca2+] (bottom trace) was estimated from the furaptra signal by the single-compartment method described in the text and used to calculate the Δ[CaTrop], Δ[CaParv],] and Δ[CaATP] responses. Fiber reference, 032896.2; sarcomere length, 3.8 μm; 16°C; furaptra concentration, 0.04 mM.
Figure 5
Figure 5
Multi-compartment calculation identical to that in Fig. 4, except that the diffusion constant of ATP was reduced from 1.4 × 10⁻⁶ cm2 s−1 to 0.
Figure 6
Figure 6
Multi-compartment simulations to illustrate the effects of local furaptra saturation on the estimation of furaptra's Δ[Ca2+] by the single-compartment approach. The continuous trace in A is identical to that in Fig. 4 A, i.e., is “true” spatially averaged Δ[Ca2+] as calculated by the multi-compartment model with ATP included. The traces in B represent two multi-compartment simulations of the spatially averaged furaptra Δf CaD signal based on two assumed values for K d,Ca of the indicator in myoplasm (70 μM for the dashed trace, 98 μM for the dotted trace). For these calculations, a nonperturbing concentration of furaptra (1 μM) was included in each compartment in Fig. 1, but otherwise the simulation conditions were identical to those of Fig. 4. In A, the dashed trace is a single-compartment calculation of Δ[Ca2+], which is based on the dashed trace in B and the assumption that K d,Ca is 98 μM.
Figure 7
Figure 7
Analysis of responses of a hypothetical family of Ca2+ indicators assumed to react with Ca2+ with a fixed value of k +1 (5 × 10⁷ M−1 s−1) but with different values of k −1 (order of magnitude increases from 101 to 106 s−1). All simulations started with the multi-compartment model with ATP, whereby “true” spatially averaged Δ[Ca2+] and “true” spatially averaged Δf CaD of the indicators were calculated. A single-compartment model was then used to convert Δf CaD to Δ[Ca2+] by one of two methods. The first approach (cf., B and D, dashed curves) used the steady-state form of the 1:1 binding equation. The second approach (cf., B and D, continuous curves) used the kinetic form of the same equation. A shows the calculation of f CaD + Δf CaD for the six multi-compartment simulations, whereas B shows the amplitude of spatially averaged Δ[Ca2+], as calculated from the f CaD + Δf CaD signals in the two single-compartment approaches. D is similar to B except that the half-width of Δ[Ca2+] is analyzed. C shows the spatially averaged Δ[Ca2+] traces calculated from the traces in A by the kinetic form of the 1:1 binding equation.

References

    1. Adrian RH, Peachey LD. Reconstruction of the action potential of frog sartorius muscle. J Physiol (Camb) 1973;235:103–131. - PMC - PubMed
    1. Baylor SM, Chandler WK, Marshall MW. Sarcoplasmic reticulum calcium release in frog skeletal muscle fibres estimated from arsenazo III calcium transients. J Physiol (Camb) 1983;344:625–666. - PMC - PubMed
    1. Baylor SM, Harkins AB, Kurebayashi N. Response to Westerblad and Allen. Biophys J. 1994;66:927–928.
    1. Baylor SM, Hollingworth S. Fura2 calcium transients in frog skeletal muscle fibres. J Physiol (Camb) 1988;403:151–192. - PMC - PubMed
    1. Baylor SM, Hollingworth S. The transient binding of calcium to ATP and diffusion of Ca-ATP help shape the amplitude and time course of the myoplasmic free Ca transient (Δ[Ca]) Biophys J. 1998;74:A235.

Publication types

MeSH terms