. 1998 Sep;64(9):3256-63.
doi: 10.1128/AEM.64.9.3256-3263.1998.

Contribution of indole-3-acetic acid production to the epiphytic fitness of erwinia herbicola

Affiliations

Contribution of indole-3-acetic acid production to the epiphytic fitness of erwinia herbicola

MT Brandl et al. Appl Environ Microbiol. 1998 Sep.

Abstract

Erwinia herbicola 299R produces large quantities of indole-3-acetic acid (IAA) in culture media supplemented with L-tryptophan. To assess the contribution of IAA production to epiphytic fitness, the population dynamics of the wild-type strain and an IAA-deficient mutant of this strain on leaves were studied. Strain 299XYLE, an isogenic IAA-deficient mutant of strain 299R, was constructed by insertional interruption of the indolepyruvate decarboxylase gene of strain 299R with the xylE gene, which encodes a 2,3-catechol dioxygenase from Pseudomonas putida mt-2. The xylE gene provided a useful marker for monitoring populations of the IAA-deficient mutant strain in mixed populations with the parental strain in ecological studies. A root bioassay for IAA, in which strain 299XYLE inhibited significantly less root elongation than strain 299R, provided evidence that E. herbicola produces IAA on plant surfaces in amounts sufficient to affect the physiology of its host and that IAA production in strain 299R is not solely an in vitro phenomenon. The epiphytic fitness of strains 299R and 299XYLE was evaluated in greenhouse and field studies by analysis of changes in the ratio of the population sizes of these two strains after inoculation as mixtures onto plants. Populations of the parental strain increased to approximately twice those of the IAA-deficient mutant strain after coinoculation in a proportion of 1:1 onto bean plants in the greenhouse and onto pear flowers in field studies. In all experiments, the ratio of the population sizes of strain 299R and 299XYLE increased during periods of active growth on plant tissue but not when population sizes were not increasing with time.


Figures
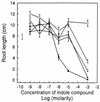
FIG. 1
FIG. 1
Effect of indole derivatives on the elongation of radish roots. Roots were grown in growth packs wetted with tryptophan (◊), indolepyruvate (•), indoleacetaldehyde (□), TOL (○), or IAA (■) solutions of increasing concentrations. Distilled water was used for the control treatment (×). Each value is the mean for five replicate packs containing 10 roots each; error bars indicate ±1 standard error of the mean.
FIG. 2
FIG. 2
Effect of E. herbicola 299R and 299XYLE on the elongation of radish roots (solid bars) and their respective populations (hatched bars) on 2-cm root tips, as measured in the root bioassay for IAA. The control treatment (CTL) consisted of KP buffer. Values marked by the same letter were not significantly different, as determined by the Duncan’s multiple-range test, at a P value of 0.05.
FIG. 3
FIG. 3
Cell density dynamics of E. herbicola 299R and 299XYLE in a competition experiment in which both were coinoculated in a ratio of 1:1 in minimal A medium (■) and minimal A medium containing 1.28% NaCl (○). Values represent the mean of the ratio of the cell concentration of strain 299R to that of strain 299XYLE, and error bars represent the standard error of the mean.
FIG. 4
FIG. 4
Population dynamics of E. herbicola 299R (□) and the isogenic IAA-deficient xylE insertional mutant, 299XYLE (•), after inoculation of each strain individually onto bean plants in a greenhouse experiment. The error bars represent ±1 standard error of the mean of the log-transformed bacterial population sizes.
FIG. 5
FIG. 5
Change in the ratio of the population of E. herbicola 299R to that of E. herbicola 299XYLE over time after the strains were coinoculated in proportions of 1:1 (A), 1:10 (B), and 10:1 (C) onto bean plants in a greenhouse experiment. Values represent the mean of the ratios of the arithmetic population sizes of the two strains, determined from individual leaves. Error bars represent ±1 standard error of the mean.
FIG. 6
FIG. 6
Population dynamics of E. herbicola 299R (□) and the isogenic IAA-deficient mutant, 299XYLE (•), after inoculation of each strain individually onto pear flowers in the field in 1994. Error bars represent ±1 standard error of the mean of the log-transformed bacterial population sizes. Samples collected before approximately 9 days after inoculation consisted of immature or mature pear flowers and thereafter consisted of immature fruits.
FIG. 7
FIG. 7
Population dynamics of E. herbicola 299R (□) and 299XYLE (•) and change in the ratio (○) of their respective populations after coinoculation in a proportion of 1:1 onto pear flowers in the field in 1994. Values represent the mean of the log-transformed population sizes of 299R and 299XYLE and the mean of the log-transformed ratio of the untransformed population sizes of these strains on individual flowers. Error bars represent ±1 standard error of the mean. For ratio data, only the standard error of the mean below the mean is shown for clarity. Numbers in parentheses on the right-hand y axis represent the antilog of the log-transformed ratio of population sizes, for easier interpretation of the data.
FIG. 8
FIG. 8
Regression against time of the log-transformed ratios of the arithmetic population sizes of E. herbicola 299R and 299XYLE from individual pear flowers or young fruits after inoculation of the flowers with a 1:1 mixture of these strains for the entire sampling season in 1994. The line drawn represents the linear regression y = 0.006x + 0.03 (P = 0.06, R2 = 0.01).
FIG. 9
FIG. 9
Regression of the change in the ratio of the population size of E. herbicola 299R to that of E. herbicola 299XYLE against the change in the combined population sizes of these two strains when coinoculated onto pear flowers for three consecutive field seasons. Each axis represents the slope calculated from the regression of the mean of the log-transformed population ratio (ordinate) and the mean of the log-transformed population size (abscissa) against time for individual periods when the combined populations of the two strains were either generally increasing or generally decreasing. Numbers in parentheses on the ordinate represent the antilog of the rate of change in the mean of the log-transformed ratio per day, for easier interpretation of the data. The line drawn represents the linear regression y = 0.3x − 0.0008 (P = 0.003, R2 = 0.85).

References

    1. Brandl M, Clark E M, Lindow S E. Characterization of the indole-3-acetic acid (IAA) biosynthetic pathway in an epiphytic strain of Erwinia herbicola and IAA production in vitro. Can J Microbiol. 1996;42:586–592.
    1. Brandl M T, Lindow S E. Cloning and characterization of a locus encoding an indolepyruvate decarboxylase involved in indole-3-acetic acid synthesis in Erwinia herbicola. Appl Environ Microbiol. 1996;62:4121–4128. - PMC - PubMed
    1. Brandl M T, Lindow S E. Environmental signals modulate the expression of an indole-3-acetic acid biosynthetic gene in Erwinia herbicola. Mol Plant-Microbe Interact. 1997;10:499–505.
    1. Chet I, Zilberstein Y, Henis Y. Chemotaxis of Pseudomonas lachrymans to plant extracts and to water droplets collected from the leaf surface of resistant and susceptible plants. Physiol Plant Pathol. 1973;3:473–479.
    1. Costacurta A, Vanderleyden J. Synthesis of phytohormones by plant-associated bacteria. Crit Rev Microbiol. 1995;21:1–18. - PubMed

LinkOut - more resources