. 1998 Sep;64(9):3346-51.
doi: 10.1128/AEM.64.9.3346-3351.1998.

Growth rate regulation of rRNA content of a marine synechococcus (Cyanobacterium) strain

Affiliations

Growth rate regulation of rRNA content of a marine synechococcus (Cyanobacterium) strain

BJ Binder et al. Appl Environ Microbiol. 1998 Sep.

Abstract

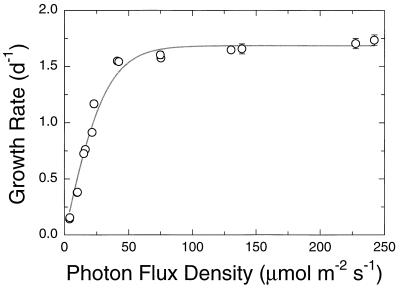
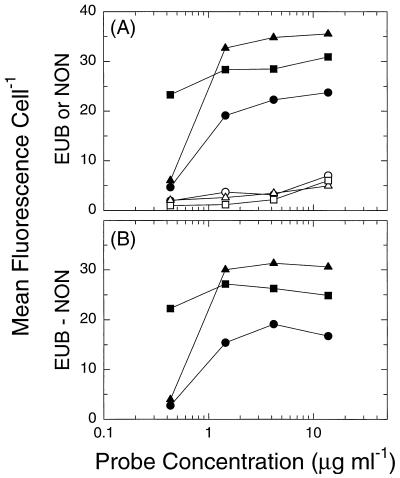
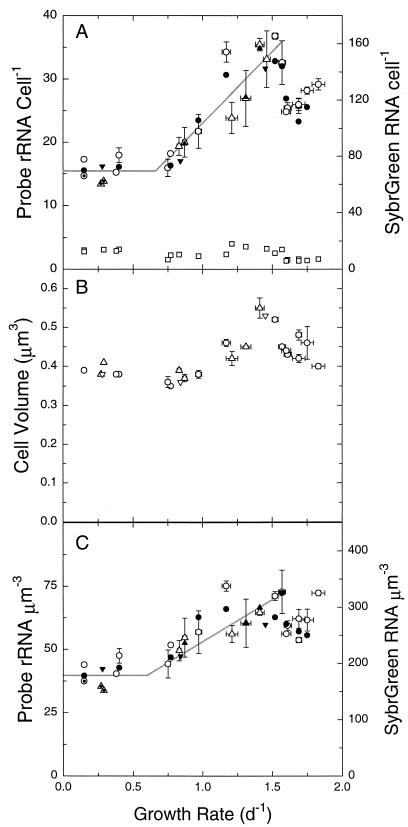
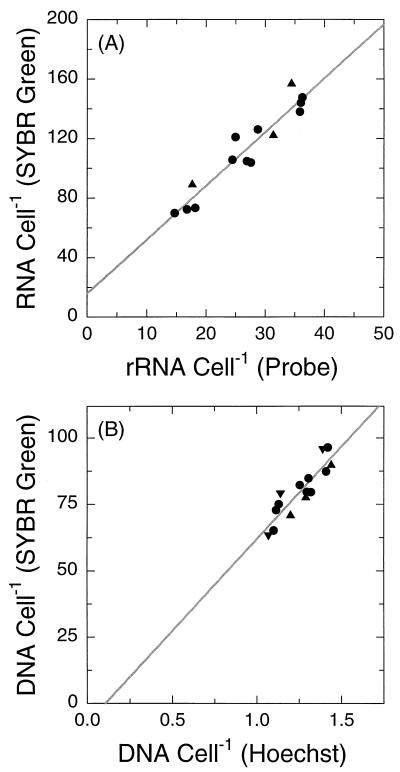
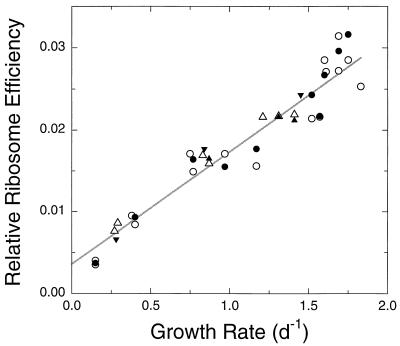
The relationship between growth rate and rRNA content in a marine Synechococcus strain was examined. A combination of flow cytometry and whole-cell hybridization with fluorescently labeled 16S rRNA-targeted oligonucleotide probes was used to measure the rRNA content of Synechococcus strain WH8101 cells grown at a range of light-limited growth rates. The sensitivity of this approach was sufficient for the analysis of rRNA even in very slowly growing Synechococcus cells (&mgr; = 0.15 day-1). The relationship between growth rate and cellular rRNA content comprised three phases: (i) at low growth rates (< approximately 0.7 day-1), rRNA cell-1 remained approximately constant; (ii) at intermediate rates ( approximately 0. 7 - 1.6 day-1), rRNA cell-1 increased proportionally with growth rate; and (iii) at the highest, light-saturated rates (> approximately 1.6 day-1), rRNA cell-1 dropped abruptly. Total cellular RNA (as measured with the nucleic acid stain SYBR Green II) was well correlated with the probe-based measure of rRNA and varied in a similar manner with growth rate. Mean cell volume and rRNA concentration (amount of rRNA per cubic micrometer) were related to growth rate in a manner similar to rRNA cell-1, although the overall magnitude of change in both cases was reduced. These patterns are hypothesized to reflect an approximately linear increase in ribosome efficiency with increasing growth rate, which is consistent with the prevailing prokaryotic model at low growth rates. Taken together, these results support the notion that measurements of cellular rRNA content might be useful for estimating in situ growth rates in natural Synechococcus populations.


Figures

FIG. 1
FIG. 1
Relationship between specific growth rate and light intensity for Synechococcus strain WH8101. Shown are the means and standard errors for at least four consecutive transfers of a given culture (corresponding to ∼16 generations); line is the best-fit hyperbolic tangent function (α = 2.97, μmax = 1.69; r2 = 0.98) (15). Error bars not shown are contained within the symbols. d, day.
FIG. 2
FIG. 2
Flow cytometric signature of hybridized Synechococcus cells. (A) Two-parameter histogram of red fluorescence (derived from phycobiliprotein autofluorescence) and forward angle light scatter (related to cell size) showing cells and latex bead standards. Contour lines indicate the relative number of cells having the specified combination of red fluorescence and light scatter and correspond to 0.01%, 0.02%, 0.04%, 0.08%, etc., of the total population within the corresponding histogram bin. (B) Frequency distribution of BODIPY fluorescence for the cells identified in panel A and hybridized with EUB338 (dark line) or NON338 (light line).
FIG. 3
FIG. 3
Effect of probe concentration on mean cellular fluorescence in cells growing at 0.40 (○, •), 1.17 (▵, ▴), and 1.75 (□, ■) day−1. (A) Cells hybridized with EUB338 (closed symbols) or NON338 (open symbols). (B) The difference between EUB338- and NON338-conferred fluorescence for each cell type. Data shown represent individual determinations.
FIG. 4
FIG. 4
Variation of cellular rRNA, total RNA, and volume with growth rate in Synechococcus strain WH8101. (A) Cellular rRNA content, as reflected by EUB338-conferred fluorescence, in cells from two different experiments (○, ▵); NON338-conferred fluorescence (□); and total cellular RNA as measured with SYBR Green II in cells from three different experiments (•, ▴, ▾). EUB338-conferred fluorescence represents the mean and standard error of replicate cultures at a given light intensity (except for dotted symbols, which represent data from single cultures). Data for NON338-conferred fluorescence and SYBR Green RNA represent individual determinations. Growth rates and associated error bars as in Fig. 1. Both y axes are relative scales; the relationship between the two scales is arbitrary. (B) Mean cell volume of cells from three different experiments (○, ▵, ▿). Error bars are as in panel A. (C) rRNA and RNA concentrations, as calculated from the data in panels A and B. Symbols, error bars, and axis scaling are as in panel A. Lines in panels A and C were drawn by eye. d, day.
FIG. 5
FIG. 5
Comparison of SYBR Green II-based measurements of cellular RNA (A) and DNA (B) with probe-based measurements of rRNA and Hoechst-based measurements of DNA, respectively. Points represent individual determinations on the same sample; lines are least-square regressions, with SYBR Green determinations taken as the dependent variable in both cases. Symbols are as in Fig. 4B. The Hoechst-based DNA measurement is expressed in genome equivalents; all other axis scales represent relative fluorescence.
FIG. 6
FIG. 6
Relative ribosome efficiency versus growth rate. Ribosome efficiency was calculated from the probe-based measurements of rRNA (open symbols) and SYBR Green-based measurements of total RNA (closed symbols) shown in Fig. 4C (see text). Relative scaling of these two calculated efficiencies is arbitrary but consistent with scaling in Fig. 4C. Line shows linear regression of probe-based efficiencies versus growth rate. Symbols are as in Fig. 4. d, day.

References

    1. Alm E W, Oerther D B, Larsen N, Stahl D A, Raskin L. The Oligonucleotide Probe Database. Appl Environ Microbiol. 1996;62:3557–3559. - PMC - PubMed
    1. Amann R I, Binder B J, Olson R J, Chisholm S W, Devereux R, Stahl D A. Combination of 16S rRNA-targeted oligonucleotide probes with flow cytometry for analyzing mixed microbial populations. Appl Environ Microbiol. 1990;56:1919–1925. - PMC - PubMed
    1. Amann R I, Ludwig W, Schleifer K-H. Phylogenetic identification and in situ detection of individual cells without cultivation. Microbiol Rev. 1995;59:143–169. - PMC - PubMed
    1. Armbrust E V, Bowen J D, Olson R J, Chisholm S W. The effects of light on the cell cycle of a marine Synechococcus strain. Appl Environ Microbiol. 1989;55:425–432. - PMC - PubMed
    1. Binder B J, Chisholm S W. Cell cycle regulation in marine Synechococcus sp. strains. Appl Environ Microbiol. 1995;61:708–717. - PMC - PubMed

LinkOut - more resources