Review
. 1998 Sep;62(3):667-83.
doi: 10.1128/MMBR.62.3.667-683.1998.

Chlorophyll fluorescence analysis of cyanobacterial photosynthesis and acclimation

Affiliations
Review

Chlorophyll fluorescence analysis of cyanobacterial photosynthesis and acclimation

D Campbell et al. Microbiol Mol Biol Rev. 1998 Sep.

Abstract

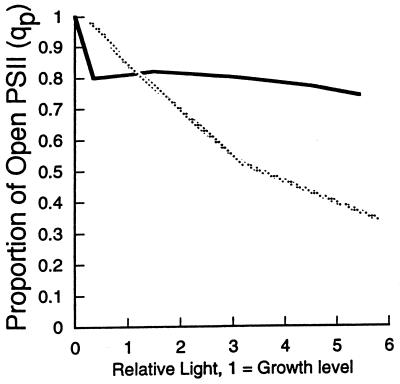
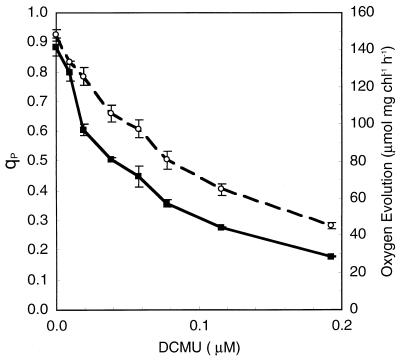
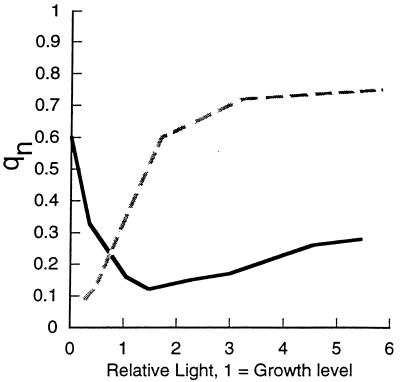
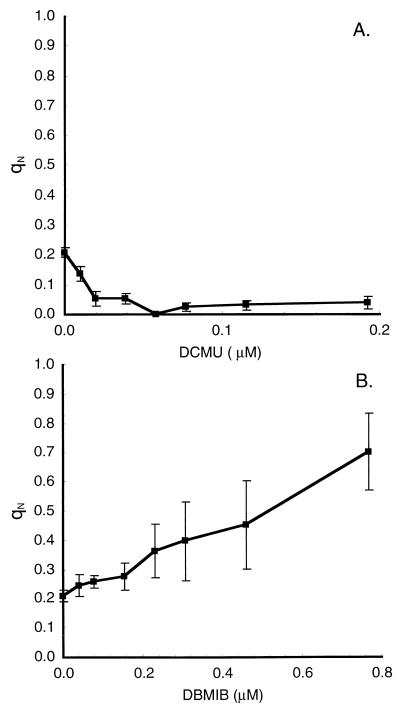
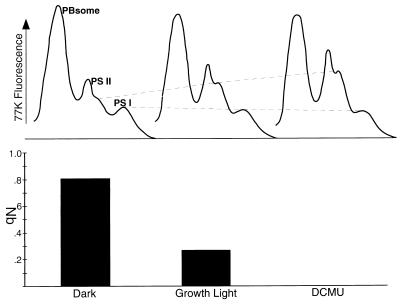
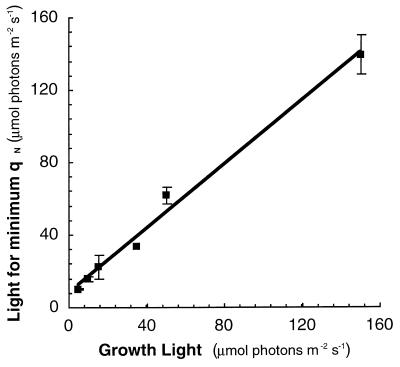
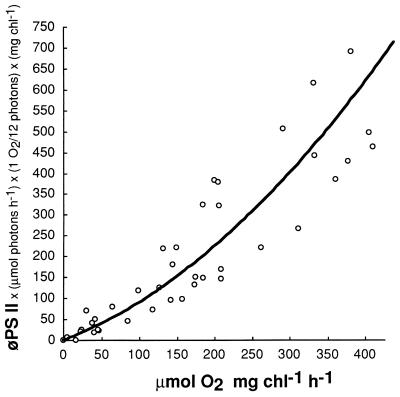
Cyanobacteria are ecologically important photosynthetic prokaryotes that also serve as popular model organisms for studies of photosynthesis and gene regulation. Both molecular and ecological studies of cyanobacteria benefit from real-time information on photosynthesis and acclimation. Monitoring in vivo chlorophyll fluorescence can provide noninvasive measures of photosynthetic physiology in a wide range of cyanobacteria and cyanolichens and requires only small samples. Cyanobacterial fluorescence patterns are distinct from those of plants, because of key structural and functional properties of cyanobacteria. These include significant fluorescence emission from the light-harvesting phycobiliproteins; large and rapid changes in fluorescence yield (state transitions) which depend on metabolic and environmental conditions; and flexible, overlapping respiratory and photosynthetic electron transport chains. The fluorescence parameters FV/FM, FV'/FM',qp,qN, NPQ, and phiPS II were originally developed to extract information from the fluorescence signals of higher plants. In this review, we consider how the special properties of cyanobacteria can be accommodated and used to extract biologically useful information from cyanobacterial in vivo chlorophyll fluorescence signals. We describe how the pattern of fluorescence yield versus light intensity can be used to predict the acclimated light level for a cyanobacterial population, giving information valuable for both laboratory and field studies of acclimation processes. The size of the change in fluorescence yield during dark-to-light transitions can provide information on respiration and the iron status of the cyanobacteria. Finally, fluorescence parameters can be used to estimate the electron transport rate at the acclimated growth light intensity.


Figures

FIG. 1
FIG. 1
Cyanobacterial thylakoid electron transport. This schematic diagram is based on data primarily from Synechocystis sp. strain PCC 6701, which contains phycoerythrin, phycocyanin, and allophycocyanin pigment proteins in the phycobilisomes. The phycobilisomes move rapidly along the surface of the thylakoid membranes (96), so the phycobilisome-PS II dimer complex is transient. Excitation absorbed by the phycobilisome can reach either PS II or PS I, particularly in cells in state II. This excitation flow may involve specialized subunits of the phycobilisome core (not shown here). The composition and organization of the phycobilisome rods and core is variable in different cyanobacteria; the three-cylinder core and six-peripheral rod configuration is common, but in Synechococcus sp. strain PCC 7942 the core contains only two cylinders. The PS I-PS II stoichiometry is usually higher than 1:1; in the Synechococcus cells used for most experiments described in later figures, the ratio was 2 to 3 PS I/PS II. There are multiple interacting and flexible paths of electron flow including linear flow from water to NADPH; several possible cyclic pathways around subsections of the transport system; pseudocyclic flows from water with electron donation back to oxygen; and respiratory flows of electrons derived from reserve molecules. Some possible flows are indicated by black arrows. The donor-acceptor stoichiometries of electron transfers are not shown, but various redox centres carry different numbers of electrons, from 1 (e.g., PC, cytochrome c553, Fd, and Flvd), 2 [e.g., PQ and NAD(P)H] and even 4 (the Mn complex of PS II). The redox reactions are reversible depending upon the oxidation-reduction status of the acceptor-donor pair and the local proton concentration, so that in some cases the indicated direction of electron flow could be reversed. Proton uptake and transmembrane transport are indicated by dashed arrows; other proton translocation pathways may also exist. The plastoquinone-plastoquinol pool can be reduced by electrons from PS II, from an NAD(P)H dehydrogenase(s) (NDH) whose composition and substrate specifities vary between strains, and from the “r” site of the cytochrome bf complex. Plastoquinone reduction by NDH is the entry point for electrons derived from respiration. The various plastoquinone reductions involve proton uptake from the stroma, while oxidation of a plastoquinol at the ‘o’ site of the cytochrome bf complex releases two protons to the lumen. As indicated, electron and ATP flow to carbohydrate and nitrogen metabolism can have strong and rapid effects on thylakoid function, while electrons derived from carbohydrate reserves also enter the thylakoid system and influence photosynthetic function. During ATP synthesis, protons enter a channel from the lumen formed by the a subunit of Cf0, and their exit to the cytosol is coupled to rotation of the ring of c subunits through directed diffusion (37). The c-ring rotation drives rotation of the γ subunit of CF1 within the α3β3 ring (117), which in turn drives a sequence of conformational changes in three identical ATP/ADP binding sites. The changes in binding site lead to phosphorylation of ADP and expulsion of ATP from the site. The stoichiometry is 1 ATP/4H+ passing through the complex (146). Abbreviations: hν, photons of visible light; PE, phycoerythrin α3β3 trimers; CPC, phycocyanin α3β3 trimers; AP, allophycocyanin rods of the phycobilisome core, composed partly of α3β3 trimer disks along with other related phycobilin-binding proteins; D1 and D2, core polypeptide dimer of PS II which binds the redox cofactors; Cyt b559, cytochrome b559 in the PS II core; Mn4, manganese cluster of the oxygen evolving complex; 9 and 33, 9- and 33-kDa subunits of the oxygen evolving complex of PS II; CP43 and CP47, 43- and 47-kDa chlorophyll protein complexes associated with the PS II core; P680, dimeric chlorophyll center which is photooxidized in PS II; Pheo, pheophytin primary electron acceptor of PS II; QA, the quinone secondary electron acceptor of PS II; QB, a plastoquinone bound to PS II which accepts two electrons from QA and equilibrates with the thylakoidal plastoquinone-plastoquinol pool; NDH, NAD(P)H dehydrogenase (in various strains there are different forms of the complex with differing activities and specificities for NADH or NADPH); Cyt b6, a cytochrome containing both low- and high-potential heme centers which are involved in a Q-cycle electron flow from plastoquinol bound to the o site to plastoquinone bound to the “r” site (this cycle results in proton translocation); SIV, subunit IV of the cytochrome bf complex; FeS, an iron-sulfur redox center; PC, plastocyanin, a copper-containing luminal single-electron transport protein; Cyt c553, cytochrome c553, a heme-containing luminal single-electron transport protein (plastocyanin and cytochrome c553 can be reciprocally regulated in response to copper and iron availability); PsaA and PsaB, related chlorophyll binding proteins which form the core of PS I; P700, the chlorophyll which is photooxidized in PS I; A0, A1, FX, FA, FB, bound redox intermediates of PS I; Flvd, flavodoxin (a flavin protein which is a cytosolic mobile single electron carrier that can accept electrons from PS I and that can substitute for ferredoxin, particularly under low-iron conditions); Fd, ferredoxin (an iron protein which is a cytosolic mobile single-electron carrier that can accept electrons from PS I and can transfer the electrons to NADPH or participate directly in some biosynthetic reactions, particularly in nitrogen metabolism); FNR, ferredoxin/flavodoxin NADPH oxidoreductase; Cyt ox, the cytochrome oxidase complex involved in respiratory electron transport (it can also withdraw electrons from photosynthetic electron transport, particularly under excess light); α to γ, subunits of the CF1 complex of ATP synthase; a to c, subunits of the CF0 complex of ATP synthase. Modified and redrawn from reference with permission of the publisher.
FIG. 2
FIG. 2
Fluorescence emission trace for cyanobacterial quenching analysis. This trace from Synechococcus sp. strain PCC 7942 shows a typical cyanobacterial response over a series of increasing light intensities. The brief pulses of saturating light result in a rapid increase in fluorescence as PS II centers close transiently. The measurement terminates with addition of DCMU, which closes PS II centers, causing a rapid rise in fluorescence followed by a slower fluorescence rise phase as the cells go to full state I. Modified from reference with permission of the publisher.
FIG. 3
FIG. 3
FO fluorescence increases with the phycocyanin content in Synechococcus sp. strain PCC 7942. FO fluorescence is normalized to the molar chlorophyll concentration to allow for different culture concentrations and plotted against the molar ratio of phycocyanin (PC) to chlorophyll (Chl). Each point is a single determination on an independently grown culture. ○, wild-type cells; ■, mutant strain which lacks phycobilisome rods and contains no phycocyanin. Note that at low phycocyanin contents, FO in the wild type falls toward the level in the rodless mutant. Modified from reference with permission of the publisher.
FIG. 4
FIG. 4
Photoinhibition of oxygen evolution correlates with declines in FV′/FM′ in Synechococcus sp. strain PCC 7942. Cultures were subjected to a photoinhibitory decrease in growth temperature from 37 to 25°C. Oxygen evolution and FV′/FM′ were monitored and expressed as a percentages of the pretreatment control values. Four cultures were used. y = 0.79x + 21; R2 = 0.89.
FIG. 5
FIG. 5
Photochemical quenching of fluorescence plotted against light intensity. Typical light response curves of photochemical quenching in a cyanobacterium, Synechococcus sp. strain) PCC 7942 (solid line), and in rye for a plant-type pattern (dotted line) are shown. For comparison, light intensity is expressed relative to the growth light intensity; 1 = growth level. The actual growth light intensities were 50 μmol of photons m−2 s−1 for the cyanobacterium and 250 μmol of photons m−2 s−1 for the rye.
FIG. 6
FIG. 6
Photochemical quenching of fluorescence under DCMU treatment compared with oxygen evolution in Synechococcus sp. strain PCC 7942. DCMU inhibits oxygen evolution (○), closing PS II centers in parallel (qP) (■). Results are means and standard errors of measurements on the same culture at 37°C (n = 3). Modified from reference with permission of the publisher.
FIG. 7
FIG. 7
Nonphotochemical quenching of fluorescence plotted against light. Typical light response curves of nonphotochemical quenching in a cyanobacterium, Synechococcus sp. strain PCC 7942 (solid line), and in rye for a plant-type pattern (dotted line) are shown. For comparison, light intensity is expressed relative to the growth light intensity; 1 = growth level. The actual growth light intensities were 50 μmol of photons m−2 s−1 for the cyanobacterium and 250 μmol of photons m−2 s−1 for the rye.
FIG. 8
FIG. 8
Nonphotochemical quenching of fluorescence under DCMU (A) and DBMIB (B) treatments. Modulated fluorescence traces (Fig. 2) were measured under the growth light intensity of 50 μmol of photons m−2 s−1. Results are means and standard errors of measurements on the same culture at 37°C (n = 3). Modified from reference with permission of the publisher.
FIG. 9
FIG. 9
77K Fluorescence emission spectra show that changing qN reflects state transitions. The dashed lines emphasize increasing PS II fluorescence and decreasing PS I fluorescence in parallel with the drop in nonphotochemical quenching, measured in the same cultures. A Synechococcus sp. strain PCC 7942 culture sample was incubated in the PAM cuvette in darkness, under the growth light intensity (50 μmol of photons m−2 s−1), and after addition of DCMU under continuing illumination. For each condition, qN was measured and a small sample was taken for 77K fluorescence emission spectral analysis. Excitation of 77K fluorescence was carried out with 574 nm light absorbed by the phycobilisome (PBsome). Fluorescence spectra are from samples of equal chlorophyll content but are not otherwise normalized.
FIG. 10
FIG. 10
Near the growth light intensity, qN reaches a minimum for a wide range of cyanobacterial strains and culture conditions. Mean values are plotted for strains grown at 5 (n = 3), 10 (n = 5), 15 (n = 6), 35 (n = 1), 50 (n = 20) and 150 (n = 3) μmol of photons m−2 s−1. The strains were Anabaena/Nostoc sp. strain 7120, Calothrix sp. strain PCC 7601, Nostoc sp., Pseudanabaena sp. strain PCC 6901, Synechococcus sp. strain PCC 7942, Synechococcus sp. strain PCC 6301, and Synechocystis sp. strain PCC 6701. Modified from reference with permission of the publisher.
FIG. 11
FIG. 11
φPS II reflects O2 evolution. Synechococcus sp. strain PCC 7942 was grown under 50 μmol of photons m−2 s−1 at 37°C and then incubated under a range of light intensities. Gross oxygen evolution (micromoles of O2 per milligram of chlorophyll per hour) was estimated as light-dependent oxygen evolution minus dark uptake. φPS II = (FM′ − FS)/FM′ = (FV′/FM′)qP. Ii = micromoles of photons incident on the sample per hour.

References

    1. Adams W W, Demmig-Adams B. Energy dissipation and photoprotection in leaves of higher plants. In: Yamamoto H Y, Smith C M, editors. Photosynthetic responses to the environment. Rockville, Md: American Society of Plant Physiologists; 1993. pp. 27–36.
    1. Allen J F, Sanders C E, Holmes N G. Correlation of membrane protein phosphorylation with excitation energy distribution in the cyanobacterium Synechococcus 6301. FEBS Lett. 1985;193:271–275.
    1. Asada K, Kiso K, Yoshikawa K. Univalent reduction of molecular oxygen by spinach chloroplasts on illumination. J Biol Chem. 1974;249:2175–2181. - PubMed
    1. Badger M R, Price G D. The CO2 concentrating mechanism in cyanobacteria and green algae. Physiol Plant. 1992;84:606–615.
    1. Badger M R, Schreiber U. Effects of inorganic carbon accumulation on photosynthetic oxygen reduction and cyclic electron flow in the cyanobacterium Synechococcus PCC 7942. Photosynth Res. 1993;37:177–191. - PubMed

Publication types

MeSH terms

LinkOut - more resources