Review
. 1998 Sep;62(3):695-724.
doi: 10.1128/MMBR.62.3.695-724.1998.

Aerobic anoxygenic phototrophic bacteria

Affiliations
Review

Aerobic anoxygenic phototrophic bacteria

V V Yurkov et al. Microbiol Mol Biol Rev. 1998 Sep.

Abstract

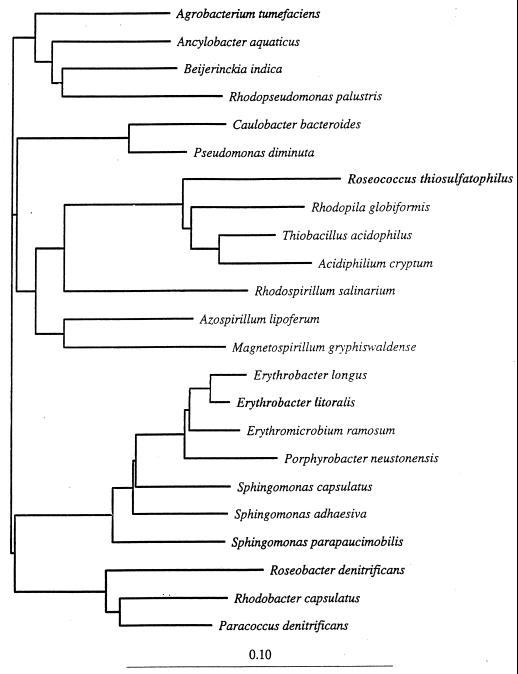
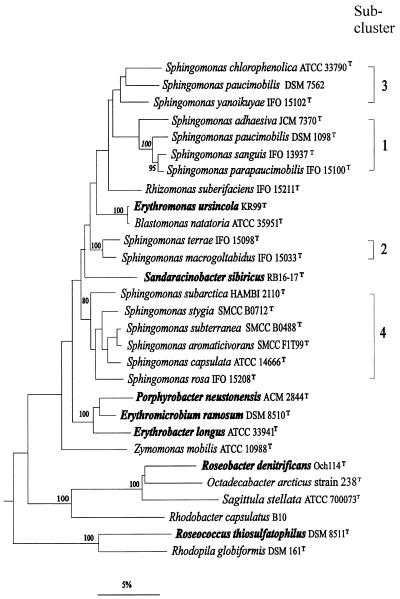
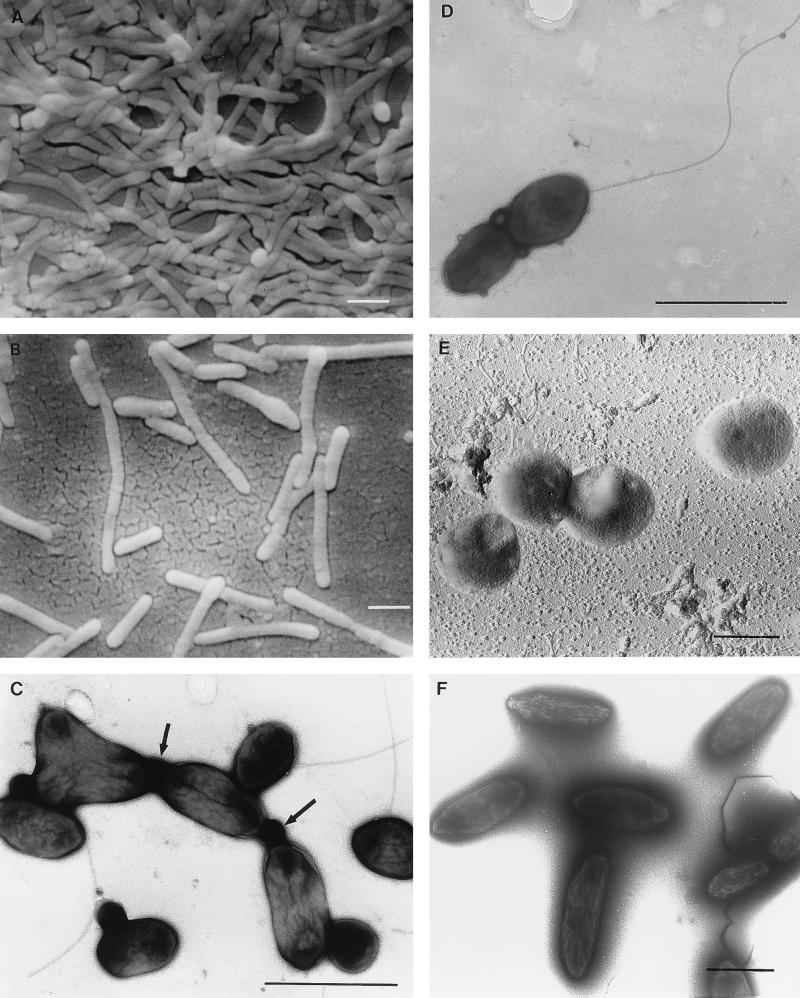
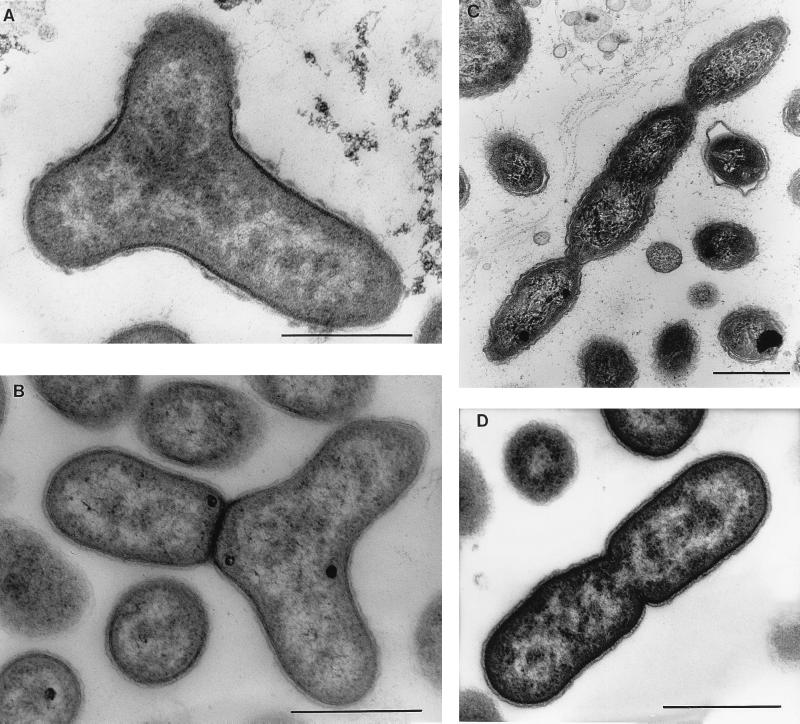
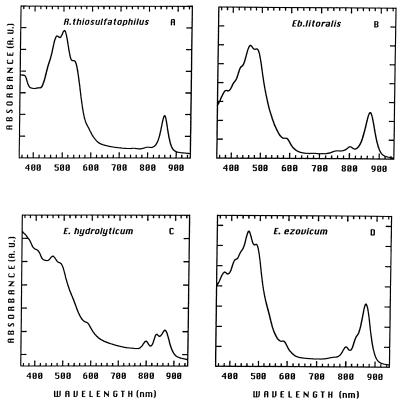
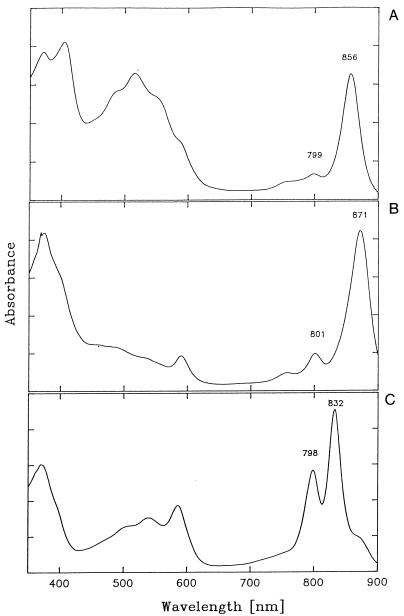
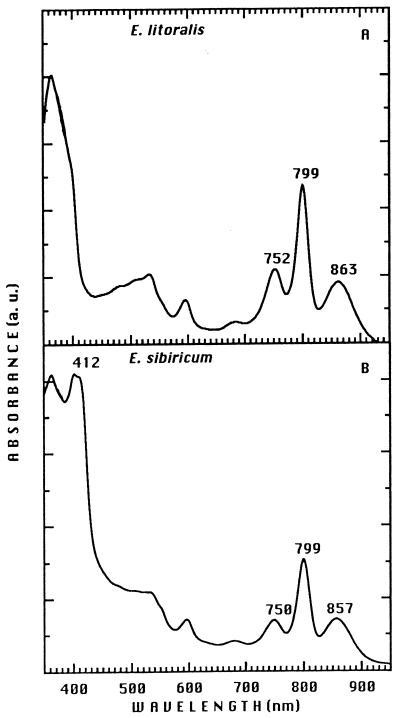
The aerobic anoxygenic phototrophic bacteria are a relatively recently discovered bacterial group. Although taxonomically and phylogenetically heterogeneous, these bacteria share the following distinguishing features: the presence of bacteriochlorophyll a incorporated into reaction center and light-harvesting complexes, low levels of the photosynthetic unit in cells, an abundance of carotenoids, a strong inhibition by light of bacteriochlorophyll synthesis, and the inability to grow photosynthetically under anaerobic conditions. Aerobic anoxygenic phototrophic bacteria are classified in two marine (Erythrobacter and Roseobacter) and six freshwater (Acidiphilium, Erythromicrobium, Erythromonas, Porphyrobacter, Roseococcus, and Sandaracinobacter) genera, which phylogenetically belong to the alpha-1, alpha-3, and alpha-4 subclasses of the class Proteobacteria. Despite this phylogenetic information, the evolution and ancestry of their photosynthetic properties are unclear. We discuss several current proposals for the evolutionary origin of aerobic phototrophic bacteria. The closest phylogenetic relatives of aerobic phototrophic bacteria include facultatively anaerobic purple nonsulfur phototrophic bacteria. Since these two bacterial groups share many properties, yet have significant differences, we compare and contrast their physiology, with an emphasis on morphology and photosynthetic and other metabolic processes.


Figures

FIG. 1
FIG. 1
16S rDNA phylogenetic positions of representatives of the α subclass of the Proteobacteria, as determined by the neighbor-joining method. Scale bar = 10% difference in nucleotide sequences. The total distance between two organisms is the sum of the horizontal branch lengths (230).
FIG. 2
FIG. 2
16S rDNA dendrogram of relatedness showing the phylogenetic positions of E. ursincola and S. sibiricus released from the genus Erythromicrobium, within the radiation of members of the genus Sphingomonas and related taxa. Numbers refer to bootstrap values, of which only those above 80% are shown. Bar = 5% inferred sequence divergence. (This tree was created by E. Stackebrandt.)
FIG. 3
FIG. 3
EMs showing the morphological diversity of aerobic anoxygenic phototrophic bacteria. (A) Distribution of S. sibiricus cells in a microcolony. (B) Single and thread-like cells of S. sibiricus. (C) Pleomorphic cells of strain JF-1 are connected by membranous material (indicated by arrows). (D) A cell of strain JF-1 containing a single flagellum. (E) Coccus cells of R. thiosulfatophilus. (F) Nonmotile cells of the strain 15s.b. embedded in a capsule-like matrix. (A, B, and E) Scanning EMs of carbon-shadowed cells. (C, D, and F) Transmitting EMs of negatively stained cells. Bars, 1 μm.
FIG. 4
FIG. 4
Different types of cell division revealed by electron microscopy of thin sections of aerobic anoxygenic phototrophic species. (A) A strain JF-1 Y cell presumably preceding division to form three daughter cells. The nucleoid is seen as light zones of the section, distributed in three directions. (B) A later stage of Y-cell division. One daughter cell is separated by the cell wall from two as-yet-unseparated nascent cells. (C) E. ezovicum dividing by constrictions. (D) Binary division of the strain JF-1. Bars, 0.5 μm.
FIG. 5
FIG. 5
Absorption spectra of membranes isolated from R. thiosulfatophilus (A), E. litoralis (B), E. hydrolyticum (C), and E. ezovicum (D). Cells were cultivated under the same dark-aerobic condition. A. U., absorbance units.
FIG. 6
FIG. 6
Chemical structures of highly polar carotenoids (211). (A) C30 carotenoid (4,4′-diapocarotene-4,4′-dioate) (compound I) and the corresponding diglucosyl ester (compound II) of R. thiosulfatophilus. (B) Erythroxanthin sulfate found in cells of E. ramosum, E. longus, and E. litoralis.
FIG. 7
FIG. 7
Absorption spectra of isolated pigment-protein complexes recorded at room temperature (210). (A) LHI-RC complex of R. thiosulfatophilus. (B) E. ramosum LHI-RC. (C) LHII complex of E. ramosum.
FIG. 8
FIG. 8
Absorption spectra of the RC purified from E. litoralis (A) and S. sibiricus (renamed E. sibiricum) (B). a. u., absorbance units.
FIG. 9
FIG. 9
Difference absorption spectra obtained for intact cells of aerobic anoxygenic phototrophic bacteria suspended in growth medium under aerobic conditions. (A) E. ursincola, determined at 50 μs and 5 ms after a saturating flash. (B) E. hydrolyticum, determined at 50 μs and 5 ms. (C) E. litoralis, determined at 50 μs and 7 and 20 ms.
FIG. 10
FIG. 10
Redox titration curves of the RC primary acceptor QA midpoint potential determination performed at pH 7.8. The light-induced absorption changes were detected in membranes 1 ms after the excitation flash. (A) Species lacking an RC-bound cyt c: E. litoralis (○), E. ramosum (•), R. sphaeroides (▾), and R. rubrum (▿), measured at 603 nm. (B) Species containing an RC-bound cyt c: E. ursincola (□), S. sibiricus (■), R. tenuis (▵), and R. viridis (▴), measured at 555 nm. At this wavelength, the light-induced absorption changes are positive at high Eh due to the spectral contribution of the photooxidized primary donor and negative when the ambient potential is lowered due to the absorption changes linked to the RC-bound cyt c (224). (This figure was created with the help of L. Menin.) a. u., absorbance units.
FIG. 11
FIG. 11
Fluctuation during cycles 1 to 5 of the concentration of protein (closed squares) and Bchl a (closed triangles) in a continuous culture (D = 0.081/h) of E. hydrolyticum subjected to a 14-h light–10-h dark regimen. The irradiance employed was 20 μE/m2/s. Dotted lines indicate the theoretical washout rate of Bchl at zero rate of synthesis (232).
FIG. 12
FIG. 12
Time course during cycle 5 of protein (upper panel, closed squares) and Bchl a (upper panel, closed triangles) and the specific rate of growth (lower panel, gray bars; calculated from the curve shown in upper panel) and specific rate of synthesis of Bchl (lower panel, black bars; calculated from the curve shown in upper panel) in a continuous culture (D = 0.081/h) of E. hydrolyticum subjected to a 14-h light–10-h dark regimen. The irradiance employed was 20 μE/m2/s. Dotted lines in the upper panel indicate the theoretical washout rate of Bchl at zero rate of synthesis. The horizontal dashed line in the lower panel indicates the dilution rate (232).
FIG. 13
FIG. 13
Intracytoplasmic components of S. sibiricus revealed by electron microscopy of ultrathin sections. (A and B) Big electron-clear granules of presumed PHB (indicated by arrows) often occupied up to 40 to 50% of the total cell volume, deforming the cell shape. Rare ICM vesicles are indicated by V. (C) Electron-dense granules of presumed polyphosphate (indicated by arrow) occupied up to 30 to 40% of the total cell volume. Bars, 0.5 μm.
FIG. 14
FIG. 14
Electron microscopy of ultrathin sections. Shown are the intracellular localizations of presumed tellurium (indicated by arrows) as a product of tellurite reduction. (A) Two daughter cells of E. ramosum with tellurium crystals apparently interfering with cell division. (B) In E. litoralis, tellurium crystals sometimes occupy as much as 20 to 30% of the cell volume. (C) R. thiosulfatophilus accumulates relatively small Te crystals similar to Te deposits observed in E. coli or Rhodobacter species. Bars, 0.5 μm.

References

    1. Aagaard J, Sistrom W R. Control of synthesis of reaction center bacteriochlorophyll in photosynthetic bacteria. Photochem Photobiol. 1972;15:209–225. - PubMed
    1. Albers H, Gottschalk G. Acetate metabolism in Rhodopseudomonas gelatinosa and several other Rhodospirillaceae. Arch Microbiol. 1976;111:45–49. - PubMed
    1. Arata H, Serikawa Y, Takamiya K I. Trimethylamine-N-oxide respiration by aerobic photosynthetic bacterium, Erythrobacter sp. OCh114. J Biochem. 1988;103:1011–1015. - PubMed
    1. Armstrong G A. Genetic analysis and regulation of carotenoid biosynthesis: structure and function of the crt genes and gene products. In: Blankenship R E, Madigan M T, Bauer C E, editors. Anoxygenic photosynthetic bacteria. Dordrecht, The Netherlands: Kluwer Academic Publishers; 1995. pp. 1135–1157.
    1. Bagnall K W. Selenium, tellurium, and polonium. In: Schmidt M, Siebert W, Bagnall K W, editors. The chemistry of sulfur, selenium, tellurium and polonium. New York, N.Y: Pergamon Press; 1975. pp. 935–1008.

LinkOut - more resources