Review
. 1998 Sep;62(3):725-74.
doi: 10.1128/MMBR.62.3.725-774.1998.

Insertion sequences

Affiliations
Review

Insertion sequences

J Mahillon et al. Microbiol Mol Biol Rev. 1998 Sep.

Abstract

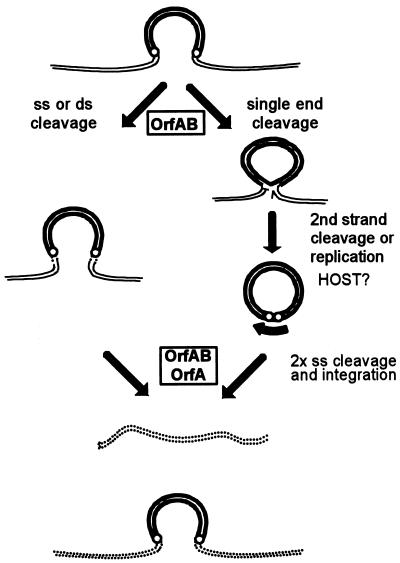
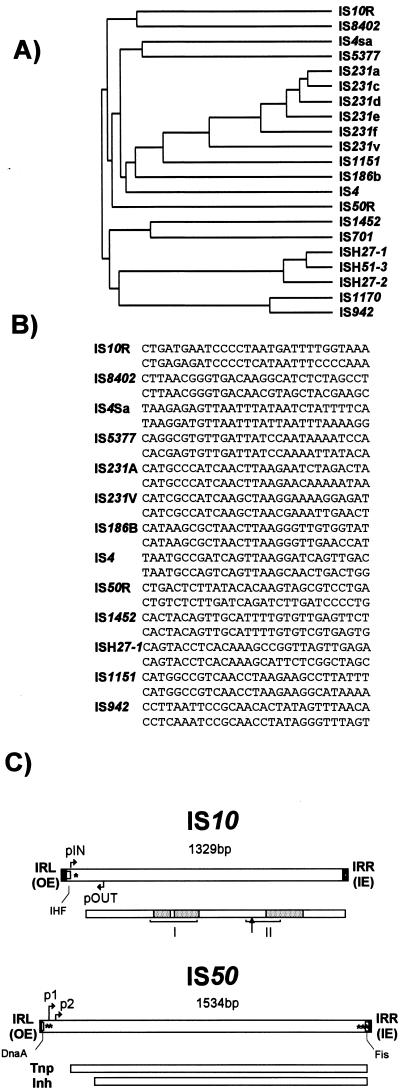
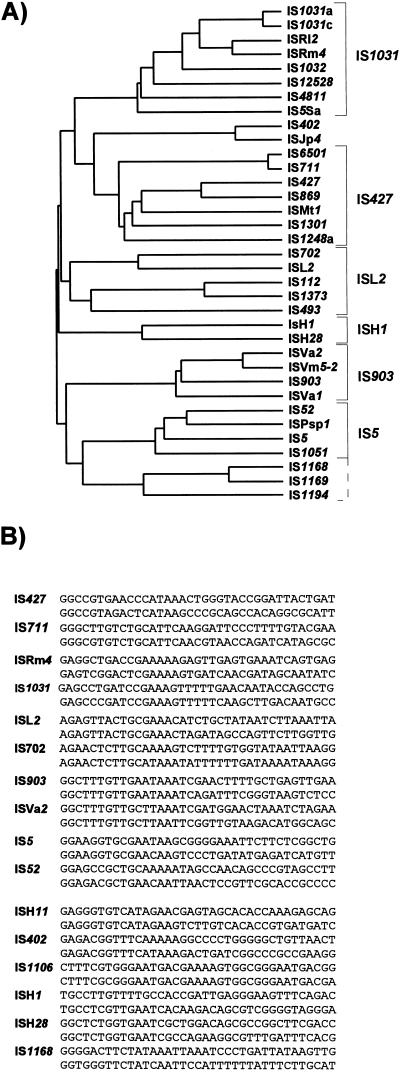
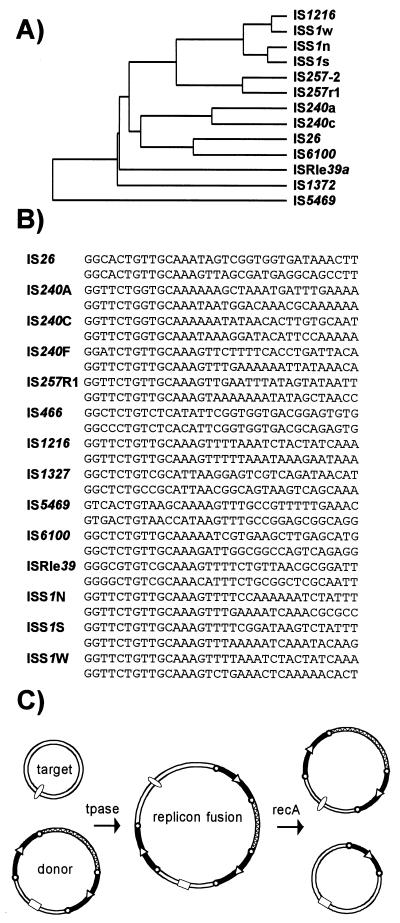
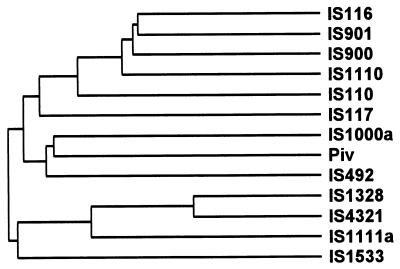
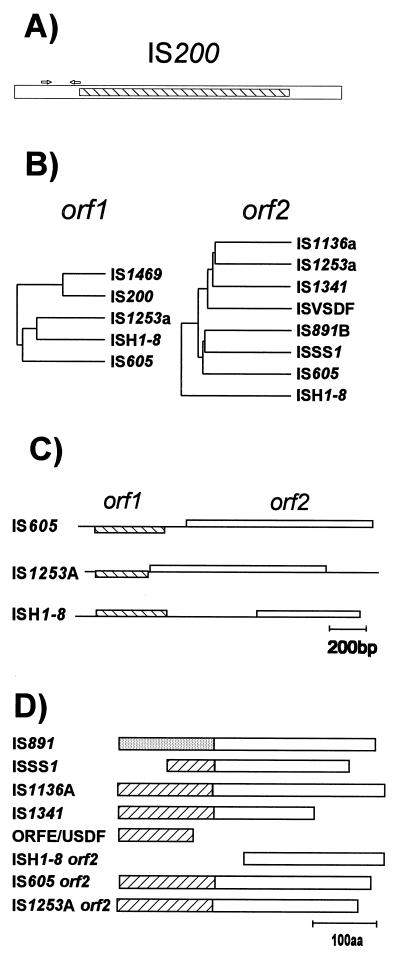
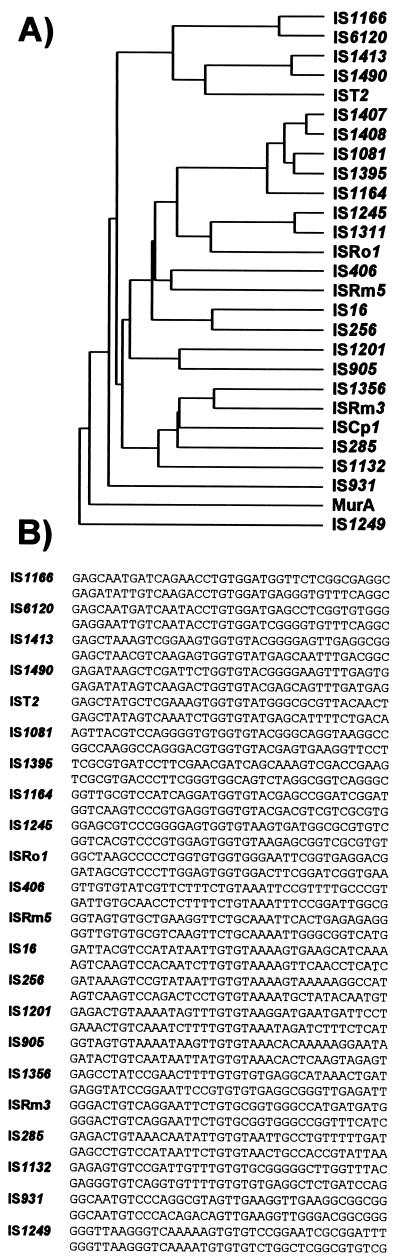
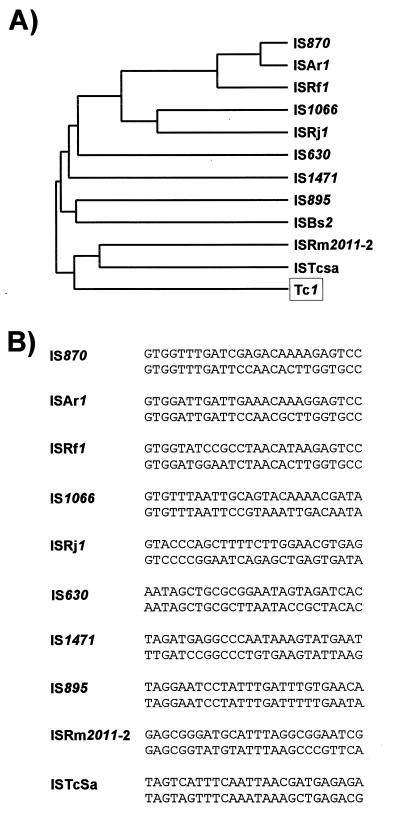
Insertion sequences (ISs) constitute an important component of most bacterial genomes. Over 500 individual ISs have been described in the literature to date, and many more are being discovered in the ongoing prokaryotic and eukaryotic genome-sequencing projects. The last 10 years have also seen some striking advances in our understanding of the transposition process itself. Not least of these has been the development of various in vitro transposition systems for both prokaryotic and eukaryotic elements and, for several of these, a detailed understanding of the transposition process at the chemical level. This review presents a general overview of the organization and function of insertion sequences of eubacterial, archaebacterial, and eukaryotic origins with particular emphasis on bacterial elements and on different aspects of the transposition mechanism. It also attempts to provide a framework for classification of these elements by assigning them to various families or groups. A total of 443 members of the collection have been grouped in 17 families based on combinations of the following criteria: (i) similarities in genetic organization (arrangement of open reading frames); (ii) marked identities or similarities in the enzymes which mediate the transposition reactions, the recombinases/transposases (Tpases); (iii) similar features of their ends (terminal IRs); and (iv) fate of the nucleotide sequence of their target sites (generation of a direct target duplication of determined length). A brief description of the mechanism(s) involved in the mobility of individual ISs in each family and of the structure-function relationships of the individual Tpases is included where available.


Figures

FIG. 1
FIG. 1
Organization of a typical IS. The IS is represented as an open box in which the terminal IRs are shown as grey boxes labelled IRL (left inverted repeat) and IRR (right inverted repeat). A single open reading frame encoding the transposase is indicated as a hatched box stretching along the entire length of the IS and extending within the IRR sequence. XYZ enclosed in a pointed box flanking the IS represents short DR sequences generated in the target DNA as a consequence of insertion. The Tpase promoter, p, which is partially localized in IRL, is shown by a horizontal arrow. A typical domain structure (grey boxes) of the IRs is indicated beneath. Domain I represents the terminal base pairs at the very tip of the element whose recognition is required for Tpase-mediated cleavage. Domain II represents the base pairs necessary for sequence-specific recognition and binding by the Tpase.
FIG. 2
FIG. 2
Different types of Tpase-mediated cleavage at transposon ends. (A) Transposons are represented by hatched boxes, and flanking donor DNA is represented by black lines. The arrows indicate Tpase-mediated cleavages at the 3′ ends of each element which give rise to active 3′OH groups (open circles) and 5′-phosphate groups (—|). Solid circles indicate 3′OH groups generated in flanking donor DNA. (B) Intramolecular strand transfer events which generate a single circularized transposon strand (top) or terminal hairpins (bottom). (C) Chemistry of the cleavage and strand transfer events. The left panel shows nucleophilic attack by a water molecule on the transposon phosphate backbone. The nucleotide shown as base A represents the terminal 3′ base of the transposon, and that marked B represent the neighboring 5′ nucleotide of the vector backbone DNA. Initial attack generates a 3′OH group on the transposon end. The right panel shows a strand transfer event. The 3′OH group at the transposon end acts as a nucleophile in the attack of the target phosphodiester backbone (bases X and Y), joining the 3′ transposon end to a 5′ target end and creating a 3′OH group on the neighboring target base (X). Also shown in this panel as dashed arrows is the disintegration reaction, in which the 3′OH of the target (X) attacks the newly created phosphodiester bond between the transposon (A) and target (Y) to regenerate the original phosphodiester bond between X and Y.
FIG. 3
FIG. 3
DDE consensus of different families. The alignments are derived from the groups presented in Table 1. Amino acids forming part of the conserved motif are shown as large bold letters. Capital letters indicate conservation within a family, and lowercase letters indicate that the particular amino acid is predominant. The numbers in parentheses show the distance in amino acids between the amino acids of the conserved motif. The retroviral integrase alignment is based on reference . The IS3 family is divided into the subgroups IS407, IS2, IS3, IS51, and IS150, as shown in Fig. 7B. The overall alignment (not shown) is essentially that obtained in reference . For IS21, see also reference ; for mariner, see also references and ; for IS630, see also reference ; for IS4 and IS5, see also reference . The IS5 family is divided into subgroups IS903, IS427, ISL3, IS1031, and IS5, as shown in Fig. 10. For IS256, see references and . N2, N3, and C1 are regions defined in the IS4 transposon family (288).
FIG. 4
FIG. 4
Simple insertions and cointegrate formation. (A) Strand transfer and replication leading to simple insertions and cointegrates. The IS DNA is shown as a shaded cylinder. Liberated transposon 3′OH groups are shown as small shaded circles, and those of the donor backbone (bold lines) are shown as filled circles. The 5′ phosphates are indicated by bars. Strand polarity is indicated. Target DNA is shown as open boxes. The left panel shows an example of an IS which undergoes double-strand cleavage prior to strand transfer. The right panel shows an element which undergoes single-strand cleavage at its ends. After strand transfer, this can evolve into a cointegrate molecule by replication or a simple insertion by second-strand cleavage. (B) Replicative and nonreplicative transposition as mechanisms leading to cointegrates. Three “cointegrate” pathways are illustrated: (I) by replicative transposition, (II) by simple insertion from a dimeric form of the donor molecule, and (III) by simple insertion from a donor carrying tandem copies of the transposable element. Transposon DNA is indicated by a heavy line, and the terminal repeats are indicated by small open circles. The relative orientation is indicated by an open arrowhead. Square and oval symbols represent compatible origins of replication and are included to visually distinguish the different replicons. Arrows show which transposon ends are involved in each reaction.
FIG. 5
FIG. 5
IS distribution among different families. The figure shows the number distribution of the entire IS database into the various IS families. The numbers of isoforms are indicated as the open boxes, and the distinct individual members are shown as shaded boxes. NCY, not classified. ND, nucleotide sequence not determined.
FIG. 6
FIG. 6
Organization of IS1. (A) Structure of IS1. Left (IRL) and right (IRR) terminal IRs are shown as solid boxes. The relative positions of the insA and insB′ reading frames, together with their overlap region, are shown within the open box representing IS1. The IS1 promoter pIRL, partially located in IRL, is indicated by a small arrow. IHF binding sites, located partially within each terminal IR, are shown as small open boxes. The InsA protein is represented as a hatched box beneath. The InsA and InsB′ components of the InsAB′ frameshift product are shown as hatched and stippled boxes, respectively. Arrows indicate the probable region of action of InsA and InsAB′ proteins. The effect of InsA and InsAB′ on transposition is shown above. (B) RNA and protein sequence in the crossover region between the two open reading frames. Codons shown above the RNA sequence show the product of direct translational readout. Those below show the product of a −1 translational frameshift. The heptanucleotide A6C frameshift sequence involved in production of InsAB′ from the wild-type IS1 coding sequence is indicated in boldface type, as is the UAA termination codon for InsA.
FIG. 7
FIG. 7
IS3 family. (A) General organization of IS3 family members. The solid boxes indicate the left (IRL) and right (IRR) terminal IRs. Transcription probably occurs from a weak promoter located partially in IRL. The two consecutive overlapping open reading frames are indicated (orfA and orfB) and are arranged in reading phases 0 and −1 respectively. The products of these frames are shown below. OrfA and OrfB are shown as hatched and open boxes, respectively. The position of a potential helix-turn-helix motif (HTH) is shown as a stippled box in OrfA, and the DDE catalytic domain is shown as a stippled box in OrfB. A potential leucine zipper (LZ) at the C-terminal end of OrfA and extending into OrfAB is also indicated. Each leucine heptad is indicated by an oval. Those present in the OrfA domain are cross-hatched, whereas that deriving from the frameshifted product is open. (B) Dendrogram based on the alignment of the amino acid sequences of predicted OrfA proteins from 40 different elements (left) and 44 predicted OrfB frames (right). The major groups are indicated by brackets. (C) Nucleotide sequences of the terminal IRs of two representative elements of each subgroup, together with some of the elements which do not clearly form part of these groups.
FIG. 7
FIG. 7
IS3 family. (A) General organization of IS3 family members. The solid boxes indicate the left (IRL) and right (IRR) terminal IRs. Transcription probably occurs from a weak promoter located partially in IRL. The two consecutive overlapping open reading frames are indicated (orfA and orfB) and are arranged in reading phases 0 and −1 respectively. The products of these frames are shown below. OrfA and OrfB are shown as hatched and open boxes, respectively. The position of a potential helix-turn-helix motif (HTH) is shown as a stippled box in OrfA, and the DDE catalytic domain is shown as a stippled box in OrfB. A potential leucine zipper (LZ) at the C-terminal end of OrfA and extending into OrfAB is also indicated. Each leucine heptad is indicated by an oval. Those present in the OrfA domain are cross-hatched, whereas that deriving from the frameshifted product is open. (B) Dendrogram based on the alignment of the amino acid sequences of predicted OrfA proteins from 40 different elements (left) and 44 predicted OrfB frames (right). The major groups are indicated by brackets. (C) Nucleotide sequences of the terminal IRs of two representative elements of each subgroup, together with some of the elements which do not clearly form part of these groups.
FIG. 8
FIG. 8
Transposition pathways. Two possible pathways for transposition of IS3 family members are shown. Transposon DNA is represented by heavy double lines, donor backbone DNA is represented by fine double lines, and target DNA is represented by a double dotted line. The ends of the transposon are represented by small open circles. The left-hand pathway represents transposon excision as a linear molecule by double-strand cleavage at each end followed by strand transfer into the target molecule. It does not entail the formation of an active junction. The right-hand pathway shows passage via a single circularized strand (figure-eight) mediated by OrfAB. Formation of a circularized transposon from this intermediate is thought to require a host factor. Insertion requires both OrfAB and OrfA. The 3′OH revealed on the donor backbone is shown as a half arrow. The heavy curved arrow indicates the strong pjunc promoter created by the abutted terminal IRs on circularization.
FIG. 9
FIG. 9
IS4 family. (A) Dendrogram based on alignments of the putative Tpases. (B) Terminal IRs of selected members. (C) Schematic representation of IS10 and IS50. The terminal IRL (OE) and IRR (IE) are shown as solid boxes. Dam methylation sites (∗) are also shown. For IS10, the Tpase promoter, pIN, and the antiRNA promoter, pOUT, are indicated as horizontal arrows. A mechanistically important IHF site is indicated by an open box next to IRL. The Tpase is represented underneath. Stippled boxes indicate the positions of the consensus sequence within members of the IS4 family (from positions 93 to 132, 157 to 187, and 266 to 326). I and II indicate patch I and patch II, respectively, as defined by mutagenesis. The vertical arrow indicates a protease-sensitive site. For IS50, the promoters for Tpase and inhibitor protein, p1 and p2, respectively, are indicated as horizontal arrows. DnaA and Fis binding sites, located close to the left and right ends, respectively, are indicated by open boxes.
FIG. 10
FIG. 10
IS5 family. (A) Dendrogram based on Tpase alignments, showing the division of the family into various subgroups. (B) Terminal IRs of two members of each subgroup, together with those of several elements which fall outside these groups.
FIG. 11
FIG. 11
IS6 family. (A) Dendrogram based on Tpase alignments. (B) Terminal IRs. (C) Transposition mechanism. A target plasmid is distinguished by an open oval representing the origin of replication. The transposon carried by the donor plasmid is composed of two copies of the IS (heavy double lines terminated by small circles) in direct relative orientation (indicated by the open arrowhead) flanking an interstitial DNA segment (shown as a zigzag). The donor plasmid is distinguished by an open rectangle representing its origin of replication. Tpase-mediated replicon fusion of the two molecules generates a third copy of the IS in the same orientation as the original pair (open arrowhead). Homologous recombination, using the recA system, between any two copies can in principle occur. This will either regenerate the donor plasmid, leaving a single IS copy in the target, delete the transposon, or transfer the transposon to the target (as shown), leaving a single copy of the IS in the donor molecule.
FIG. 12
FIG. 12
IS21 family. (A) General organization. The terminal IRL and IRR are shown as solid boxes. The position of the istA and istB reading frames is also shown. The horizontal lines below show the relative positions of the multiply repeated elements whose sequences are presented in panel C. IstA (hatched box) together with the potential DDE motif (stippled box) and IstB (open box) are indicated below. The possibility of translational coupling between the two reading frames is indicated. (B) Dendrogram derived from alignment of the IstA and IstB gene products. (C) Nucleotide sequences of the multiple terminal repeats, together with their coordinates. CS, complementary strand. L1, L2, and L3, and R1 and R2, indicate internal repeated sequences at the left and right ends, respectively.
FIG. 13
FIG. 13
IS30 family. (A) Dendrogram based on Tpase alignments. φSc1 is a homologous reading frame detected in a Spiroplasma citri bacteriophage. (B) Terminal IRs.
FIG. 14
FIG. 14
IS66 family. (A) Organization of IS866. A “best-guess” diagram of the open reading frames is shown. All are transcribed from left to right. The difference in shading is simply to facilitate their distinction. (B) Terminal IRs.
FIG. 15
FIG. 15
IS91 family. (A) Comparison of the primary Tpase sequence with related single-strand replicases. The four conserved regions are boxed and labelled I to IV. They are separated by various numbers of nonconserved amino acids as indicated. In addition to the standard one-letter amino acid code, + and ∗ represent basic and hydrophobic amino acids, respectively. IS91 is compared to bacteriophage φX174 and plasmid pUB110 replication proteins. (B) Transposon ends. Highly conserved sequences within the termini are underlined. The upper sequence in each pair represents the left end, and the lower sequence represents the right end. (C) Proposed rolling-circle mechanism for IS91 transposition. IS91 is shown as a hatched box with left and right termini, vector DNA is shown as a fine line, and target DNA is shown as a heavy line. Initial cleavage (vertical arrowhead) occurs at IRR and is followed by strand transfer to the conserved target sequence. Replication of the displaced strand in the donor DNA then takes place with priming from the liberated 3′ donor end. The left-hand pathway shows the result of correct cleavage and termination at the right extremity of the element. The right-hand pathway shows the result of progression through the termination signal and continuation into neighboring DNA of the donor molecule.
FIG. 16
FIG. 16
IS110 family. Only the dendrogram based on Tpase alignments is shown.
FIG. 17
FIG. 17
IS200 complex. (A) Organization of IS200. Short IRs (open arrows) are shown at the left end, and the relative position of the potential open reading frame (hatched box) is indicated. (B) Dendrogram of IS200 family Tpases, orf1 (left) and the associated orf2 reading frames (right). (C) Relative localization of orf1 and orf2 in selected examples. The convention for the orientation of each reading frame is that frames shown above the line are transcribed to the right while those below the line are transcribed to the left. (D) Relationship between various examples of orf2 and other IS elements. aa, amino acids.
FIG. 18
FIG. 18
IS256 family. (A) Dendrogram based on Tpase alignments. (B) Terminal IRs.
FIG. 19
FIG. 19
IS630 family. (A) Dendrogram based on Tpase alignments. (B) Terminal IRs.
FIG. 20
FIG. 20
IS982 family. (A) Dendrogram based on Tpase alignments. (B) Terminal IRs.
FIG. 21
FIG. 21
IS1380 family. (A) Dendrogram based on Tpase alignments. (B) Terminal IRs.
FIG. 22
FIG. 22
ISAs1 family. (A) Dendrogram based on Tpase alignments. (B) Terminal IRs.
FIG. 23
FIG. 23
ISL3 family. (A) Dendrogram based on Tpase alignments. (B) Terminal IRs.
FIG. 24
FIG. 24
Tc and mariner elements. Tpase-mediated cleavage at the terminal 3′ phosphodiester bond and at 2 nucleotides within the 5′ ends is indicated by curved arrows. Excision of the element (grey box) leaves two 2-nucleotide 3′ extensions in the vector backbone (open flanking box). Insertion is thought to occur by simple nucleophilic attack by the free 3′OH groups of a specific TA target dinucleotide, as shown by the long curved arrows. Repair of the donor backbone will leave a 2-bp insertion (footprint) compared to the original target sequence. This must proceed via the formation of a mismatch joint presumably followed by repair or replication to resolve this mismatch.

References

    1. Reference deleted.
    1. Abremski K E, Hoess R H. Evidence for a second conserved arginine residue in the integrase family of recombination proteins. Protein Eng. 1992;5:87–91. - PubMed
    1. Adzuma K, Mizuuchi K. Target immunity of Mu transposition reflects a differential distribution of Mu B protein. Cell. 1988;53:257–266. - PubMed
    1. Adzuma K, Mizuuchi K. Interaction of proteins located at a distance along DNA: mechanism of target immunity in the Mu DNA strand-transfer reaction. Cell. 1989;57:41–47. - PubMed
    1. Adzuma K, Mizuuchi K. Steady-state kinetic analysis of ATP hydrolysis by the B protein of bacteriophage Mu. Involvement of protein oligomerization in the ATPase cycle. J Biol Chem. 1991;266:6159–6167. - PubMed

Publication types

Substances

LinkOut - more resources