. 1998 Sep 1;12(17):2759-69.
doi: 10.1101/gad.12.17.2759.

Transcriptional termination in the Balbiani ring 1 gene is closely coupled to 3'-end formation and excision of the 3'-terminal intron

Affiliations

Transcriptional termination in the Balbiani ring 1 gene is closely coupled to 3'-end formation and excision of the 3'-terminal intron

G Baurén et al. Genes Dev. .

Abstract

We have analyzed transcription termination, 3'-end formation, and excision of the 3'-terminal intron in vivo in the Balbiani ring 1 (BR1) gene and its pre-mRNA. We show that full-length RNA transcripts are evenly spaced on the gene from a position 300 bp upstream to a region 500-700 bp downstream of the polyadenylation sequence. Very few full-length transcripts and no short, cleaved, nascent transcripts could be observed downstream of this region. Pre-mRNA with 10-20 adenylate residues accumulates at the active gene and then rapidly leaves from the gene locus. Only polyadenylated pre-mRNAs could be detected in the nucleoplasm. Our results are consistent with the hypothesis that transcription termination occurs in a narrow region for the majority of transcripts, simultaneous with 3'-end formation. Excision of the 3'-terminal intron occurs before 3'-end formation in about 5% of the nascent transcripts. When transcription terminates, 3' cleavage takes place and 10-20 adenylate residues are added, the 3'-terminal intron is excised from additionally about 75% of the pre-mRNA at the gene locus. Our data support a close temporal and spatial coupling of transcription termination and the cleavage and initial polyadenylation of 3'-end formation. Excision of the 3'-terminal intron is highly stimulated as the cleavage/polyadenylation complex assembles and 3'-end formation is initiated.


Figures

Figure 1
Figure 1
Distribution of nascent transcripts on the BR1 gene analyzed by RT–PCR. (A) Structure of the 3′ end and the downstream region of the BR1 gene shown together with the position of 5′ PCR primers (A1 and A2) and 9 different cDNA/3′ PCR primers (B–J). (B) Pairwise results of RT–PCR reactions with the cDNA/3′ primers B–H (no signal was detected for H–J for the nascent pre-mRNA, only H is shown). In each pair, the left band (IV) represents a fixed amount of an in vitro transcript covering the 3′ end and downstream region of the BR1 gene. The band to the right (BR) represents the nascent BR1 pre-mRNA. (C) Results quantitated by PhosphorImager analysis. The ratio of the nascent transcript signal to the in vitro transcript signal for each primer pair (A1–B, A1–C, A2–D, A2–E, etc., in B), as a measure of the number of transcripts, is plotted against the distance from the polyadenylation site. The polyadenylation site is at position 0. Upstream positions have negative values and downstream positions positive values.
Figure 1
Figure 1
Distribution of nascent transcripts on the BR1 gene analyzed by RT–PCR. (A) Structure of the 3′ end and the downstream region of the BR1 gene shown together with the position of 5′ PCR primers (A1 and A2) and 9 different cDNA/3′ PCR primers (B–J). (B) Pairwise results of RT–PCR reactions with the cDNA/3′ primers B–H (no signal was detected for H–J for the nascent pre-mRNA, only H is shown). In each pair, the left band (IV) represents a fixed amount of an in vitro transcript covering the 3′ end and downstream region of the BR1 gene. The band to the right (BR) represents the nascent BR1 pre-mRNA. (C) Results quantitated by PhosphorImager analysis. The ratio of the nascent transcript signal to the in vitro transcript signal for each primer pair (A1–B, A1–C, A2–D, A2–E, etc., in B), as a measure of the number of transcripts, is plotted against the distance from the polyadenylation site. The polyadenylation site is at position 0. Upstream positions have negative values and downstream positions positive values.
Figure 2
Figure 2
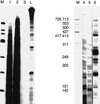
Distribution of nascent transcripts on the BR1 gene analyzed by LM–RT–PCR. Autoradiographs of the final PCR products, separated on 6% sequencing gels. (M) Size markers. The same markers were used in both panels. The gel on the right was run a shorter distance. Sizes of the markers are given in bases (the two lowest bands, 151 and 140 bases respectively, are not seen in the left panel). (L) Second set of size markers, consisting of a ladder with a periodicity of 123 bases. (Lane 1) The 5′ primer position was at position −20; (lane 2) the primer position was at position −700; (lane 3) no PCR product was obtained if reverse transcriptase was left out of the cDNA reaction; (lanes 4–6) the 5′ primers were at positions +276, +496, and +790, respectively.
Figure 3
Figure 3
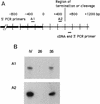
Short nascent transcripts are not found downstream of the +600 region in the BR1 gene. (A) Positions of 5′ PCR primers (A1 and A2) and a common cDNA/ 3′ primer. (B) Result of RT–PCR analysis on one and the same population of nascent BR1 gene pre-mRNA, using the cDNA/3′ primer in combination with either the A1 5′ primer (A1) or the A2 5′ primer (A2). (IV) In vitro transcript. The numbers 26 and 35 indicate the number of PCR cycles.
Figure 4
Figure 4
Uncleaved transcripts cannot be detected in the nucleoplasm. RNA was extracted from microdissected nucleoplasm and BR1 pre-mRNA was analyzed by RT–PCR. In the −20 lane, the cDNA/3′ PCR primer was located at position −20 (i.e. upstream of the polyadenylation site, D in Fig. 1A) and the 5′ PCR primer at position −703, just upstream of intron 4 (A1 in Fig. 1A). The lower, thicker band is spliced transcripts and the upper, weaker band unspliced transcripts. The length of the intron is 55 bases. In the +105 lane, the 5′ PCR primer was the same as for the −20 lane, but the position of the cDNA/3′ PCR primer was at +105 (i.e., downstream of the polyadenylation site, E in Fig. 1A). The number of PCR cycles was 35.
Figure 5
Figure 5
Length distribution of poly(A) tails. The length of the poly(A) tail was analyzed by LM–RT–PCR. The PCR products were sized on a 6% sequencing gel. The 5′ primer was at position −151 and the 3′ PCR primer was 32 bases long. (Lanes 1,3) Result when reverse transcriptase was excluded from the cDNA reaction; (lane 2) cytoplasmic BR1 mRNA; (lane 4) nucleoplasmic BR1 pre-mRNA. Size markers are given in bases (M).
Figure 6
Figure 6
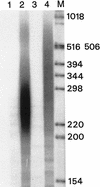
Length distribution of poly(A) tails in BR1 pre-mRNA isolated from the BR1 gene locus. The pre-mRNA was analyzed by LM–RT–PCR, and the PCR products were separated on a 6% sequencing gel. (M) Size markers given in bases. (Lane 1) DraI cleaved; (lane 2) DraI cleaved −RT control; (lane 3) non-DraI-cleaved −RT control; (lane 4) non-DraI cleaved. The positions of the bands at 190 and 200 bases are marked.
Figure 7
Figure 7
Excision of intron 4 in nascent and polyadenylated BR1 pre-mRNA. (A) The structure of the 3′ end and downstream region of the BR1 gene together with the position of the labeled 5′ PCR primer and two unlabeled alternative cDNA/3′ PCR primers (A and B). The position of an EcoRV cleavage site used to cleave the PCR products prior to electrophoretic separation is indicated. (B) RT–PCR analysis of the same population of nascent BR1 gene pre-mRNA with the two alternative primer pairs is shown. (A) The 5′ primer was combined with the A primer; (B) the 5′ primer was combined with the B primer. The top band represents the unspliced pre-mRNA and the lower band represents the spliced pre-mRNA. (C) RT–PCR analysis of polyadenylated pre-mRNA at the BR1 gene locus and in the nucleoplasm. RNA was isolated from the microdissected BR1 gene locus (BR1) and nucleoplasm (NP) and the proportion of pre-mRNA with (unspliced) or without (spliced) intron 4, was determined.
Figure 7
Figure 7
Excision of intron 4 in nascent and polyadenylated BR1 pre-mRNA. (A) The structure of the 3′ end and downstream region of the BR1 gene together with the position of the labeled 5′ PCR primer and two unlabeled alternative cDNA/3′ PCR primers (A and B). The position of an EcoRV cleavage site used to cleave the PCR products prior to electrophoretic separation is indicated. (B) RT–PCR analysis of the same population of nascent BR1 gene pre-mRNA with the two alternative primer pairs is shown. (A) The 5′ primer was combined with the A primer; (B) the 5′ primer was combined with the B primer. The top band represents the unspliced pre-mRNA and the lower band represents the spliced pre-mRNA. (C) RT–PCR analysis of polyadenylated pre-mRNA at the BR1 gene locus and in the nucleoplasm. RNA was isolated from the microdissected BR1 gene locus (BR1) and nucleoplasm (NP) and the proportion of pre-mRNA with (unspliced) or without (spliced) intron 4, was determined.

References

    1. Ashe MP, Pearson LH, Proudfoot NJ. The HIV-1 5′ LTR poly(A) site is inhibited by U1snRNP interaction with the downstream major splice site donor. EMBO J. 1997;16:5752–5763. - PMC - PubMed
    1. Bardwell VJ, Wickens M. Polyadenylation-specific complexes undergo a transition early in the polyadenylation of a poly(A) tail. Mol Cell Biol. 1990;10:295–302. - PMC - PubMed
    1. Baurén G, Wieslander L. Splicing of Balbiani ring 1 gene pre-mRNA occurs simultaneously with transcription. Cell. 1994;76:183–192. - PubMed
    1. Belikov S, Paulsson G, Wieslander L. Promoter regions of four Balbiani ring genes exhibit a common salivary gland specific chromatin organisation which is independent of the rate of transcription. Mol & Gen Genet. 1998;258:420–426. - PubMed
    1. Birse CE, Minvielle-Sebastia L, Lee BA, Keller W, Proudfoot NJ. Coupling termination of transcription to messenger RNA mutation in yeast. Science. 1998;280:298–301. - PubMed

Publication types

Substances

LinkOut - more resources