. 1998 Sep 7;142(5):1347-56.
doi: 10.1083/jcb.142.5.1347.

Mode of action of interleukin-6 on mature osteoclasts. Novel interactions with extracellular Ca2+ sensing in the regulation of osteoclastic bone resorption

Affiliations

Mode of action of interleukin-6 on mature osteoclasts. Novel interactions with extracellular Ca2+ sensing in the regulation of osteoclastic bone resorption

O A Adebanjo et al. J Cell Biol. .

Abstract

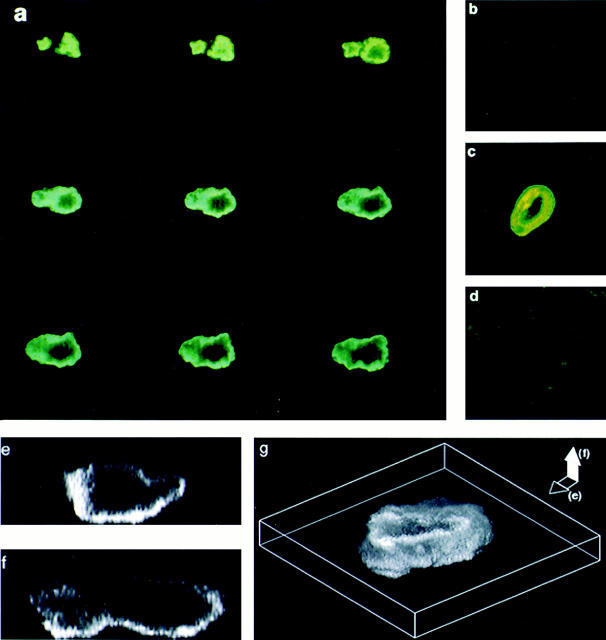
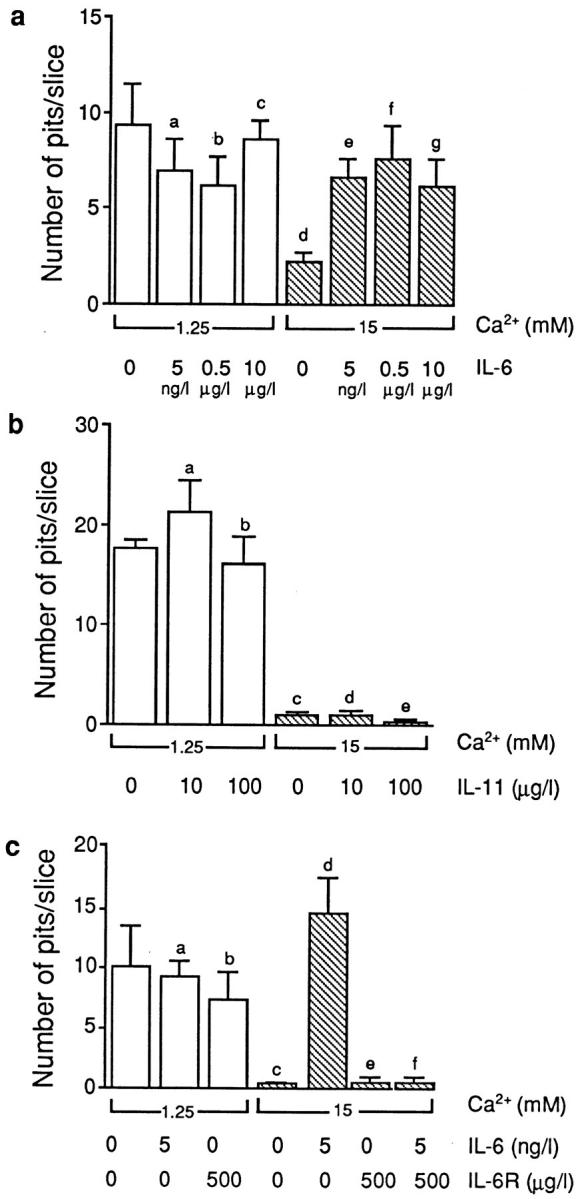
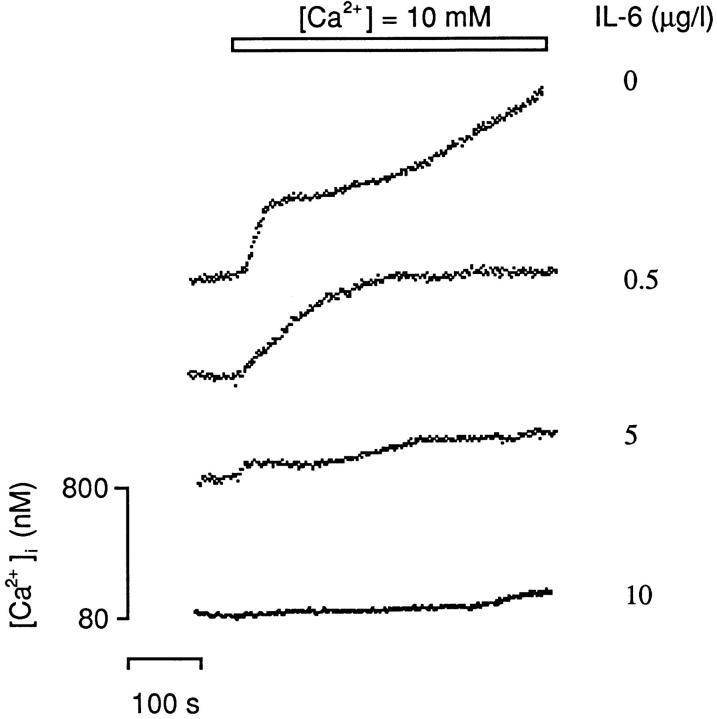
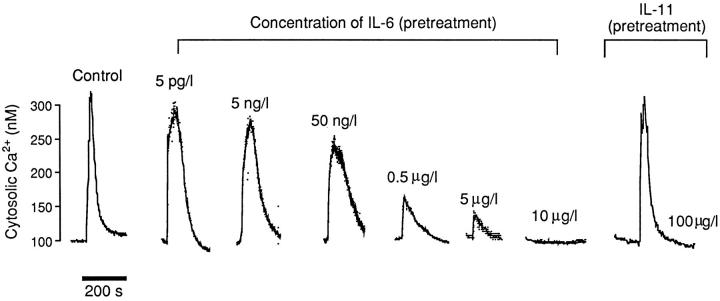
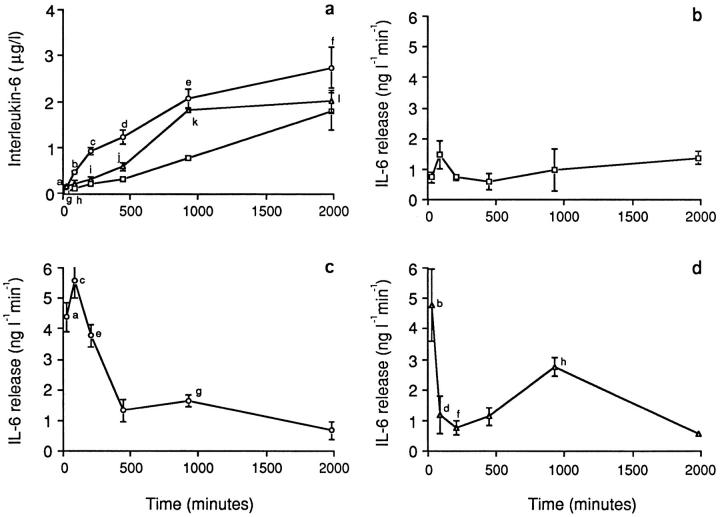
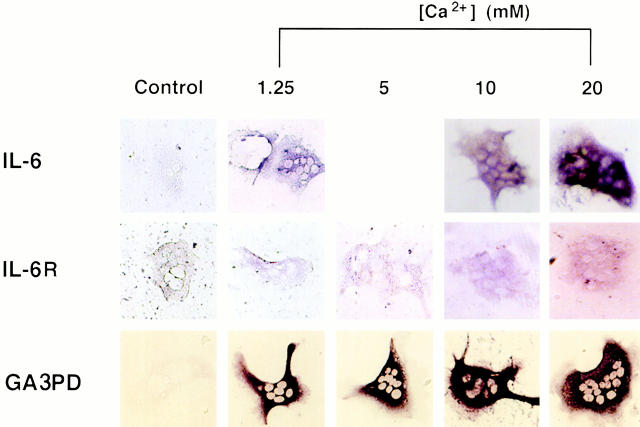
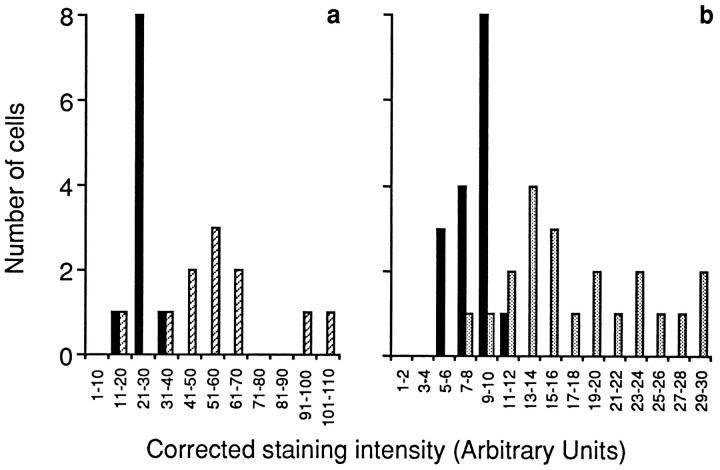
We describe a physiologically significant mechanism through which interleukin-6 (IL-6) and a rising ambient Ca2+ interact to regulate osteoclastic bone resorption. VOXEL-based confocal microscopy of nonpermeabilized osteoclasts incubated with anti- IL-6 receptor antibodies revealed intense, strictly peripheral plasma membrane fluorescence. IL-6 receptor expression in single osteoclasts was confirmed by in situ reverse transcriptase PCR histochemistry. IL-6 (5 ng/l to 10 microg/l), but not IL-11 (10 and 100 microg/l), reversed the inhibition of osteoclastic bone resorption induced by high extracellular Ca2+ (15 mM). The IL-6 effect was abrogated by excess soluble IL-6 receptor (500 microg/l). Additionally, IL-6 (5 pg/l to 10 microg/l) inhibited cytosolic Ca2+ signals triggered by high Ca2+ or Ni2+. In separate experiments, osteoclasts incubated in 10 mM Ca2+ or on bone released more IL-6 than those in 1.25 mM Ca2+. Furthermore, IL-6 mRNA histostaining was more intense in osteoclasts in 10 or 20 mM Ca2+ than cells in 1.25 mM Ca2+. Similarly, IL-6 receptor mRNA histostaining was increased in osteoclasts incubated in 5 or 10 mM Ca2+. Thus, while high Ca2+ enhances IL-6 secretion, the released IL-6 attenuates Ca2+ sensing and reverses inhibition of resorption by Ca2+. Such an autocrine-paracrine loop may sustain osteoclastic activity in the face of an inhibitory Ca2+ level generated locally during resorption.


Figures

Figure 1
Figure 1
Confocal microscopic localization of the IL-6R on rat osteoclast plasma membrane. (a and c) Intense peripheral immunofluorescent staining of osteoclasts with two highly specific anti– IL-6R monoclonal antibodies, MT-18 (a; serial sections in coronal plane, 1 μm thick) and 15A7 (c; single coronal section). Note that osteoclasts incubated with no antiserum, nonimmune mouse serum, or an irrelevant antibody (Ab34) did not stain (not shown). (b) Very faint staining of an osteoclast with MT-18 coincubated with soluble rhIL-6R (500 μg/l); this confirms IL-6R specificity of the antibody. (d) Lack of appreciable staining of IL-6R– negative MBA13.2 cells incubated with antibody, MT-18. For details on confocal microscopy, see Materials and Methods. (e and f) VOXEL (volume element) imaging of osteoclasts stained with the anti–IL-6R antibody, MT-18. This method allows three-dimensional optical sectioning in both the coronal (e) and sagittal (f) planes of the cell. Staining is typically localized to the cell's periphery with a sparing of the central cytoplasmic and nuclear areas. (g) A three-dimensional reconstruction of membrane staining from the coronal and sagittal sections.
Figure 2
Figure 2
(a) Bone resorption by isolated rat osteoclasts, expressed as the mean pit number per bone slice (±SEM), in the presence of different concentrations of IL-6 and CaCl2 (Ca2 +), as shown. Statistics by ANOVA with Bonferroni's correction for inequality. Compared with control: a P = 0.205, b P = 0.126, c P = 0.418, and d P = 0.007; compared with 15 mM Ca2+: e P = 0.002, f P = 0.026, and g P = 0.05. (b) Bone resorption by isolated rat osteoclasts, expressed as the mean pit number per bone slice (±SEM), in the presence of different concentrations of IL-11 and CaCl2 (Ca2 +), as shown. Statistics by ANOVA with Bonferroni's correction for inequality. Compared with control: a P = 0.621, b P = 0.317, and c–e P < 0.001. (c) Bone resorption by isolated rat osteoclasts, expressed as the mean pit number per bone slice (±SEM) in the presence of different concentrations of CaCl2 (Ca2 +), IL-6, and/or the soluble rhIL-6R, as shown. Statistics by ANOVA with Bonferroni's correction for inequality. Compared with control: a P = 0.847, b P = 0.536, c,e,f P < 0.001, and d P = 0.675.
Figure 3
Figure 3
Representative traces showing the effect of IL-6 on cytosolic Ca2+ levels elicited in fura-2–loaded rat osteoclasts in response to 10 mM Ca2+ applied extracellularly with either vehicle or 0.5, 5, or 10 μg/l IL-6 (n = 4–6 cells for each variable). For statistical analysis, see Table I.
Figure 4
Figure 4
Representative traces showing the effect of preincubation with either IL-6 (5 pg/l to 10 μg/l) or IL-11 (100 μg/l) on cytosolic Ca2+ levels in fura-2–loaded rat osteoclasts elicited in response to the application of 5 mM Ni2+ extracellularly (n = 4–6 cells for each variable). For statistical analysis, see Table II.
Figure 5
Figure 5
(a) Cumulative supernatant levels of IL-6 (μg/l) after incubation of disaggregated osteoclast cultures with either 1.25 mM Ca2+ (squares) or 10 mM Ca2+ (circles) (on glass coverslips) or on bone slices (Ca2+ = 1.25 mM) (triangles). Statistics by ANOVA and Bonferroni's correction for inequality: a,b,c P = 0.001, d P = 0.05, e P = 0.0021, f P = 0.47, g P = 0.05, h P = 0.217, i P = 0.13, j P = 0.064, k P = 0.005, and l P = 0.683, all compared with the corresponding time points for the 1.25 mM Ca2+ (on glass) variable. (b–d) IL-6 release rates (ng l−1 min−1) after incubation of disaggregated osteoclast cultures with either 1.25 mM Ca2+ (b, squares) or 10 mM Ca2+ (c, circles) (on glass coverslips) or on bone slices (Ca2+ = 1.25 mM) (d, triangles). Statistics by ANOVA and Bonferroni's correction for inequality: a P = 0.05, b P = 0.028, c P = 0.006, d P = 0.740, e P = 0.001, f P = 0.849, g P = 0.087, and h P = 0.092. Note that other contaminating cells in our cultures may contribute to the measured IL-6.
Figure 6
Figure 6
Histostained osteoclasts after in situ RT-PCR for detection of either IL-6 mRNA, IL-6R receptor mRNA, or GA3PD mRNA. The left panels represent controls, i.e., without added primer. For details and primer sequences, refer to Materials and Methods.
Figure 7
Figure 7
Semiquantitative representation in frequency histograms of corrected staining intensity after in situ RT-PCR for IL-6 mRNA (a) or IL-6R mRNA (b) for osteoclasts incubated with 1.25 mM Ca2+ (solid black bars), 5 mM Ca2+ (dotted bars), or 10 mM Ca2+ (diagonal bars).

References

    1. Adebanjo OA, Pazianas M, Zaidi A, Shankar VS, Bascal ZA, Dacke CG, Huang CL-H, Zaidi M. Quantitative studies on the effect of prostacyclin on freshly isolated rat osteoclasts in culture. J Endocrinol. 1994;143:375–381. - PubMed
    1. Bellido T, Stahl N, Farruggella TJ, Borba V, Yancopoulos GD, Manolagas SC. Detection of receptors for interleukin-6, interleukin-11, leukemia inhibitory factor, oncostatin M, and ciliary neurotropic factor in bone marrow stroma/osteoblastic cells. J Clin Invest. 1996;97:431–437. - PMC - PubMed
    1. Bellido T, Borba VZ, Robertson P, Manolagas SC. Activation of the Janus/STAT (signal transducer and activator of transcription) signal transduction pathway by interleukin-6-type cytokines promotes osteoblast differentiation. Endocrinology. 1997;138:3666–3676. - PubMed
    1. Boyde A, Ali NN, Jones SJ. Resorption of dentine by isolated osteoclasts in vitro. . Br Dental J. 1984;156:216–220. - PubMed
    1. Caputo C. Nickel substitution for calcium and the timecourse of potassium conductances of single muscle fibres. J Muscle Res Cell Motil. 1981;2:167–182. - PubMed

Publication types