. 1998 Sep;118(1):159-72.
doi: 10.1104/pp.118.1.159.

Alterations in the cytoskeleton accompany aluminum-induced growth inhibition and morphological changes in primary roots of maize

Affiliations

Alterations in the cytoskeleton accompany aluminum-induced growth inhibition and morphological changes in primary roots of maize

EB Blancaflor et al. Plant Physiol. 1998 Sep.

Abstract

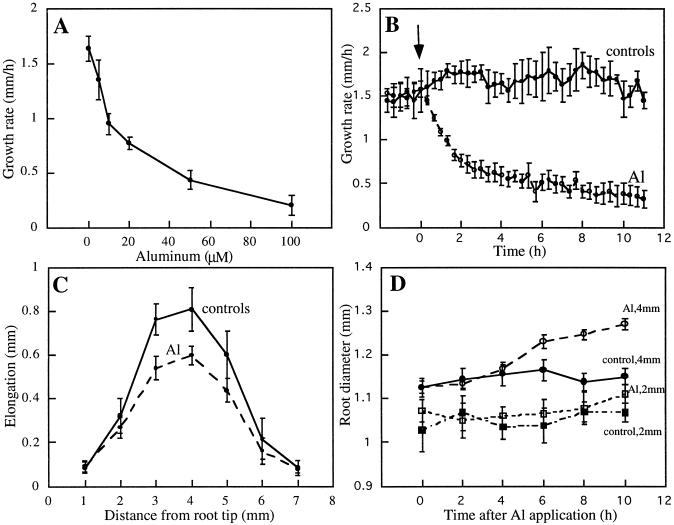
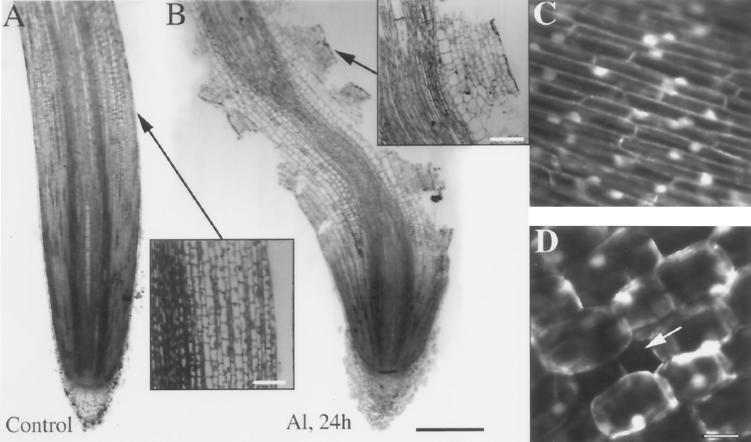
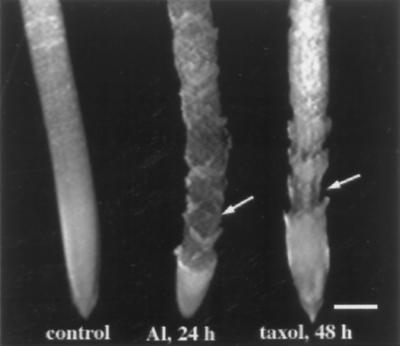
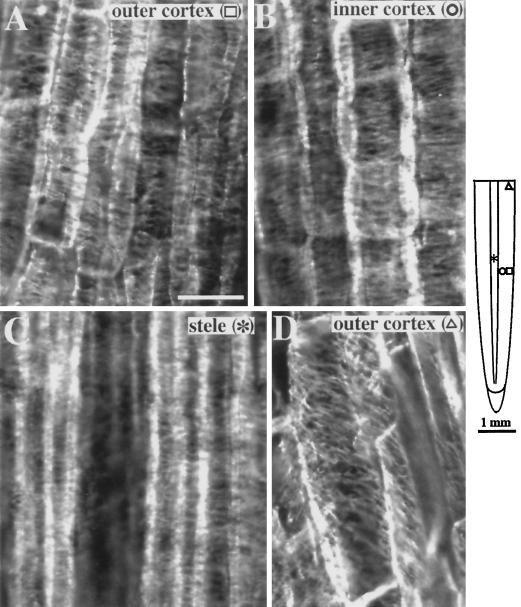
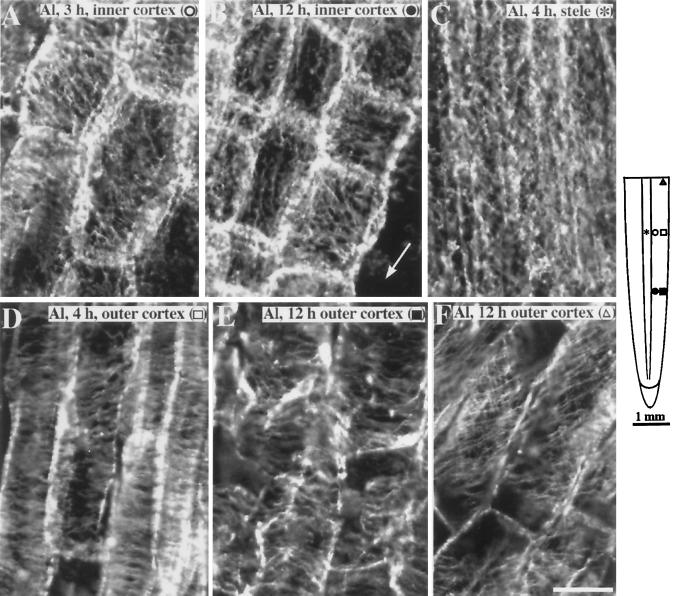
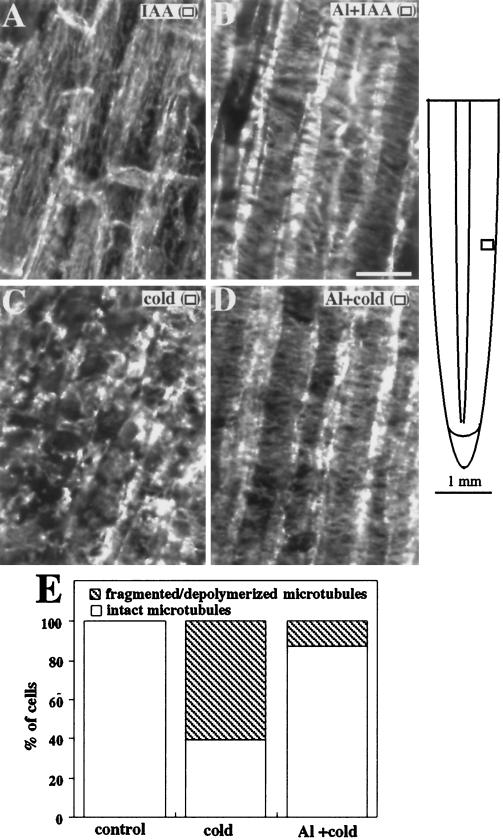
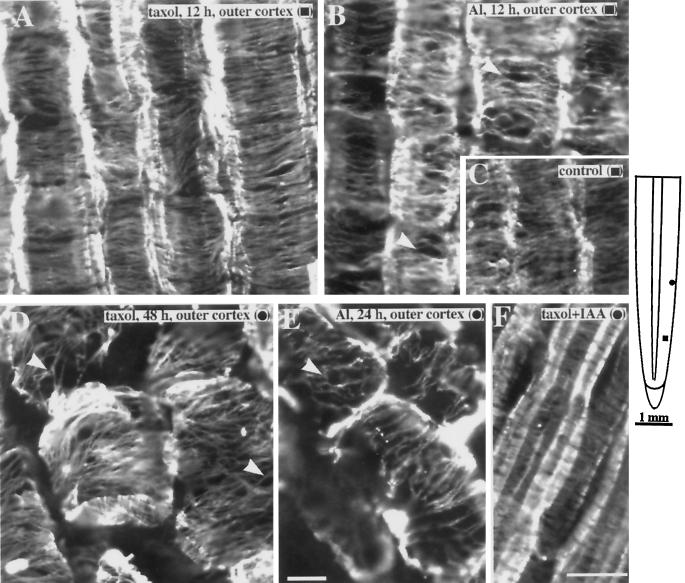
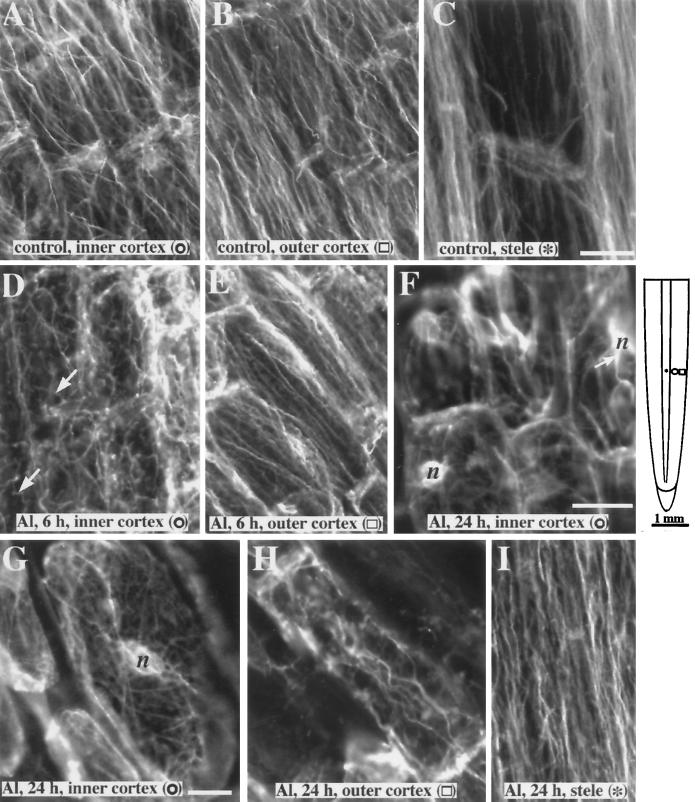
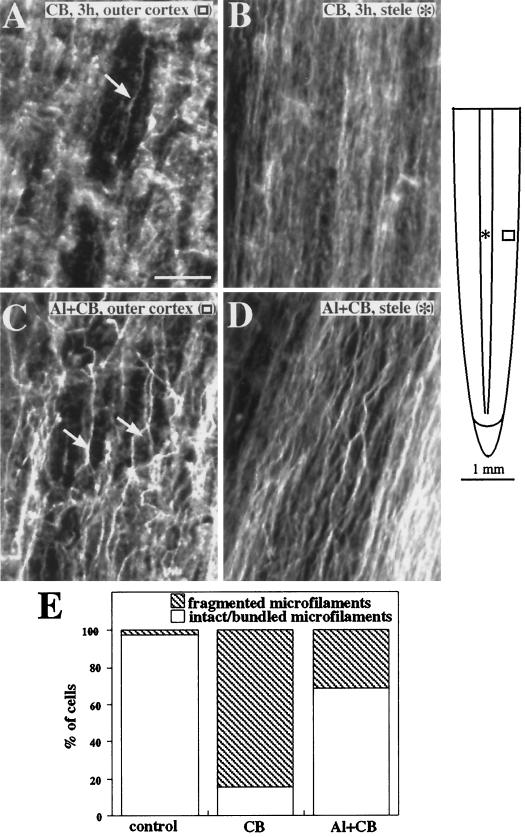
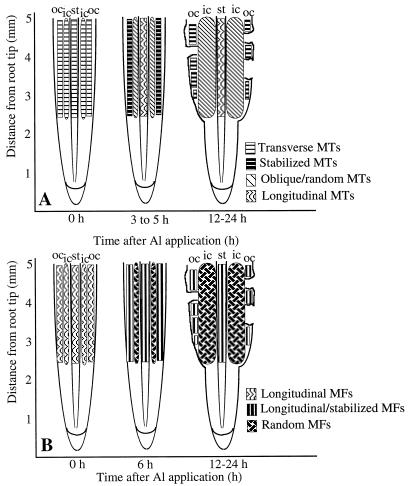
Although Al is one of the major factors limiting crop production, the mechanisms of toxicity remain unknown. The growth inhibition and swelling of roots associated with Al exposure suggest that the cytoskeleton may be a target of Al toxicity. Using indirect immunofluorescence microscopy, microtubules and microfilaments in maize (Zea mays L.) roots were visualized and changes in their organization and stability correlated with the symptoms of Al toxicity. Growth studies showed that the site of Al toxicity was associated with the elongation zone. Within this region, Al resulted in a reorganization of microtubules in the inner cortex. However, the orientation of microtubules in the outer cortex and epidermis remained unchanged even after chronic symptoms of toxicity were manifest. Auxin-induced reorientation and cold-induced depolymerization of microtubules in the outer cortex were blocked by Al pretreatment. These results suggest that Al increased the stability of microtubules in these cells. The stabilizing effect of Al in the outer cortex coincided with growth inhibition. Reoriented microfilaments were also observed in Al-treated roots, and Al pretreatment minimized cytochalasin B-induced microfilament fragmentation. These data show that reorganization and stabilization of the cytoskeleton are closely associated with Al toxicity in maize roots.


Figures

Figure 1
Figure 1
Effects of Al on elongation and radial expansion of maize roots. A, Dose-response curve of root-growth inhibition by Al. Seedlings were transferred to aerated solutions containing the indicated concentrations of Al and the root growth was measured after 6 h. Concentrations at or above 50 μm Al resulted in maximum growth inhibition. B, Kinetics of axial root-growth rate of untreated roots (control) and roots in response to 50 μm Al. The growth rate of roots declined within 1 h of Al application (arrow). C, Effect of 50 μm Al on elongation growth within different regions of the root. Roots were marked at 1-mm intervals from the tip, and extension of the marked segments was measured 2 h after exposure to Al. Growth of the region 2 to 5 mm from the root tip was the most effectively inhibited by Al. D, Kinetics of radial expansion at 2 and 4 mm from the tip of maize primary roots treated with 50 μm Al. Swelling was perceptible more than 3 mm from the tip 6 h after Al exposure. No swelling was observed less than 2 mm from the tip during the initial 10 h of Al treatment. Data points are means from six or more roots ± se.
Figure 2
Figure 2
Light micrographs and viability staining of maize primary roots after exposure to 50 μm Al. Roots were fixed and embedded in historesin, and a median longitudinal section was taken from control roots (A) and roots 24 h after Al treatment (B). Inset in A shows a magnified view of the surface of an untreated root. Inset in B shows a magnified view of the surface lesions of an Al-treated root. These lesions were not generated by a sectioning artifact, as shown in Figure 6. Confocal sections of the fluorescence from cells at the surface of control (C) and Al-treated (D) roots stained with the viability stain FDA show that despite the degeneration of the root cortex and holes (arrow) in the surface layer of cells, the cells at the surface of the Al-treated root are viable. Images are representative of at least 50 independent root samples. Bar in B = 1 mm; bars in insets = 100 μm; and bar in D = 25 μm and applies to C and D.
Figure 6
Figure 6
Morphology of maize primary roots after exposure to 50 μm Al or 20 μm taxol. Like Al-treated roots, taxol-treated roots showed disintegration of outer cell layers (arrows) compared with untreated roots (control). By 24 h swelling was no longer apparent because portions of the epidermis and outer cortex had sloughed off. Bar = 1 mm.
Figure 3
Figure 3
Organization of cortical microtubules in maize primary roots grown in 200 μm CaCl2, pH 4.5 (controls). Along the elongation zone (approximately 2–5 mm from the root tip), the outer (A) and inner (B) cortex of control roots show microtubules aligned perpendicular to the long axis of the root. C, Stelar cells in the same region also show transverse microtubules. D, Microtubules shift to an oblique orientation 6 to 7 mm from the root tip. The schematic diagram of the root indicates the regions where immunofluorescence images were obtained. Symbols in parentheses in A to D correspond to the symbols in the root diagram. Images are representative of at least five independently processed root samples. Bar in A = 25 μm.
Figure 4
Figure 4
Organization of cortical microtubules in maize primary roots after exposure to 50 μm Al. A, After 3 h of continuous exposure to Al, cells in the inner cortex 4 to 4.5 mm from the root tip showed random and obliquely oriented microtubules. B, After 12 h of continuous exposure to Al, reoriented microtubules occurred closer to the root tip. Cells in the inner cortex 2 mm from the tip showed random to longitudinally oriented microtubules. Arrow shows region where outer cortex has sloughed off. C, The stelar cells also exhibited random to longitudinal microtubules but occurred after 4 h of Al exposure. D, Four hours after Al exposure, outer cortical cells 4 mm from the root tip retained their net transverse microtubule orientation. E, Outer cortical cells 12 h after Al exposure also retained an overall transverse alignment of microtubules despite the distorted appearance of the cells. F, Cells in the maturation zone (about 6 mm from the tip) showed oblique microtubules that were similar to controls. The schematic diagram of the root indicates the regions where immunofluorescence images were obtained. Symbols in parentheses in A to F correspond to the symbols in the root diagram. Images are representative of at least five roots per time point. Bar in F = 25 μm.
Figure 5
Figure 5
Organization of cortical microtubules in maize primary roots treated with IAA, Al, or cold. A, Microtubules in cells of the outer cortex shifted to longitudinal orientations after 1 h of exposure to 1 μm IAA. B, Microtubules in cells of the outer cortex exposed for 1 h to 50 μm Al followed by 1 h in 1 μm IAA remained transversely oriented. C, Roots incubated in 2°C solution for 2 h showed fragmented microtubules. D, Roots pretreated with Al for 12 h before cold exposure still had cells with intact microtubules. E, The fraction of cells in the outer cortex of cold-treated and Al-plus-cold-treated roots were classified by whether they had intact or fragmented/depolymerized microtubules. At least 50 cells were observed for each treatment. Images are representative of at least three roots from three independent experiments. The schematic diagram of the root indicates the regions where immunofluorescence images were obtained. Symbols in parentheses in A to D correspond to the symbols in the root diagram. Bar in B = 25 μm.
Figure 7
Figure 7
Comparison of cortical microtubule organization in maize primary roots treated with taxol or Al. A, Microtubules in taxol (20 μm)-treated roots were higher in density and displayed extensive bundling compared with controls. Bundling was characterized by an increased lateral association of microtubules. B, Although not as dense as microtubules in taxol-treated roots, 50 μm Al caused the formation of bundled microtubules (arrowheads). For comparison, the low degree of bundling in untreated controls is shown in C. D, Outer cortical cells after 48 to 60 h of exposure to 20 μm taxol showed an overall transverse alignment of microtubules despite distorted cell shapes. E, Region where the outer cortical cells in the elongation zone remained intact even after 24 h of exposure to 50 μm Al. Like taxol-treated roots, microtubules retained an overall transverse alignment and displayed extensive bundling (arrowhead). F, Cortical microtubules of roots incubated in taxol for 3 h followed by 1 h of incubation in 1 μm IAA remained dense and transversely oriented. Images are representative of at least five roots per treatment. The schematic diagram of the root indicates the regions where immunofluorescence images were obtained. Symbols in parentheses in A to F correspond to the symbols in the root diagram. Bar in E = 10 μm and applies to A to E; bar in F = 25 μm.
Figure 8
Figure 8
Organization of actin microfilaments in maize roots exposed to 50 μm Al. Microfilaments in the inner cortex (A), outer cortex (B) and stele (C) of control roots are parallel to the long axis of the cell. D, By 6 h of Al exposure, the inner cortical cells show a more random organization of microfilament bundles. Compared with the controls, microfilament bundles are not as straight (arrows). E, After 6 h the outer cortical cells still show a preferential longitudinal alignment of microfilaments. F, Microfilaments in the inner cortex after 12 to 24 h of Al exposure are randomly oriented. Thick microfilament bundles (arrow) appear to radiate from the nucleus (n). G, Higher-magnification image of an inner cortical cell after 24 h of Al exposure showing randomly oriented microfilaments. H, Outer cortical cells 24 h after Al treatment still show an overall longitudinal orientation of microfilaments, but microfilament bundles were generally thicker. I, Despite the disruption of microfilament organization in the other tissues, microfilaments in the stele were still longitudinal in orientation after a 24-h exposure to Al. The schematic diagram of the root indicates the regions where immunofluorescence images were obtained. Symbols in parentheses in A to I correspond to the symbols in the root diagram. Bar in C = 25 μm and applies to A to E and I; bar in F = 25 μm and applies to F and H; and bar in G = 10 μm.
Figure 9
Figure 9
Organization of actin microfilaments in maize roots treated with the actin-depolymerizing agent CB (A and B) or Al plus CB (C and D). A, Microfilaments in the outer cortical cells of maize roots exposed to 50 μm CB for 3 h were completely disrupted. Only a few thick microfilament bundles remained (arrow). B, Microfilaments in the stele were also disrupted after CB treatment and characterized by thinner bundles. C, Cells in the outer cortex of roots pretreated with Al for 3 h still retained numerous thick microfilament bundles (arrows) even after exposure to CB. D, Microfilament bundles in the stele of Al-pretreated roots were thick and dense despite 3 h of exposure to CB. E, The fraction of cells in the outer cortex of CB-treated and Al-plus-CB-treated roots were classified by whether they had intact microfilaments or fragmented/no microfilaments. At least 50 cells were observed for each treatment. Images are representative of at least three roots from three independent experiments. The schematic diagram of the root indicates the regions where immunofluorescence images were obtained. Symbols in parentheses in A to D correspond to the symbols in the root diagram. Bar in A = 25 μm.
Figure 10
Figure 10
Schematic diagram of a longitudinal section of a maize root summarizing the changes in microtubules (MTs) (A) and microfilaments (MFs) (B) in the elongation zone after exposure to Al. A, Within 1 h of Al exposure, microtubules in the outer cortex (oc) were stabilized in the transverse orientation. Oblique to random microtubules were first detected in the inner cortex (ic) 3 h after Al exposure and after 4 h in the stele (st). This shift in microtubule orientation may lead to expansion of the inner cortical cells, resulting in root swelling. By 12 h, outer cortical cells with stabilized microtubules showed distorted shapes and were sloughed off from the root, leading to lesions along the root surface. B, Microfilaments were stabilized within 3 h after Al exposure. Randomly oriented and highly bundled microfilaments in the inner cortex and stele were detected 6 h after Al application. The stabilization and reorganization of microfilaments occurred later than that of microtubules.

References

    1. Alfano F, Russel A, Gambardella R, Duckett JG. The actin cytoskeleton of the liverwort Riccia fluitans: effects of cytochalasin B and aluminum on rhizoid tip growth. J Plant Physiol. 1993;142:569–574.
    1. Andersland J, Fisher D, Wymer C, Cyr R, Parthasarathy M. Characterization of a monoclonal antibody prepared against plant actin. Cell Motil Cytoskel. 1994;29:339–344. - PubMed
    1. Baluska F, Barlow PW, Volkmann D. Complete disintegration of the microtubular cytoskeleton precedes its auxin-mediated reconstruction in postmitotic maize root cells. Plant Cell Physiol. 1996;37:1013–1021. - PubMed
    1. Baluska F, Brailsford RW, Hauskrecht M, Jackson MB, Barlow PW. Cellular dimorphism in the maize root cortex: involvement of microtubules, ethylene and gibberellin in the differentiation of cellular behavior in postmitotic growth zones. Bot Acta. 1993a;106:394–403.
    1. Baluska F, Parker JS, Barlow PW. The microtubular cytoskeleton in cells of cold-treated roots of maize (Zea mays L.) shows tissue-specific responses. Protoplasma. 1993b;172:84–96.

LinkOut - more resources