

Membrane fusion promoted by increasing surface densities of the paramyxovirus F and HN proteins: comparison of fusion reactions mediated by simian virus 5 F, human parainfluenza virus type 3 F, and influenza virus HA
- PMID: 9733810
- PMCID: PMC110082
- DOI: 10.1128/JVI.72.10.7745-7753.1998
Membrane fusion promoted by increasing surface densities of the paramyxovirus F and HN proteins: comparison of fusion reactions mediated by simian virus 5 F, human parainfluenza virus type 3 F, and influenza virus HA
Abstract
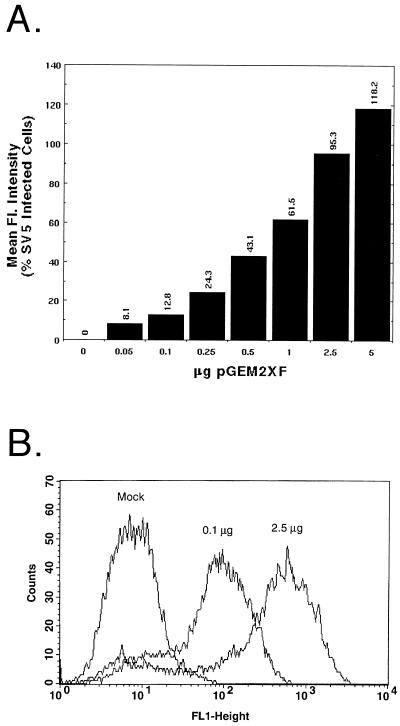
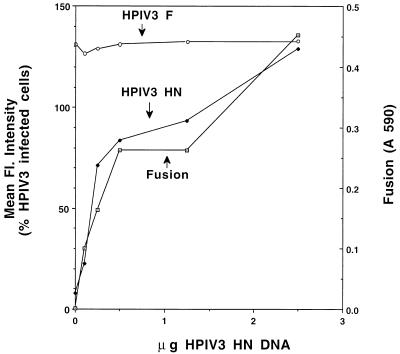
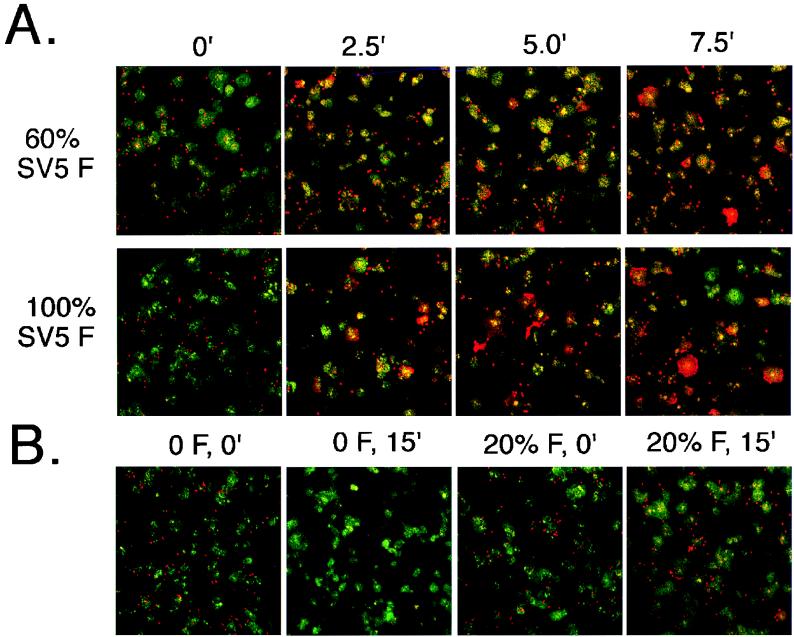
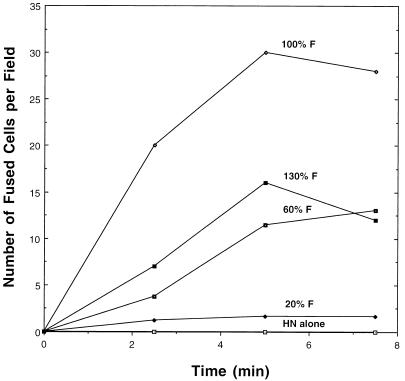
The membrane fusion reaction promoted by the paramyxovirus simian virus 5 (SV5) and human parainfluenza virus type 3 (HPIV-3) fusion (F) proteins and hemagglutinin-neuraminidase (HN) proteins was characterized when the surface densities of F and HN were varied. Using a quantitative content mixing assay, it was found that the extent of SV5 F-mediated fusion was dependent on the surface density of the SV5 F protein but independent of the density of SV5 HN protein, indicating that HN serves only a binding function in the reaction. However, the extent of HPIV-3 F protein promoted fusion reaction was found to be dependent on surface density of HPIV-3 HN protein, suggesting that the HPIV-3 HN protein is a direct participant in the fusion reaction. Analysis of the kinetics of lipid mixing demonstrated that both initial rates and final extents of fusion increased with rising SV5 F protein surface densities, suggesting that multiple fusion pores can be active during SV5 F protein-promoted membrane fusion. Initial rates and extent of lipid mixing were also found to increase with increasing influenza virus hemagglutinin protein surface density, suggesting parallels between the mechanism of fusion promoted by these two viral fusion proteins.
Figures


Similar articles
-
Quantitative measurement of paramyxovirus fusion: differences in requirements of glycoproteins between simian virus 5 and human parainfluenza virus 3 or Newcastle disease virus.J Virol. 1995 Nov;69(11):6712-9. doi: 10.1128/JVI.69.11.6712-6719.1995. J Virol. 1995. PMID: 7474081 Free PMC article.
-
Fusion protein of the paramyxovirus SV5: destabilizing and stabilizing mutants of fusion activation.Virology. 2000 Apr 25;270(1):17-30. doi: 10.1006/viro.2000.0267. Virology. 2000. PMID: 10772976
-
Paramyxovirus fusion (F) protein and hemagglutinin-neuraminidase (HN) protein interactions: intracellular retention of F and HN does not affect transport of the homotypic HN or F protein.Virology. 1997 Oct 13;237(1):1-9. doi: 10.1006/viro.1997.8759. Virology. 1997. PMID: 9344902
-
Paramyxovirus membrane fusion: lessons from the F and HN atomic structures.Virology. 2006 Jan 5;344(1):30-7. doi: 10.1016/j.virol.2005.09.007. Virology. 2006. PMID: 16364733 Free PMC article. Review.
-
Structure and function of a paramyxovirus fusion protein.Biochim Biophys Acta. 2003 Jul 11;1614(1):73-84. doi: 10.1016/s0005-2736(03)00164-0. Biochim Biophys Acta. 2003. PMID: 12873767 Review.
Cited by
-
Role of N-linked glycosylation of the Hendra virus fusion protein.J Virol. 2005 Jun;79(12):7922-5. doi: 10.1128/JVI.79.12.7922-7925.2005. J Virol. 2005. PMID: 15919949 Free PMC article.
-
EphrinB2 clustering by Nipah virus G is required to activate and trap F intermediates at supported lipid bilayer-cell interfaces.Sci Adv. 2021 Jan 27;7(5):eabe1235. doi: 10.1126/sciadv.abe1235. Print 2021 Jan. Sci Adv. 2021. PMID: 33571127 Free PMC article.
-
Development and application of reverse genetic technology for the influenza virus.Virus Genes. 2021 Apr;57(2):151-163. doi: 10.1007/s11262-020-01822-9. Epub 2021 Feb 2. Virus Genes. 2021. PMID: 33528730 Free PMC article. Review.
-
Surface density of the Hendra G protein modulates Hendra F protein-promoted membrane fusion: role for Hendra G protein trafficking and degradation.Virology. 2007 Jul 5;363(2):419-29. doi: 10.1016/j.virol.2007.01.029. Epub 2007 Feb 27. Virology. 2007. PMID: 17328935 Free PMC article.
-
Integrin αvβ1 Modulation Affects Subtype B Avian Metapneumovirus Fusion Protein-mediated Cell-Cell Fusion and Virus Infection.J Biol Chem. 2016 Jul 8;291(28):14815-25. doi: 10.1074/jbc.M115.711382. Epub 2016 May 16. J Biol Chem. 2016. PMID: 27226547 Free PMC article.
References
-
- Aroeti B, Henis Y I. Accumulation of Sendai virus glycoproteins in cell-cell contact regions and its role in cell fusion. J Biol Chem. 1991;266:15845–15849. - PubMed
-
- Asano K, Asano A. Why is a specific amino acid sequence of F glycoprotein required for the membrane fusion reaction between envelope of HVJ (Sendai virus) and target cell membranes? Biochem Int. 1985;10:115–122. - PubMed
-
- Bagai S, Lamb R A. A glycine to alanine substitution in the paramyxovirus SV5 fusion peptide increases the initial rate of fusion. Virology. 1997;238:283–290. - PubMed
-
- Bagai S, Lamb R A. Individual roles of N-linked oligosaccharide chains in intracellular transport of the paramyxovirus SV5 fusion protein. Virology. 1995;209:250–256. - PubMed
Publication types
MeSH terms
Substances
Grants and funding
LinkOut - more resources
Full Text Sources
Other Literature Sources
