

Late-onset chronic inflammatory encephalopathy in immune-competent and severe combined immune-deficient (SCID) mice with astrocyte-targeted expression of tumor necrosis factor
- PMID: 9736027
- PMCID: PMC1852999
- DOI: 10.1016/S0002-9440(10)65620-9
Late-onset chronic inflammatory encephalopathy in immune-competent and severe combined immune-deficient (SCID) mice with astrocyte-targeted expression of tumor necrosis factor
Abstract
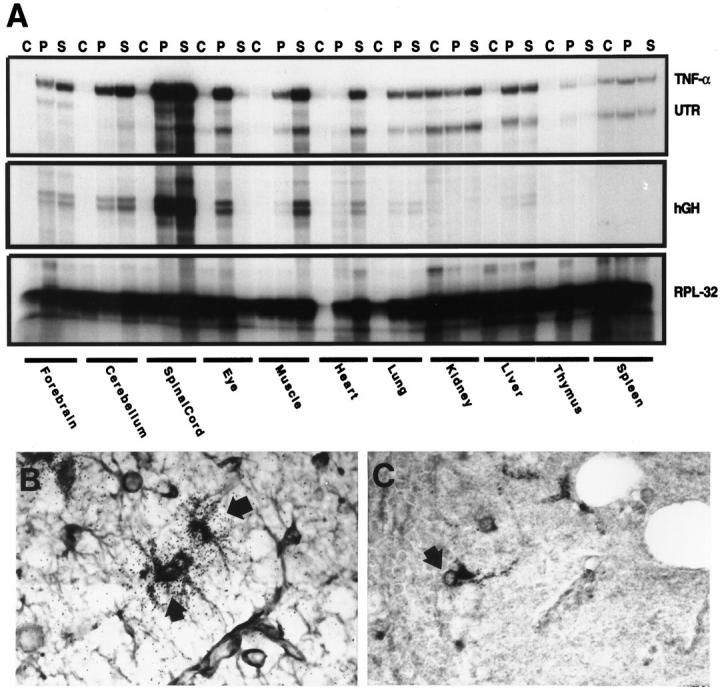
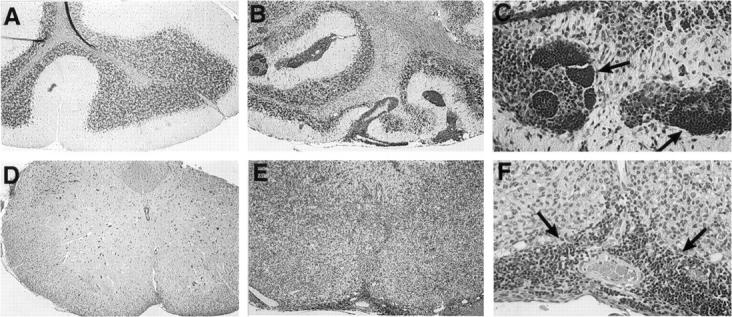
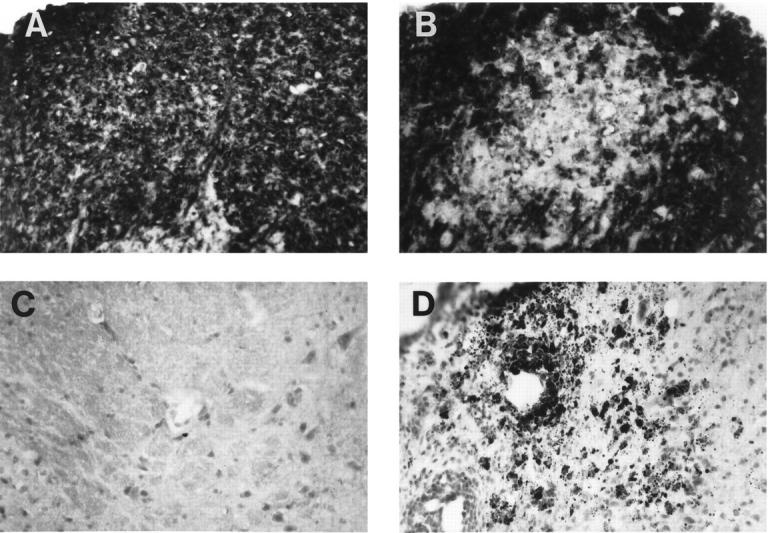
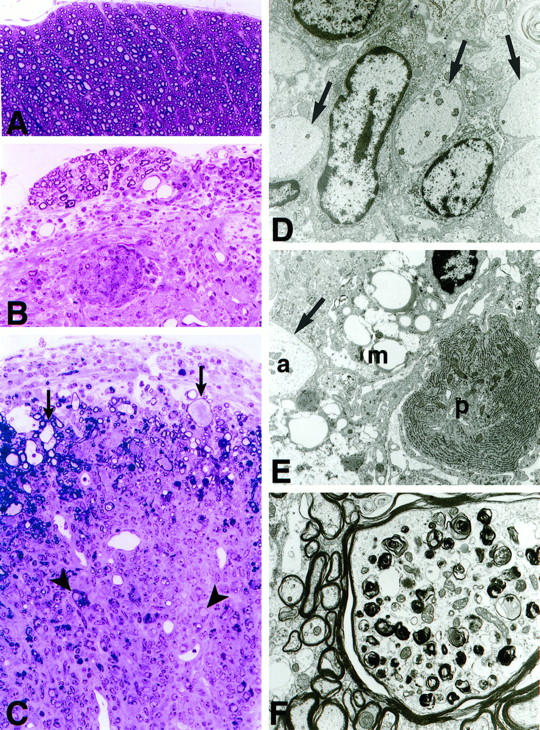
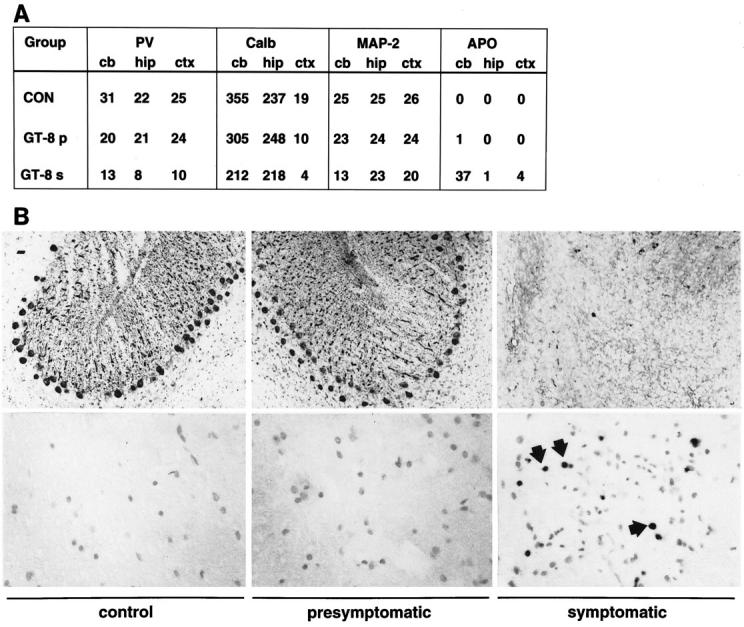
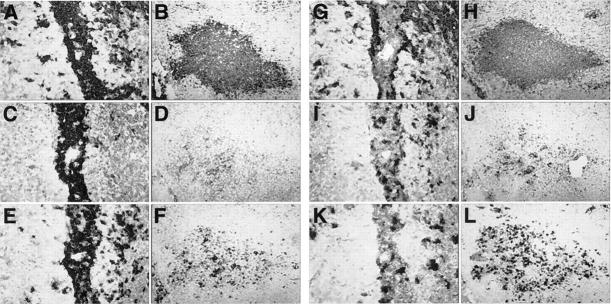
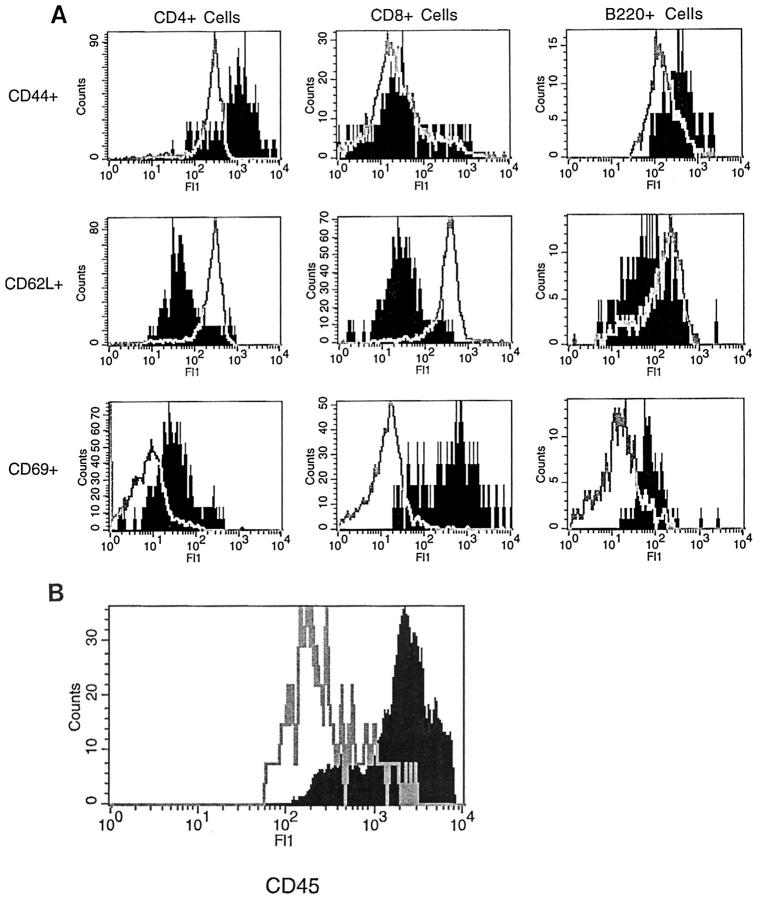
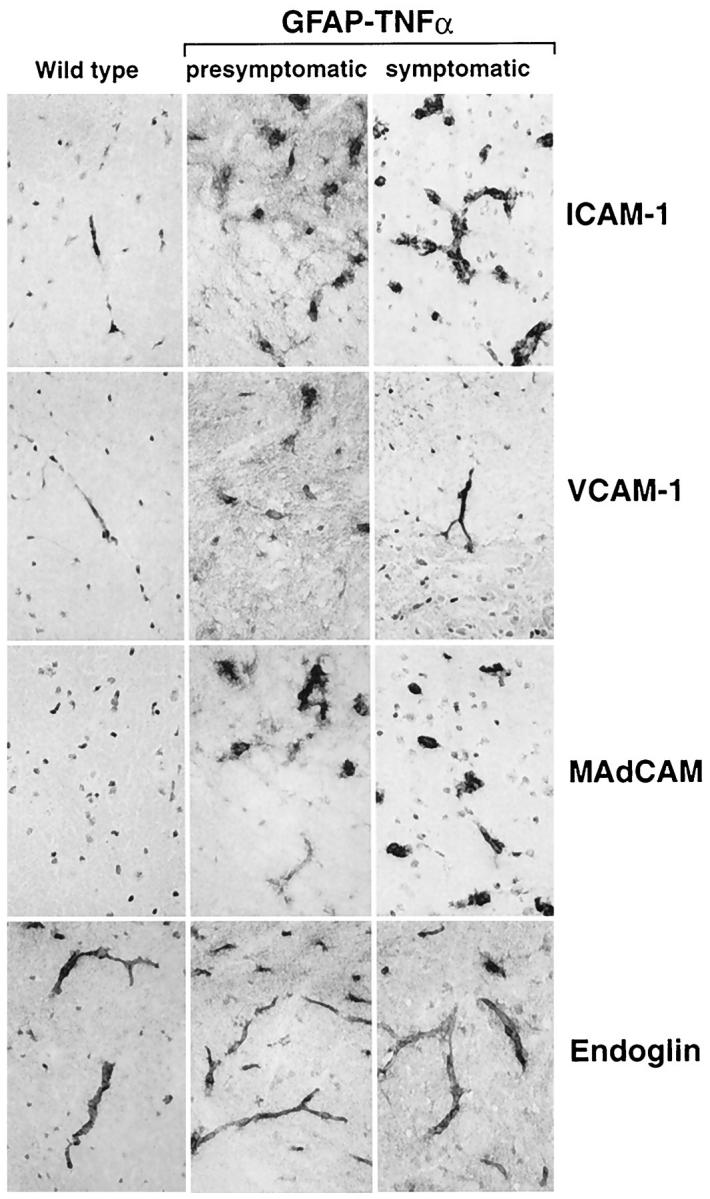
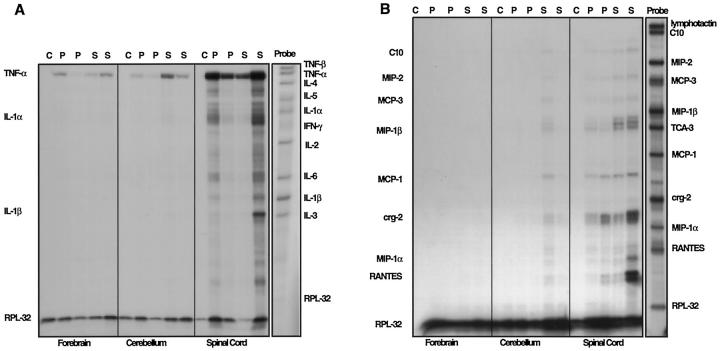
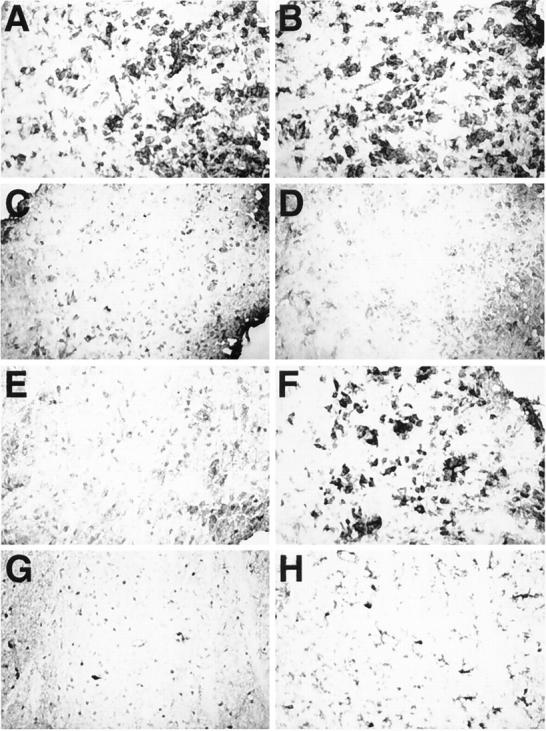
To examine the role of tumor necrosis factor (TNF)-alpha in the pathogenesis of degenerative disorders of the central nervous system (CNS), transgenic mice were developed in which expression of murine TNF-alpha was targeted to astrocytes using a glial fibrillary acidic protein (GFAP)-TNF-alpha fusion gene. In two independent GFAP-TNFalpha transgenic lines (termed GT-8 or GT-2) adult (>4 months of age) animals developed a progressive ataxia (GT-8) or total paralysis affecting the lower body (GT-2). Symptomatic mice had prominent meningoencephalitis (GT-8) or encephalomyelitis (GT-2) in which large numbers of B cells and CD4+ and CD8+ T cells accumulated at predominantly perivascular sites. The majority of these lymphocytes displayed a memory cell phenotype (CD44high, CD62Llow, CD25-) and expressed an early activation marker (CD69). Parenchymal lesions contained mostly CD45+ high, MHC class II+, and Mac-1+ cells of the macrophage microglial lineage with lower numbers of neutrophils and few CD4+ and CD8+ T cells. Cerebral expression of the cellular adhesion molecules ICAM-1, VCAM-1, and MAdCAM as well as a number of alpha- and beta-chemokines was induced or upregulated and preceded the development of inflammation, suggesting an important signaling role for these molecules in the CNS leukocyte migration. Degenerative changes in the CNS of the GFAP-TNFalpha mice paralleled the development of the inflammatory lesions and included primary and secondary demyelination and neurodegeneration. Disease exacerbation with more extensive inflammatory lesions that contained activated cells of the macrophage/microglial lineage occurred in GFAP-TNFalpha mice with severe combined immune deficiency. Thus, persistent astrocyte expression of murine TNF-alpha in the CNS induces a late-onset chronic inflammatory encephalopathy in which macrophage/microglial cells but not lymphocytes play a central role in mediating injury.
Figures
Similar articles
-
Astrocyte-targeted expression of IL-12 induces active cellular immune responses in the central nervous system and modulates experimental allergic encephalomyelitis.J Immunol. 2000 May 1;164(9):4481-92. doi: 10.4049/jimmunol.164.9.4481. J Immunol. 2000. PMID: 10779748
-
Gp130-dependent astrocytic survival is critical for the control of autoimmune central nervous system inflammation.J Immunol. 2011 Jun 1;186(11):6521-31. doi: 10.4049/jimmunol.1001135. Epub 2011 Apr 22. J Immunol. 2011. PMID: 21515788
-
Metallothioneins are upregulated in symptomatic mice with astrocyte-targeted expression of tumor necrosis factor-alpha.Exp Neurol. 2000 May;163(1):46-54. doi: 10.1006/exnr.1999.7335. Exp Neurol. 2000. PMID: 10785443
-
Transgenic models to assess the pathogenic actions of cytokines in the central nervous system.Mol Psychiatry. 1997 Mar;2(2):125-9. doi: 10.1038/sj.mp.4000225. Mol Psychiatry. 1997. PMID: 9106234 Review.
-
Evidence that Fas and FasL contribute to the pathogenesis of experimental autoimmune encephalomyelitis.Arch Immunol Ther Exp (Warsz). 2000;48(5):381-8. Arch Immunol Ther Exp (Warsz). 2000. PMID: 11140465 Review.
Cited by
-
Regulation of glucagon secretion by glucose transporter type 2 (glut2) and astrocyte-dependent glucose sensors.J Clin Invest. 2005 Dec;115(12):3545-53. doi: 10.1172/JCI26309. J Clin Invest. 2005. PMID: 16322792 Free PMC article.
-
Neuroinflammation, Oxidative Stress and the Pathogenesis of Parkinson's Disease.Clin Neurosci Res. 2006 Dec 6;6(5):261-281. doi: 10.1016/j.cnr.2006.09.006. Clin Neurosci Res. 2006. PMID: 18060039 Free PMC article.
-
Overexpression of zinc-α2-glycoprotein suppressed seizures and seizure-related neuroflammation in pentylenetetrazol-kindled rats.J Neuroinflammation. 2018 Mar 22;15(1):92. doi: 10.1186/s12974-018-1132-6. J Neuroinflammation. 2018. PMID: 29566716 Free PMC article.
-
Adenovirus-mediated expression of CXCL10 in the central nervous system results in T-cell recruitment and limited neuropathology.J Neurovirol. 2003 Jun;9(3):315-24. doi: 10.1080/13550280390201029. J Neurovirol. 2003. PMID: 12775415 Free PMC article.
-
Separate sequences in a murine retroviral envelope protein mediate neuropathogenesis by complementary mechanisms with differing requirements for tumor necrosis factor alpha.J Virol. 2004 Dec;78(23):13104-12. doi: 10.1128/JVI.78.23.13104-13112.2004. J Virol. 2004. PMID: 15542662 Free PMC article.
References
-
- Fiers W: Tumor necrosis factor: characterization at the molecular, cellular and in vivo level. FEBS Lett 1991, 285:199-212 - PubMed
-
- Grunfeld C, Palladino MA, Jr: Tumor necrosis factor: immunologic, antitumor, metabolic and cardiovascular activities. Adv Intern Med 1990, 35:45-72 - PubMed
-
- Beutler B, Grau GE: Tumor necrosis factor in the pathogenesis of infectious diseases. Crit Care Med 1993, 21:S423-S435 - PubMed
-
- Raine CS: Multiple sclerosis: TNF revisited with promise. Nature Med 1995, 1:211-214 - PubMed
-
- Merrill JE: Proinflammatory and antiinflammatory cytokines in multiple sclerosis and central nervous system acquired immunodeficiency syndrome. J Immunol 1992, 12:167-170 - PubMed
Publication types
MeSH terms
Substances
Grants and funding
LinkOut - more resources
Full Text Sources
Other Literature Sources
Molecular Biology Databases
Research Materials
Miscellaneous
