. 1998 Sep 15;18(18):7047-60.
doi: 10.1523/JNEUROSCI.18-18-07047.1998.

Identification of a survival-promoting peptide in medium conditioned by oxidatively stressed cell lines of nervous system origin

Affiliations

Identification of a survival-promoting peptide in medium conditioned by oxidatively stressed cell lines of nervous system origin

T J Cunningham et al. J Neurosci. .

Abstract

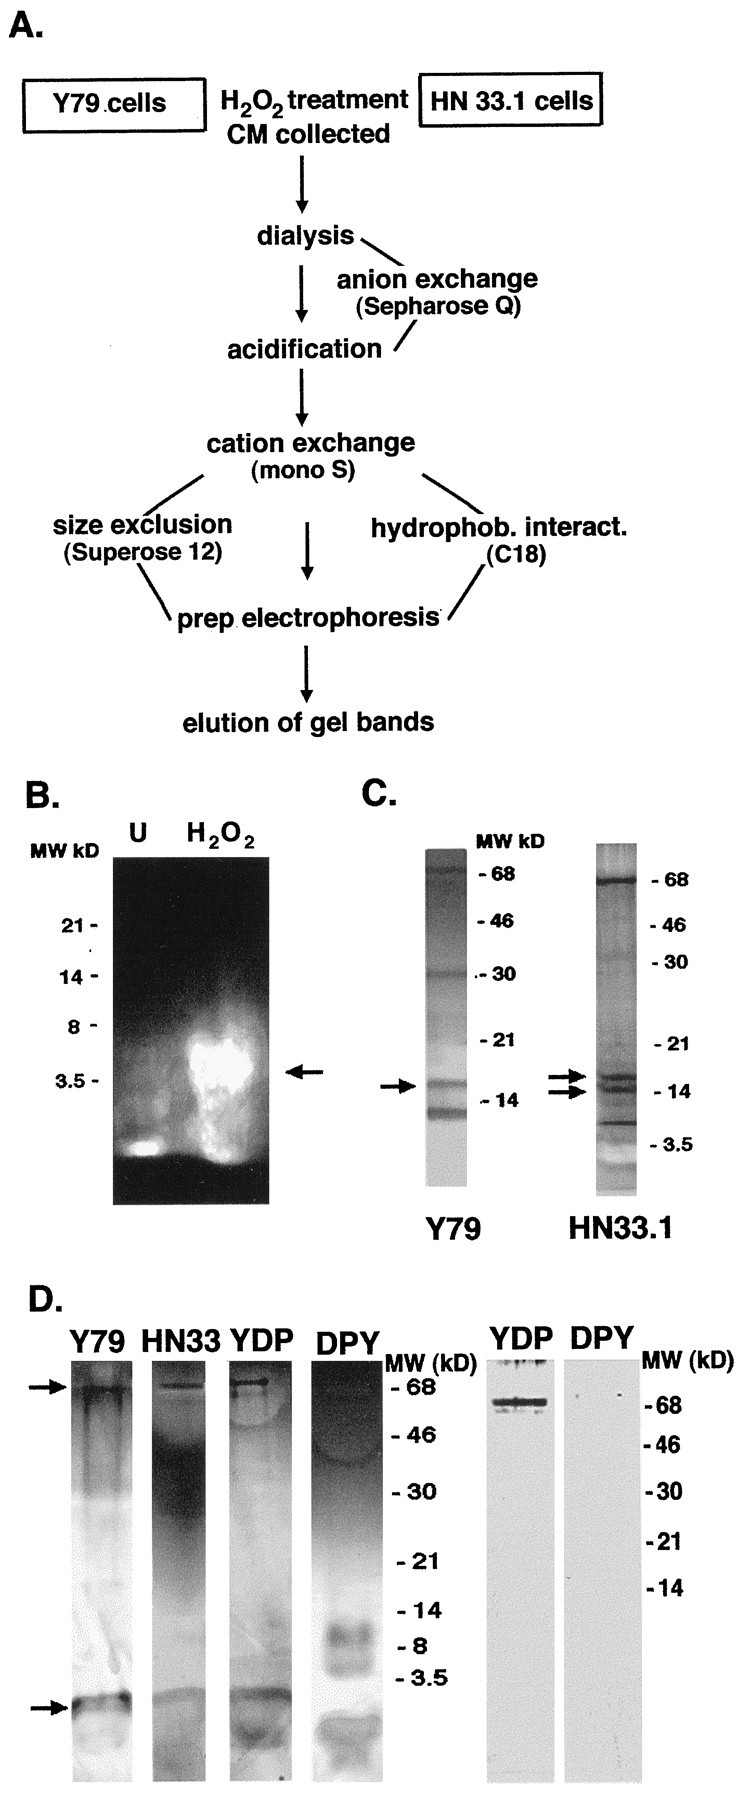
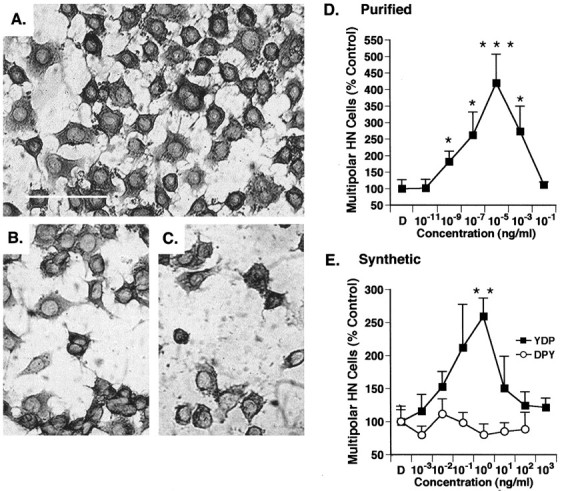
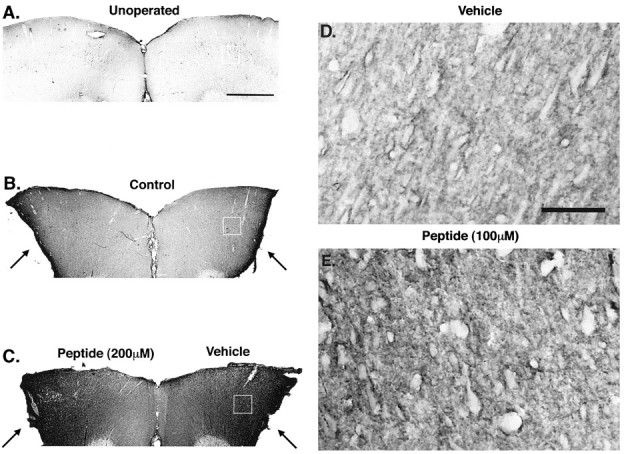
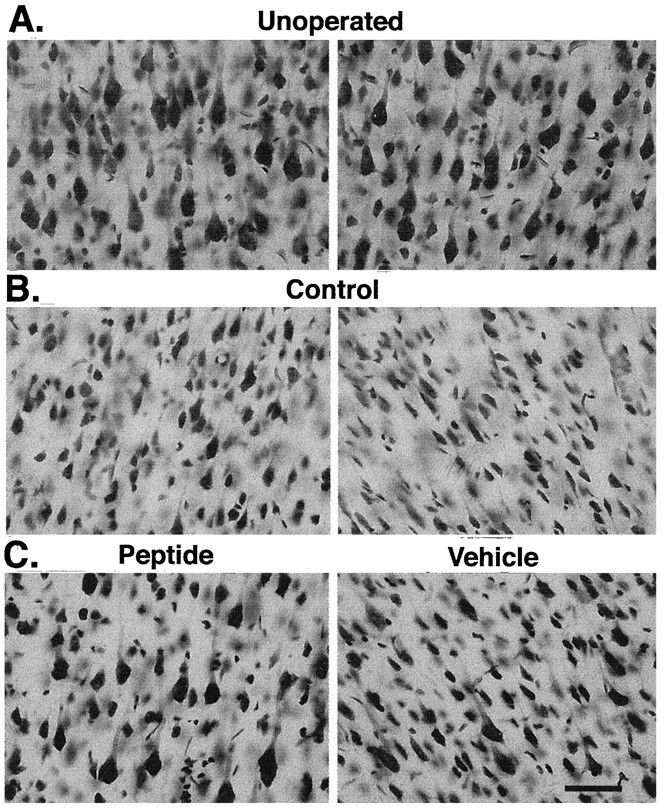
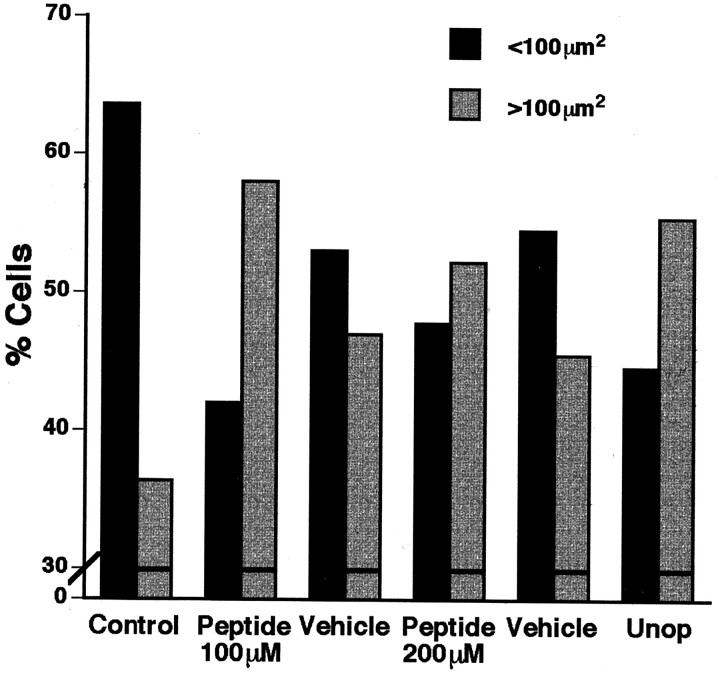
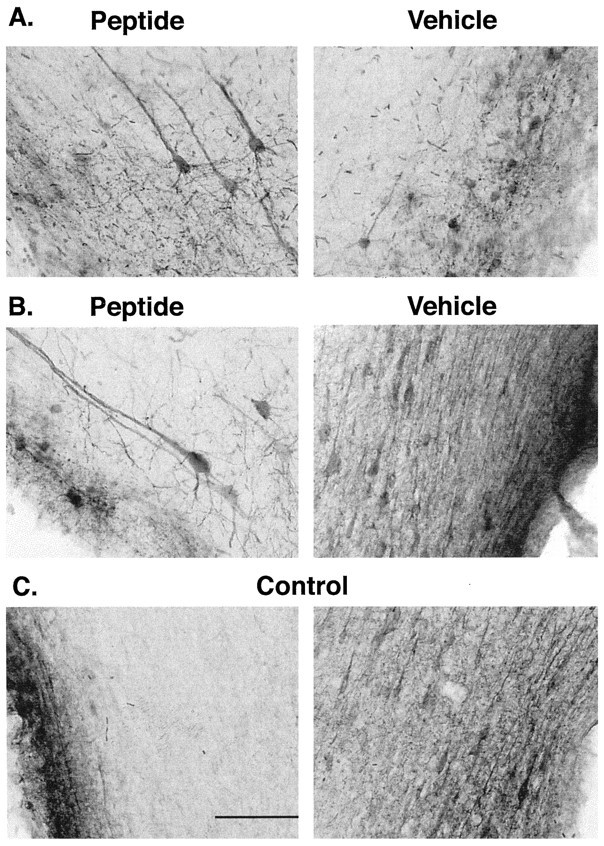
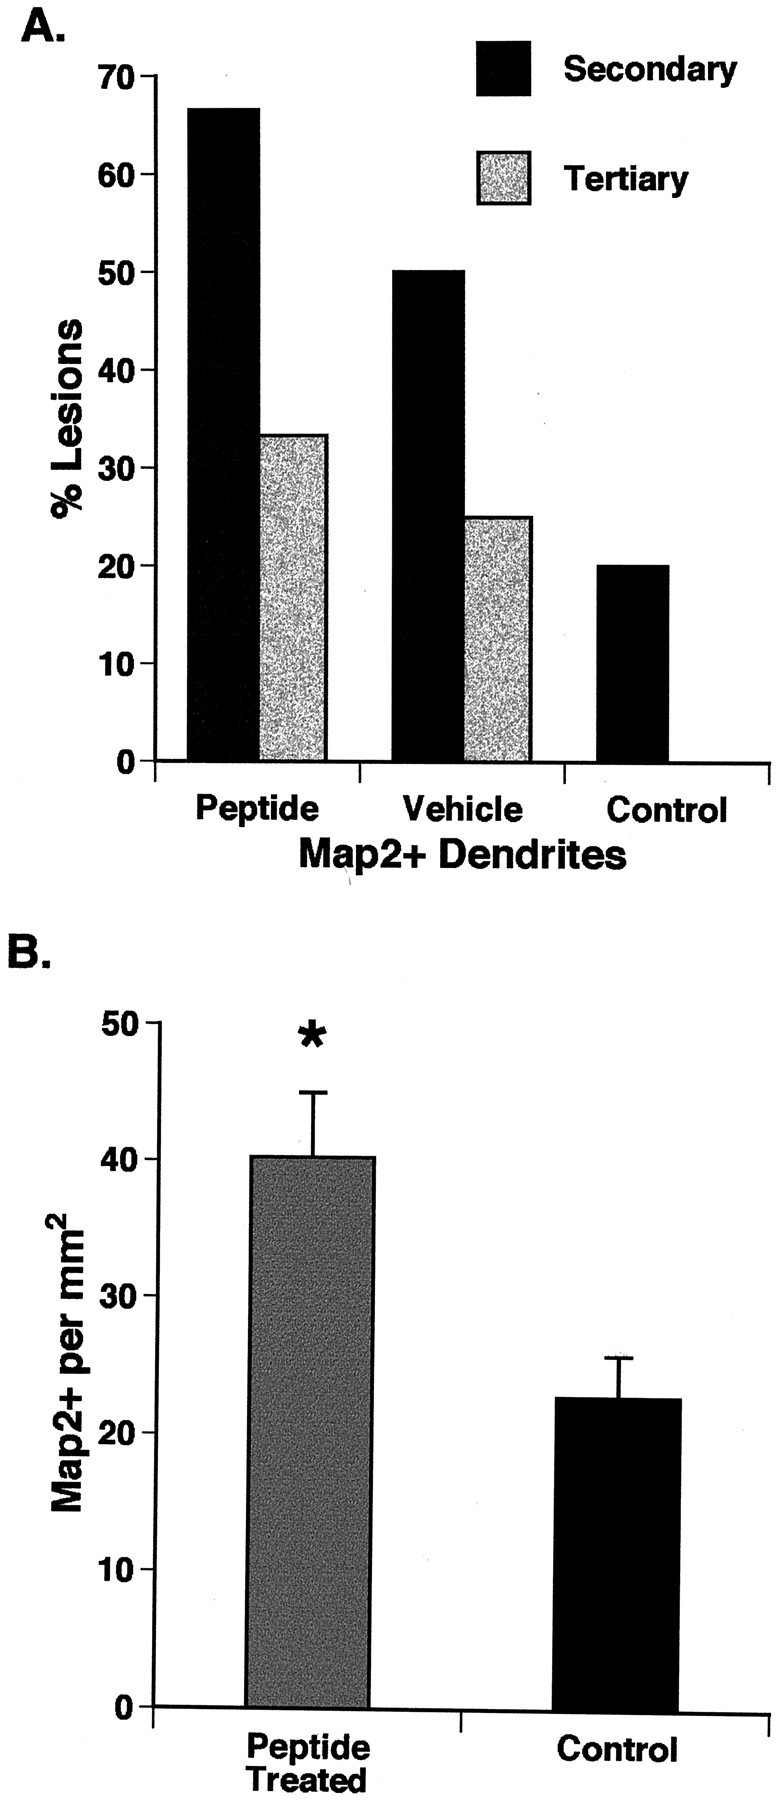
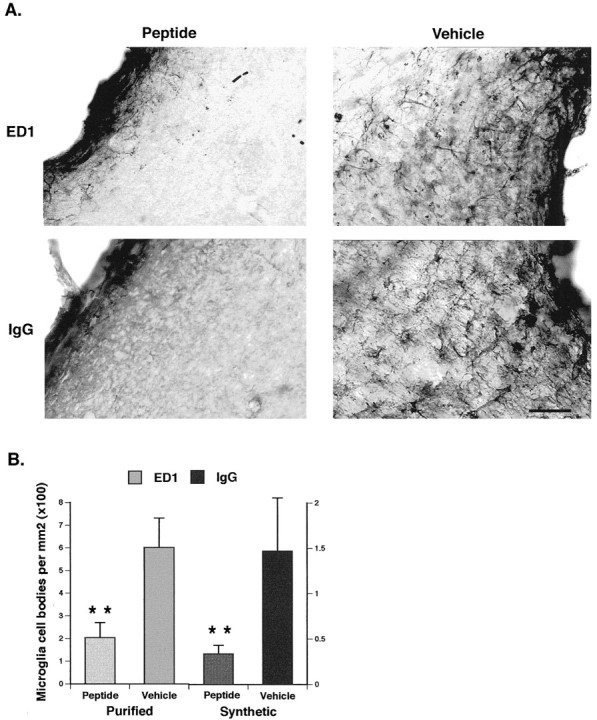
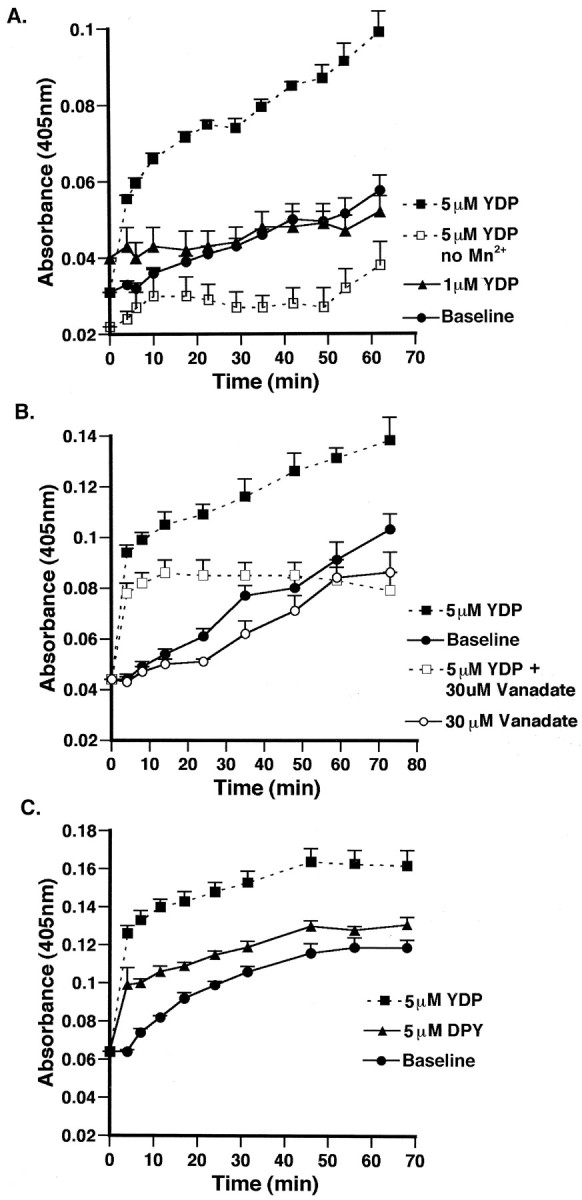
A survival-promoting peptide has been purified from medium conditioned by Y79 human retinoblastoma cells and a mouse hippocampal cell line (HN 33.1) exposed to H2O2. A 30 residue synthetic peptide was made on the basis of N-terminal sequences obtained during purification, and it was found to exhibit gel mobility and staining properties similar to the purified molecules. The peptide maintains cells and their processes in vitro for the HN 33.1 cell line treated with H2O2, and in vivo for cortical neurons after lesions of the cerebral cortex. It has weak homology with a fragment of a putative bacterial antigen and, like that molecule, binds IgG. The peptide also contains a motif reminiscent of a critical sequence in the catalytic region of calcineurin-type phosphatases; surprisingly, like several members of this family, the peptide catalyzes the hydrolysis of para-nitrophenylphosphate in the presence of Mn2+. Application of the peptide to one side of bilateral cerebral cortex lesions centered on area 2 in rats results in an increase in IgG immunoreactivity in the vicinity of the lesions 7 d after surgery. Microglia immunopositive for IgG and ED-1 are, however, dramatically reduced around the lesions in the treated hemisphere. Furthermore, pyramidal neurons that would normally shrink, die, or disintegrate were maintained, as determined by MAP2 immunocytochemistry and Nissl staining. These survival effects were often found in both hemispheres. The results suggest that this peptide operates by diffusion to regulate the immune response and thereby rescue neurons that would usually degenerate after cortical lesions. The phosphatase activity of this molecule also suggests the potential for direct neuron survival-promoting effects.


Figures

Fig. 1.
Fig. 1.
Highlights of purification of the survival-promoting peptide from medium conditioned by Y79 retinoblastoma and HN 33.1 cell lines (see Materials and Methods for further details). A, Flow chart showing the basic purification steps; modifications in the general procedure are shown for the different cell lines. Active fractions or gel bands were identified at various stages of the purification and after the preparative electrophoresis step (see Table 1). In B, a preparative gel from a HN 33.1 CM purification is viewed in reflected light after staining with protein Quick Stain. In this purification, half of the starting material was collected from H2O2-treated cells and half from untreated cells (U). Note diffuse gel band at 5–8 kDa. It is active in the in vitro assay and markedly exaggerated after treatment. C, Rerunning active gel bands on 10–20% gradient gels without reducing agents gave several additional aggregates for both Y79 and HN33.1 preparations. Samples were ∼3 μg by BCA, and gels are stained with silver reagent. The peptide of interest in this study was identified by N-terminal sequencing of bands in positions marked by arrows after these were transferred to PVDF membranes. D, Comparison of purified and synthetic peptides after running samples with reducing reagents. Aggregate bands of purified samples are diminished or absent in favor of a very poorly stained 3 kDa band (arrow) that also appears when the synthetic (YDP) peptide is run under reducing conditions. A more discrete 66–68 kDa band (arrow) is also found with all these samples and appears to represent a persistent aggregate of the peptide. Note that the scrambled peptide (DPY) gives a different pattern under the same conditions. Samples were estimated at 3 μg protein for purified peptides and 10 μg for synthetic peptides. Gels were stained with silver reagent. The lanes on the rightare from a nitrocellulose blot of the synthetic peptides (20 μg each) run under reducing conditions before transfer. The blot was incubated with mouse IgG (2.5 μg/ml) and then immunostained for IgG. The aggregate band of the YDP peptide binds to the IgG.
Fig. 2.
Fig. 2.
Survival assay with HN 33.1 cells.AC show HN cells immunostained for actin after they were subjected to two medium changes (A) or two medium changes after 0.03% H2O2 treatment for 15 min (B, C). The culture shown in B received 1 ng/ml (0.33 nm) of the synthetic peptide (diluted in DMEM) for the second change, whereas the one shown in C received DMEM for both changes. Scale barA, 100 μm. D, Graph of survival of multipolar HN 33.1 cells after H2O2 treatment and medium changes in experiments in which the peptide was supplied at different concentrations. Surviving cells are expressed as a percentage of the DMEM control (D). In this experiment, the peptide was purified from the HN 33.1 cells and supplied at seven different concentrations between 10−11 and 10−1 ng/ml. E, Similar curve for synthetic peptide (YDP) tested between 10−3 and 103 ng/ml peptide concentration. Also shown in this graph is the same experiment with different concentrations of scrambled peptide (DPY), which is ineffective in this assay (n = 6 for all conditions). Similar curves were obtained in replicate experiments except that the peak concentrations varied as outlined in Table 1. *p < 0.05, **p < 0.01, and ***p < 0.001, when peptide treatments at designated concentrations are compared with DMEM controls.
Fig. 3.
Fig. 3.
Increased IgG immunoreactivity after peptide treatment. Micrographs show IgG immunoreactivity in medial surviving cortical segment on both sides of the brain in single sections of operated rats and similar region in an unoperated rat. ForAC, midline is shown, and edge of lesion cavity is lateral and marked with an arrow.A, Section from unoperated rat showing light background IgG immunoreactivity. B, Section from control rat (vehicle on both sides) with bilateral cortical lesion 7 d earlier shows staining above background and dense staining at edge of lesion.C, Section of rat treated with 200 μmpeptide showing bilateral increase in IgG immunoreactivity. Scale bar, 1 mm. D, Higher magnification of layer V of cortical area 3 in single section of rat treated with 100 μm peptide. The peptide-treated cortex (E) shows IgG aggregates outlining cortical pyramidal cells in layer V, an effect much less apparent in the vehicle-treated hemisphere shown inD. There was a tendency for asymmetrical staining at the lower dosages of peptide. Scale bar, 50 μm. The boxesin AC show the region of cortical area 3 examined in D and E and in the quantitative analysis (see Figs. 4, 5).
Fig. 4.
Fig. 4.
Nissl-stained sections of layer Vb of cortical area 3 showing preservation of large pyramidal cells after peptide treatment. A, Normal rat showing the pyramidal cells that characterize this region. Left and right sides are shown.B, Similar region as in A, but this micrograph shows left and right cortical area 3 in a control rat (vehicle on both sides). C, Rat treated with 100 μm peptide. Many of the large cells were preserved after 7 d, more in the left micrograph from the peptide-treated hemisphere. As shown in C (and quantification in Fig.5), vehicle-treated hemispheres in peptide-treated rats contain more pyramidal cells of normal size than in vehicle-treated control rats. Scale bar, 50 μm.
Fig. 5.
Fig. 5.
Preservation of pyramidal cell areas with peptide treatment. Plots of small (<100 μm2) and large (>100 μm2) cells in layer Vb of cortical area 3 of control rats with lesions (vehicle on both sides), peptide-treated rats (peptide and vehicle-treated sides of the brain at the two concentrations of peptide used), and unoperated normal rats. Because there were no left–right differences in either the control or the unoperated rats, these values were combined. The graphs indicate that the lesion results in a loss of large cells and increase in small cells, an effect that is reversed by 100 μm peptide treatment, in which these proportions are normal. The average cell sizes between peptide-treated sides and vehicle-treated sides of the brain in this group was significant (YDP = 153.4 ± 23 μm2, n = 8; vehicle 118.75 ± 10 μm2, n = 8;p < 0.05), although comparisons with controls also suggest bilateral effects of treatment. Average cell size in hemispheres of five control rats was substantially smaller (89.1 ± 11.04 μm2, n = 10,p < 0.05) than in any hemisphere of the treated rats. Rats that received 200 μm peptide show a similar pattern, but difference between two sides was not significant. The values for three unoperated rats were 141.5 ± 4.72 μm2 (n = 6), not different from peptide-treated hemispheres.
Fig. 6.
Fig. 6.
Preservation of MAP2-immunopositive neurons and dendrites in cortical layer V after peptide treatment. The micrographs are from the medial margins of lesions in surviving cortical area 2. They show left and right sides of single sections from different rats and each contains the lesion edge. A andB are from treated rats and show the greater preservation of neuronal structure in the peptide-treated hemisphere at this level than in the vehicle-treated hemisphere. C is from a control rat that received vehicle in both hemispheres and shows both absence of MAP2 immunostaining and disintegrated MAP2+ profiles in a single section. Scale bar, 100 μm.
Fig. 7.
Fig. 7.
A, Frequency of lesions with preserved MAP2-immunopositive neurons and dendrites in surviving cortical area 2 in peptide-treated and control rats. Frequencies were determined by scoring serial sections bilaterally through the entire lesion area. Although neurons with secondary dendritic branches appear on both sides of most of the peptide-treated rats, these are more frequent on the peptide-treated side of the brain. Tertiary dendrites (usually involved in basilar dendritic plexi, Fig. 6) appear in approximately one-third of the rats in the peptide-treated hemisphere, less in the vehicle-treated hemisphere, and none were found in the controls (vehicle on both sides). B, Bar graph showing density of MAP2+ cell bodies in treated animals versus controls in the entire medial surviving segment of the hemisphere. Counts from left and right hemispheres (peptide and vehicle-treated control) were combined for this comparison as were left and right sides of control rats.Peptide-treated, 40.2 ± 4.6 cells/mm2, n = 24;control, 22.8 ± 3.0 cells/mm2;n = 10; p < 0.05).
Fig. 8.
Fig. 8.
A, ED-1 and IgG-immunopositive microglia in peptide-treated and vehicle-treated hemispheres of rats with cortical lesions. The photomicrographs and the quantitative comparisons in B are from the medial margin at the base of the lesions in the same tissue sections. These micrographs show the loss of microglia immunoreactivity around the lesion after treatment with peptide purified from CM of HN 33.1 cells (ED-1) or the synthetic peptide (IgG). Scale bar, 50 μm. B, Counts of microglia cell bodies in ED-1 and IgG-immunostained sections through the middle portion of the lesions. There was an average threefold decrease in the density of cells in the treated hemisphere. There were no differences between low and high-dose rats in this comparison. HN 33.1 CM-treated,n = 8; YDP-treated, n = 12. Statistical confidence levels are as described in Figure 3.
Fig. 9.
Fig. 9.
Catalytic activity of the survival-promoting peptide in the hydrolysis of p-NPP. In these experiments, 5 μm the YDP peptide catalyzes dephosphorylation of p-NPP resulting in the production of nitrophenol, which absorbs at 405 nm. This reaction is in presence of 1 mm Zn2+ and 3 mmMn2+ and monitored for 1 hr beginning at 4 min. A rapid early phase and slower more protracted later phase (steady state) are apparent in the catalyzed reactions. A, Hydrolysis of p-NPP in the presence of 1 and 5 μmYDP, and without Mn ions. In the latter experiments, Mn2+ is omitted from the reaction buffer, and Zn2+ is increased to 4 mm. Similar inhibition was obtained using the usual 1 mmZn2+ but replacing Mn2+ with Ca2+ or Mg2+. B, Inhibition of reaction with 30 μm sodium orthovanadate. Vanadate inhibits mainly the steady state reaction under these conditions. C, Attenuated reaction with 5 μm scrambled peptide (DPY). Concentrations of p-NPP were 1 mm(A) and 2 mm (B,C). Note the higher levels of both catalytic activity and autolysis with the higher substrate concentration. Each time point in the graphs represents the mean and SEM of absorbance values from four to eight different reaction wells for each condition.

Similar articles

Cited by

References

    1. Acharya HR, Dooley CM, Thoreson WB, Ahmad I. cDNA cloning and expression analysis of NeuroD mRNA in human retina. Biochem Biophys Res Commun. 1997;233:459–463. - PubMed
    1. Altschul SF, Boguski MS, Gish W, Wootton JC. Issues in searching molecular sequence databases. Nature Genet. 1994;6:119–129. - PubMed
    1. Beal MF. Aging, energy and oxidative stress in neurodegenerative diseases. Ann Neurol. 1995;38:357–366. - PubMed
    1. Bigot D, Hunt SP. Effect of excitatory amino acids on microtubule-associated proteins in cultured cortical and spinal neurones. Neurosci Lett. 1990;111:275–280. - PubMed
    1. Bigot D, Matus A, Hunt SP. Reorganization of the cytoskeleton in rat neurons following stimulation with excitatory amino acids in vitro. Eur J Neurosci. 1991;3:551–558. - PubMed

Publication types

MeSH terms