. 1998 Sep 15;18(18):7099-110.
doi: 10.1523/JNEUROSCI.18-18-07099.1998.

Anion currents and predicted glutamate flux through a neuronal glutamate transporter

Affiliations

Anion currents and predicted glutamate flux through a neuronal glutamate transporter

T S Otis et al. J Neurosci. .

Abstract

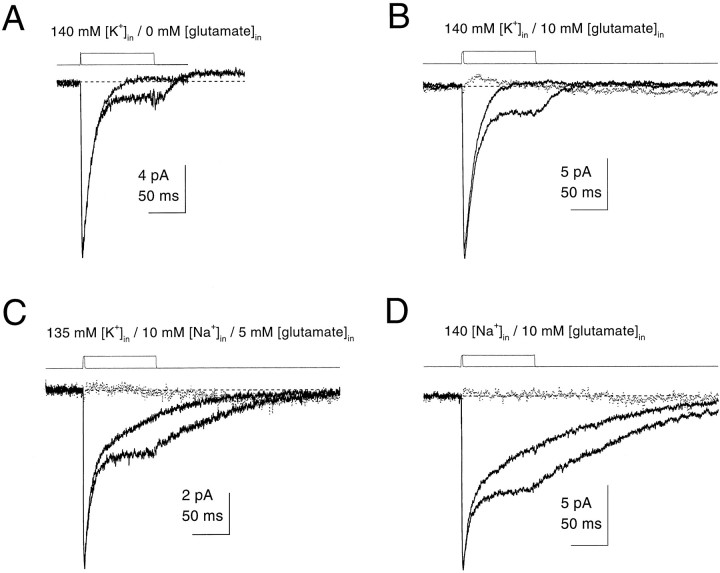
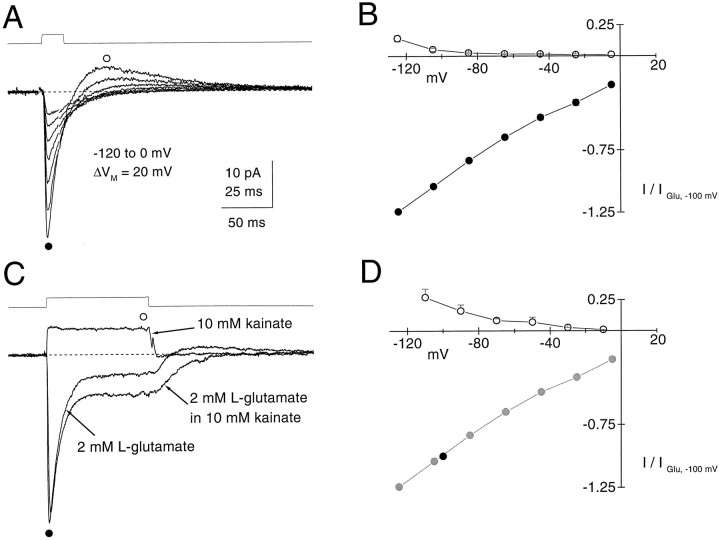
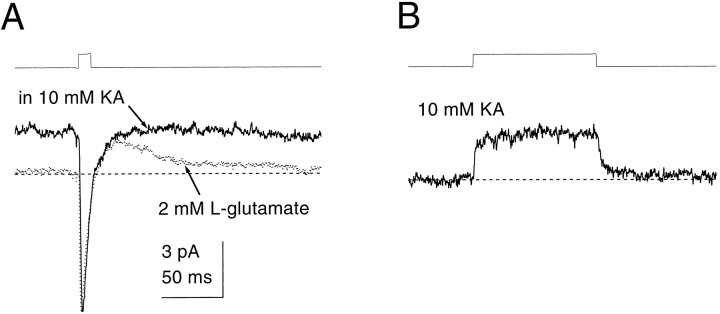
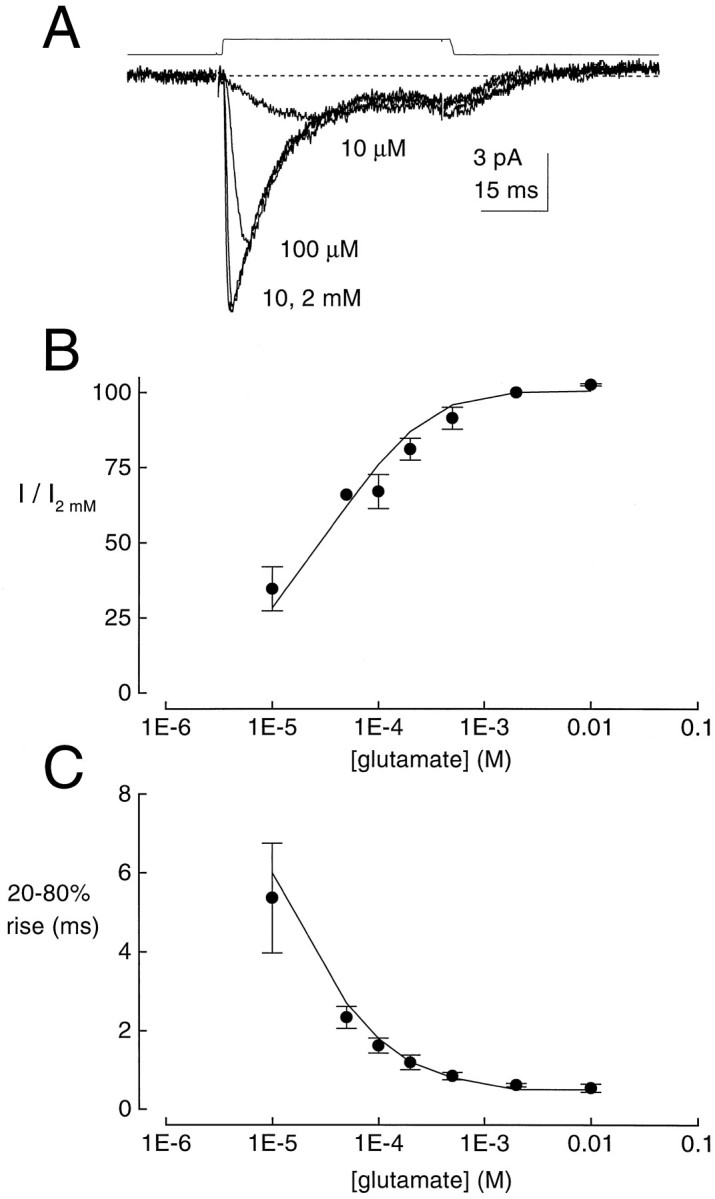
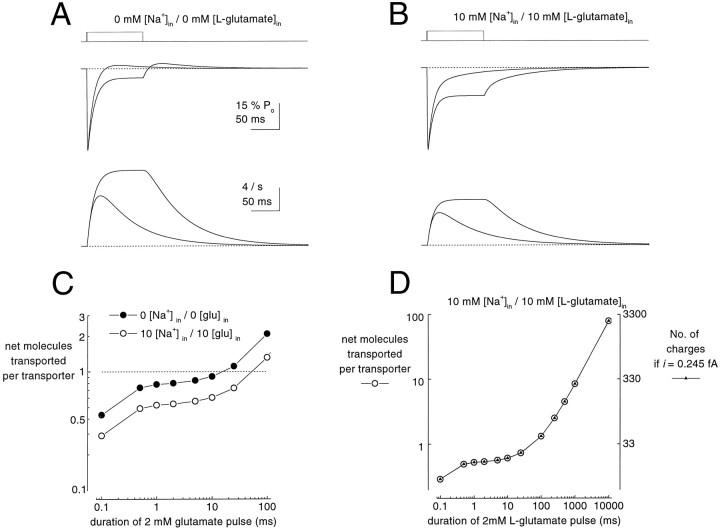
Kinetic properties of a native, neuronal glutamate transporter were studied by using rapid applications of glutamate to outside-out patches excised from Purkinje neurons. Pulses of glutamate activated anion currents associated with the transporter that were weakly antagonized by the transporter antagonist kainate. In addition, kainate blocked a resting anion conductance observed in the absence of glutamate. Transporter currents in response to glutamate concentration jumps under a variety of conditions were used to construct a cyclic kinetic model of the transporter. The model simulates both the anion conductance and the glutamate flux through the transporter, thereby permitting several predictions regarding the dynamics of glutamate transport at the synapse. For example, the concentration-dependent binding rate of glutamate to the transporter is high, similar to binding rates suggested for ligand-gated glutamate receptors. At saturating glutamate concentrations, transporters cycle at a steady-state rate of 13/sec. Transporters are predicted to have a high efficiency; once bound, a glutamate molecule is more likely to be transported than to unbind. Physiological concentrations of internal sodium and glutamate significantly slow net transport. Finally, a fixed proportion of anion and glutamate flux is expected over a wide range of circumstances, providing theoretical support for using net charge flux to estimate the amount and time course of glutamate transport.


Figures

Fig. 1.
Fig. 1.
Intracellular ion and l-glu concentrations affect the kinetics of transporter currents. Each panel shows superimposed responses to brief (<3 msec) and long (100 msec) pulses of 2 mml-glu to an outside-out patch with the indicated intracellular monovalent cation andl-glu concentrations. In addition, B–D show the responses (dotted traces) to the brief pulses ofl-glu in the continuous presence of 300 μmd-aspartate, a selective substrate for the glutamate transporter. d-Aspartate caused a steady-state inward current, and the baselines of these traces have been adjusted by adding 16.6, 8.1, and 20.3 pA for B, C, andD, respectively. The top sets oftraces in each panel are open-tip currents and represent the time course of l-glu application. Holding potential (Vh) is −69, −85, −78, or −88 mV for A–D, respectively. Each trace is the average of 4–12 responses.
Fig. 2.
Fig. 2.
Transporter current can be detected in the absence of l-glu. A, Responses elicited by 10 msec, 2 mm pulses of l-glu at different membrane potentials between −120 and 0 mV. At hyperpolarized potentials the current decays past the initial baseline and transiently appears outward (at approximately the time marked by the ○). This phase is termed the “overshoot current.” B, The mean inward (•) and outward (○) peak amplitudes of responses in four similar experiments were measured and are plotted as a function of membrane potential. All measurements were normalized in each patch to the peak inward current at −100 mV. C, The transporter antagonist kainate inhibits inward current in the absence ofl-glu and weakly inhibits the response to 2 mml-glu. From the same patch, responses to 100-msec-duration jumps into 10 mm kainate, 2 mml-glu, or 2 mml-glu in the continuous presence of 10 mm kainate are superimposed.Vh = −95 mV. The scale bar is as inA, but with a 50 msec time base. D, The peak amplitude of the inward current (•) in response to 2 mml-glu and the average amplitude of the steady-state current (at ○) in response to 10 mm kainate were measured in six patches. The kainate-elicited current was measured at different membrane potentials, and for each patch all values were normalized to the peak inward current at −100 mV. TheI–V curve for the inward current in Bhas been superimposed (gray circles) for comparison over the entire range of membrane potentials. The current versus voltage relationships in B and Dare consistent with the outward current resulting from a block of an inward current with the same ionic basis as that elicited byl-glu.
Fig. 3.
Fig. 3.
Kainate blocks the overshoot current.A, Responses to a 10 msec pulse of 2 mml-glu in the continuous presence (bold trace) or absence (dotted trace) of 10 mm kainate. Note that the baseline of the trace in the continuous presence of kainate has shifted outward and that the overshoot current has been blocked. B, A 100-msec-duration jump into 10 mm kainate elicits an outward current in the same patch. Vh = −126 mV.
Fig. 4.
Fig. 4.
Dose dependencies of the rise time and peak current. A, Responses from the same patch to 50 msec steps of 10000, 2000, 100, and 10 μml-glu.Vh = −80 mV. B, Normalized peak amplitude versus [l-glu]. Each • indicates the mean peak amplitude (normalized to the peak in response to the 2 mm dose) from between 3 and 11 patches. Theline represents identical measurements from the simulation presented in Results. C, The 20–80% rise times versus [l-glu]. Patch data are represented by the • (n = 5 to 16 patches); the linewas obtained from an analysis of the simulation.
Fig. 5.
Fig. 5.
Recovery from depression of the transporter current. A, Responses to pairs of 10 msec steps into 2 mml-glu separated by varying intervals of 10, 25, 50, 100, 150, and 200 msec. Vh = −74 mV. B, Depression of the peak amplitude of the second response, P2, relative to the peak of the first, P1, versus the interval. Mean data from six patches are represented by the •; theline indicates the results from an analysis of the simulation.
Fig. 6.
Fig. 6.
A kinetic model for the Purkinje neuron transporter. The subscripts o and iindicate whether the binding sites for l-glu or ions are facing the extracellular or intracellular spaces, respectively. The prefixes K, N, H, andG represent bound ions K+, Na+, H+, and l-glu, whereas the superscript indicates the number of Na+ ions that are bound. The asteriskdenotes the two open-channel states. Equilibrium constantsK1K11 are indicated for the appropriate reactions; values for the constants are listed in Table 2.
Fig. 7.
Fig. 7.
Simulations of the effects of intracellular ion and l-glu concentrations on the kinetics of transporter currents. Each panel represents simulated GTAs in response to brief (<3 msec) and long (100 msec) pulses of 2 mml-glu, with varying internal l-glu and ion concentrations as indicated. The conditions match those for the experiments shown in Figure 1. The top set oftraces in each panel indicates the time course ofl-glu application. Po denotes the sum of the occupancy probabilities of the two open states. The baseline (dashed line) in this and all subsequent figures simulating Po is atPo = 0.062 because of the conductance in the absence of agonist.
Fig. 8.
Fig. 8.
Simulations of the dose dependence, recovery, and kainate blockade experiments. A, Results from the model in response to 50 msec steps into varying doses of l-glu. The conditions are the same as in Figure 4A.B, Simulations of pairs of 10 msec steps of 2 mml-glu delivered at different intervals to monitor the recovery. Conditions are the same as in Figure5A. C, To simulate the effects of 10 mm kainate on the overshoot, we added an additional state to the model shown in Figure 6. This kainate-bound state was in fast equilibrium with the state N3To and had a KD = 1 mm, with a [kainate]-dependent binding rate of 107m/sec and a dissociation rate of 104/sec. Displayed are superimposed responses to 10 msec pulses of 2 mml-glu delivered to the model in the continuous presence (darker line) and in the absence of 10 mm kainate. Conditions are the same as those in Figure 3A.
Fig. 9.
Fig. 9.
Simulations of GTA and of the amount of l-glu uptake. A, Simulated GTA (middle set of traces) and net flux of l-glu (bottom set oftraces) to the intracellular compartment in response to a 1- and 100-msec-duration pulse of 2 mml-glu. The top set of traces indicates the time course of l-glu presentation. The simulation was performed with no Na+ or l-glu in the intracellular compartment. B, Similar simulation as inA but with 10 mm [Na-Gluin]. Note the slowing of the GTA, as in Figures 1 and 7, and the reduced net flux of l-glu. C, The net number of l-glu molecules transported per transporter as a function of the duration of a 2 mml-glu pulse. The simulation has been performed for the two different internal solutions (0 [Na-Gluout], •; 10 mm[Na-Gluout], ○) shown in A andB. The cases in which the predicted number of transported molecules is <1 can be considered as the probability, per transporter, of net accumulation of an l-glu molecule. Note that both axes are on a logarithmic scale. D, Shown on a log–log scale, the predicted flux of l-glu (○) and charge (▴) per transporter as a function of the duration of a 2 mm pulse of l-glu. To convertPo to charge flux, we arbitrarily chose a single channel current of 0.245 fA.

Similar articles

Cited by

References

    1. Arriza JL, Fairman WA, Wadiche JL, Murdoch GH, Kavanaugh MP, Amara SG. Functional comparisons of three glutamate transporter subtypes cloned from human motor cortex. J Neurosci. 1994;14:5559–5569. - PMC - PubMed
    1. Barbour B, Brew H, Attwell D. Electrogenic uptake of glutamate and aspartate into glial cells isolated from the salamander (Ambystoma) retina. J Physiol (Lond) 1991;436:169–193. - PMC - PubMed
    1. Barbour B, Keller BU, Llano I, Marty A. Prolonged presence of glutamate during excitatory synaptic transmission to cerebellar Purkinje cells. Neuron. 1994;12:1331–1343. - PubMed
    1. Bergles DE, Jahr CE. Synaptic activation of glutamate transporters in hippocampal astrocytes. Neuron. 1997;19:1297–1308. - PubMed
    1. Bergles DE, Dzubay JA, Jahr CE. Glutamate transporter currents in Bergmann glial cells follow the time course of extrasynaptic glutamate. Proc Natl Acad Sci USA. 1997;94:14821–14825. - PMC - PubMed

Publication types

MeSH terms

LinkOut - more resources