. 1998 Sep 15;18(18):7189-99.
doi: 10.1523/JNEUROSCI.18-18-07189.1998.

Imaging spreading depression and associated intracellular calcium waves in brain slices

Affiliations

Imaging spreading depression and associated intracellular calcium waves in brain slices

T A Basarsky et al. J Neurosci. .

Abstract

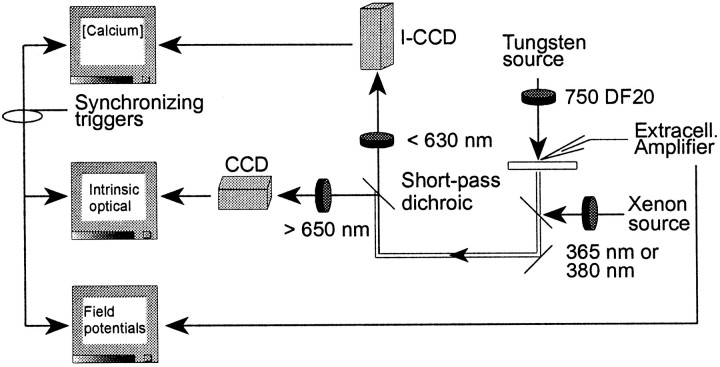
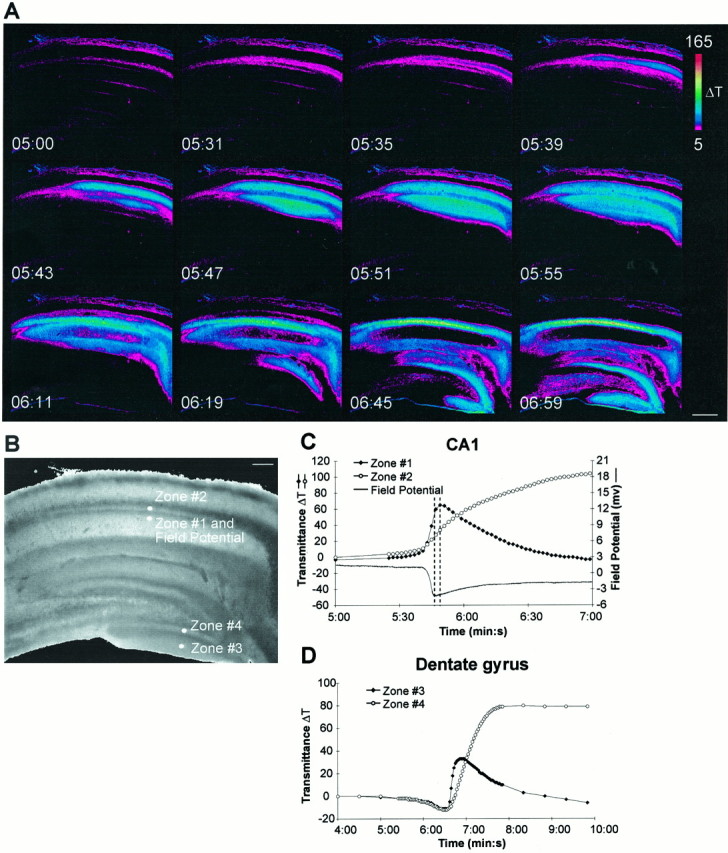
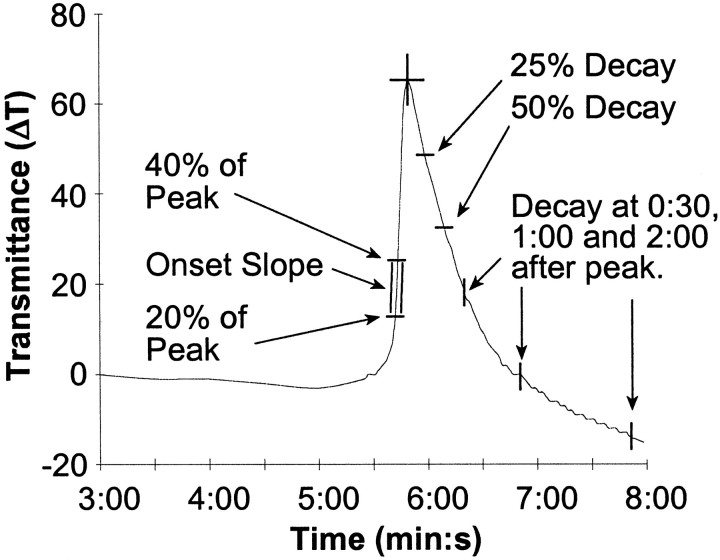
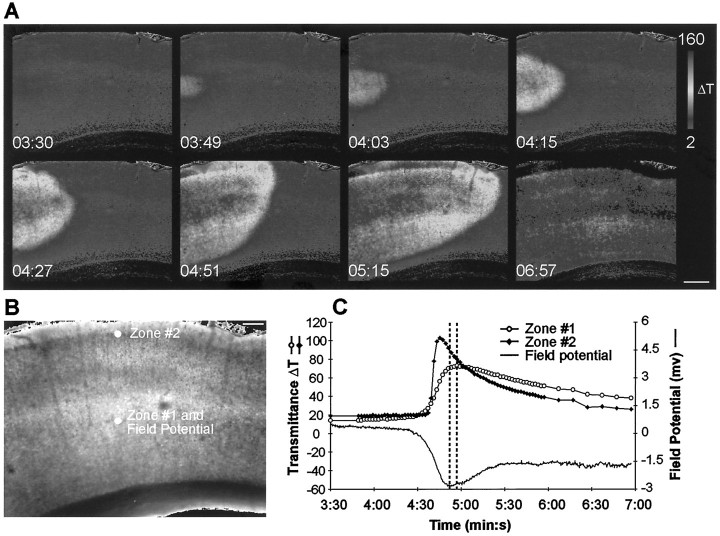
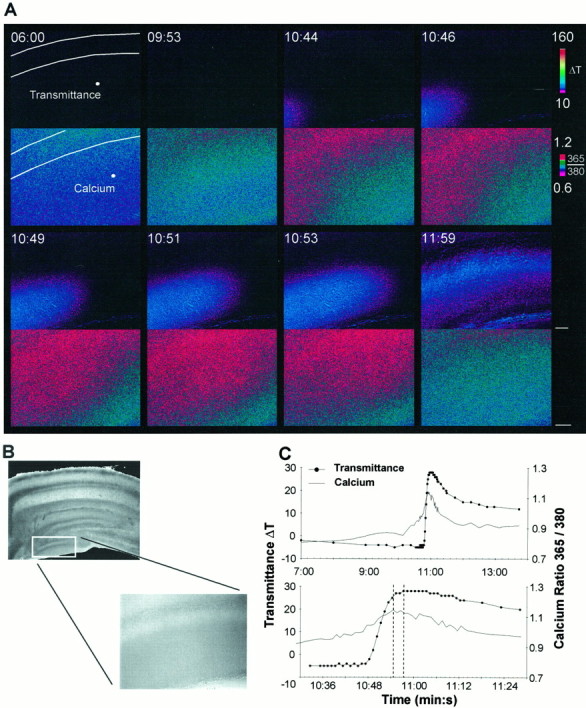
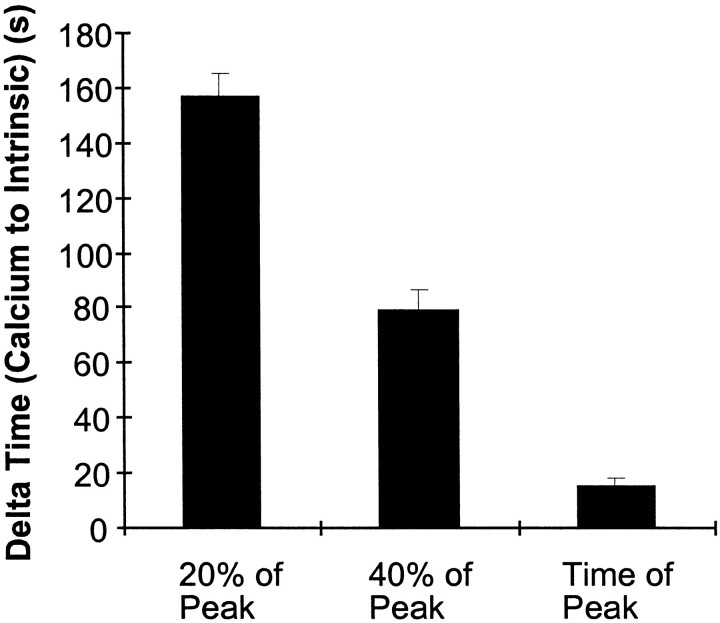
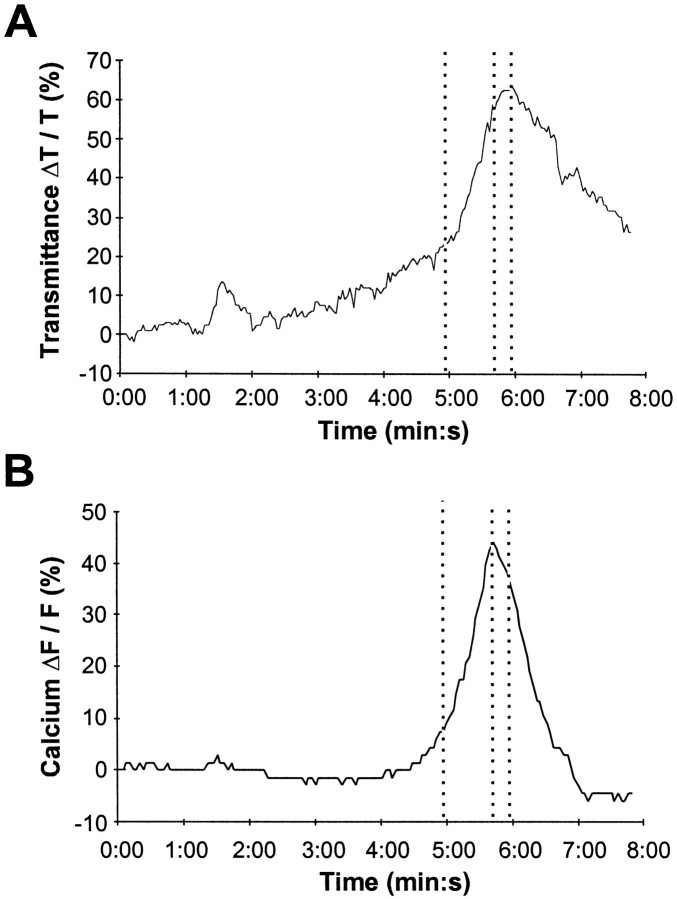
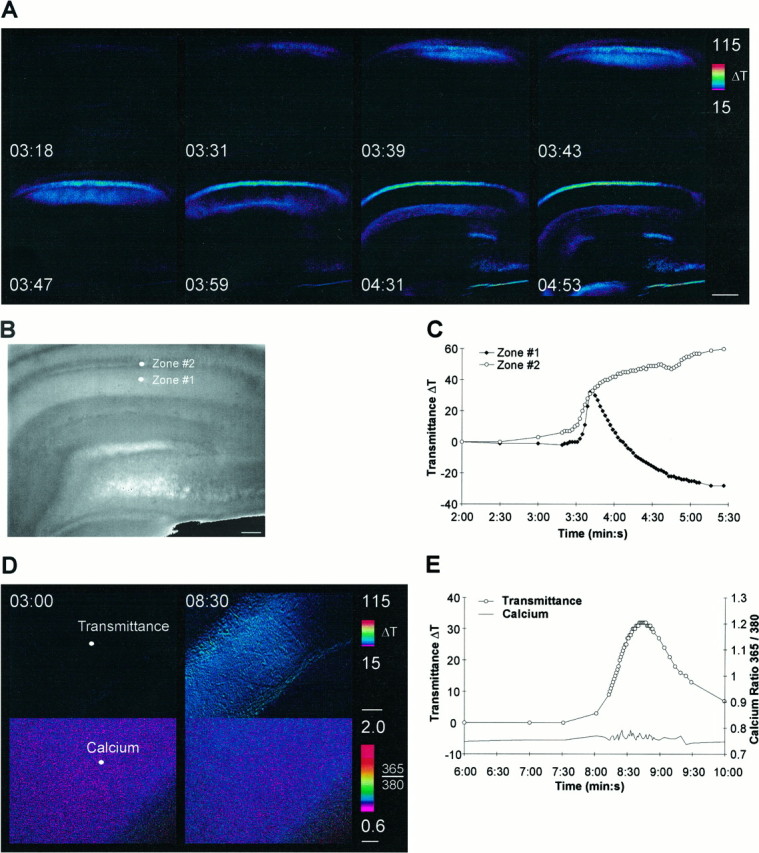
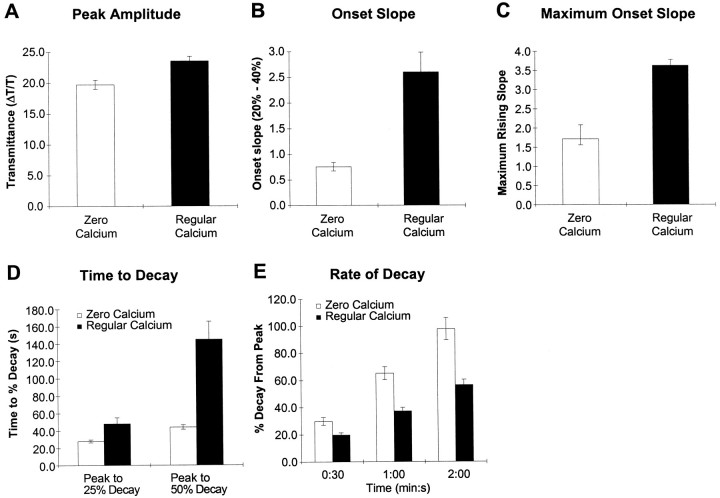
Spreading depression (SD) was analyzed in hippocampal and neocortical brain slices by imaging intrinsic optical signals in combination with either simultaneous electrophysiological recordings or imaging of intracellular calcium dynamics. The goal was to determine the roles of intracellular calcium (Ca2+int) waves in the generation and propagation of SD. Imaging of intrinsic optical signals in the hippocampus showed that ouabain consistently induced SD, which characteristically started in the CA1 region, propagated at 15-35 micrometer/sec, and traversed across the hippocampal fissure to the dentate gyrus. In the dendritic regions of both CA1 and the dentate gyrus, SD caused a transient increase in light transmittance, characterized by both a rapid onset and a rapid recovery. In contrast, in the cell body regions the transmittance increase was prolonged. Simultaneous imaging of intracellular calcium and intrinsic optical signals revealed that a slow Ca2+int increase preceded any change in transmittance. Additionally, a wave of increased Ca2+int typically propagated many seconds ahead of the change in transmittance. These calcium increases were also observed in individual astrocytes injected with calcium orange, indicating that Ca2+int waves were normally associated with SD. However, when hippocampal slices were incubated in calcium-free/EGTA external solutions, SD was still observed, although Ca2+int waves were completely abolished. Under these conditions SD had a comparable peak increase in transmittance but a slower onset and a faster recovery. These results demonstrate that although there are calcium dynamics associated with SD, these increases are not necessary for the initiation or propagation of spreading depression.


Figures

Fig. 1.
Fig. 1.
Schematic of the acquisition setup. Independent acquisition systems permitted simultaneous imaging of the intrinsic optical signals and fura-2-based intracellular calcium dynamics, as well as extracellular field potentials. Slices were continuously transilluminated with 750 nm light to monitor intrinsic optical signals and alternately epi-illuminated by 365 or 380 nm light when calcium images were acquired. The short-pass (<650 nm) dichroic and short-pass (<630 nm) barrier filter ensured that the intensified CCD only detected light from the fura-2 signal. An additional long-pass (>650 nm) filter on the intrinsic optical acquisition system ensured that there was no crossover of the fura-2 signal into the intrinsic optical channel. In some cases, extracellular field potentials were recorded. Typically the intrinsic optical computer provided the synchronizing trigger outputs to ensure temporal synchrony with the rest of the acquisition.
Fig. 2.
Fig. 2.
Imaging spreading depression in the hippocampus.A, Intrinsic optical signals during superfusion of regular ASCF containing 100 μm ouabain. Unless otherwise noted, ouabain addition was started at 1 min 30 sec in all experiments. Note the initial transient increase in stratum radiatum of CA1 that propagates throughout the entire slice. B, Demarcation of the areas that were used for measurements. C,D, Time course of the intrinsic optical signal and extracellular field potential. C, Responses in the stratum radiatum (zone 1) and stratum pyramidale (zone 2) of CA1.D, Responses in the molecular layer (zone 3) and granule cell layer (zone 4) of the dentate gyrus. The time course of the field potential in C resembles the time course of the intrinsic optical signal in the stratum radiatum. The dashed lines represent the peaks of the intrinsic optical signal and the field potential. The pseudocolor bar is a linear representation of the change in transmittance. Note that the time is given in minutes and seconds. Scale bars: A, 400 μm;B, 200 μm.
Fig. 3.
Fig. 3.
Quantification of the intrinsic optical signal. Time course of the intrinsic optical signal from a single zone in the stratum radiatum of CA1. The onset of an event was defined by the time to reach 20% of the peak. The onset kinetics were characterized by determining the slope between 20 and 40% of the peak response, as well as the maximum slope during the onset phase. The recovery phase was defined by measuring the percentage decay at fixed time points (30 sec, 1 min, 2 min) after the peak response and by the time taken to decay a fixed percentage from the peak.
Fig. 4.
Fig. 4.
Imaging spreading depression in neocortical slices. A, Intrinsic optical signals during superfusion of aCSF containing 100 μm ouabain. In this case, SD was initiated at the leftmost visible portion of the slice and propagated uniformly across the entire slice. B, Description of the areas that were used for measurements. C, Time course of the intrinsic optical signal and extracellular field potential for one region. Note the similar time course of the field potential and associated intrinsic optical signal. The dashed linesrepresent the peaks of the intrinsic optical signal and the field potential. Scale bars: A, 400 μm; B, 200 μm.
Fig. 5.
Fig. 5.
Simultaneous imaging of intracellular calcium and intrinsic optical signals in the dentate gyrus. A, Intrinsic optical signals (top) and intracellular calcium (bottom) during superfusion of aCSF containing 100 μm ouabain. A slow rise in calcium precedes any detectable change in the intrinsic optical signal, and a calcium wave preceded the intrinsic optical signal wave. The white lines denote the regions corresponding to the cell body layer in the dentate gyrus. The white dots denote the areas that were used for measurements. B, Because a higher power objective was required for enhanced spatial resolution, only a portion of the dentate gyrus was imaged (see Results for details).C, Time course of the intrinsic optical signal and intracellular calcium levels during SD. The same data with an expanded time scale are shown in the bottom panel. Thedashed lines represent the peaks of the intrinsic optical signal and the calcium ratio. Scale bar in A, 50 μm for both intrinsic and calcium images.
Fig. 6.
Fig. 6.
Intracellular calcium elevations preceded the onset of the intrinsic optical signal. The time differential between intracellular calcium elevations and the intrinsic optical signal is shown. The δ time is given for three different onset parameters, 20% of the peak, 40% of the peak, and the time of the peak. These three parameters are described in detail in Figure 3. In all measurements the calcium signal preceded the intrinsic optical signal.
Fig. 7.
Fig. 7.
Imaging of astrocytic intracellular calcium and intrinsic optical signals in the hippocampus. A, Intrinsic optical signals (top) and intracellular calcium (bottom) during bath application of 100 μm ouabain, which was started at 2 min. Individual astrocytes were intracellularly injected with calcium orange. Thedotted lines represent the onset of the calcium signal, the peak of the calcium signal, and the peak of the intrinsic optical signal. Note that the peak of the calcium signal precedes the peak of the intrinsic optical signal.
Fig. 8.
Fig. 8.
Spreading depression in the absence of external calcium. A, Intrinsic optical signals in 0-Ca2+ aCSF during bath application of 100 μm ouabain. B, Description of the areas that were used for measurements. C, Time course of the intrinsic optical signal in stratum radiatum and stratum pyramidale of CA1. D, Intracellular calcium increases are absent in 0-Ca2+ aCSF. Left, Before spreading depression. Right, Peak of spreading depression. Thewhite dots denote the areas of measurement shown inE. E, Time course of the intrinsic optical signal and intracellular calcium levels in 0-Ca2+ aCSF. Note the complete absence of any calcium increase, although SD still occurred. Scale bars:A, 400 μm; B, 200 μm;D, 50 μm (top andbottom).
Fig. 9.
Fig. 9.
Analysis of spreading depression in the presence and absence of external calcium. The amplitudes of the peak response are shown in A. Note that the peak responses are expressed as δT/T, where T was defined as the initial transmittance level for each zone. The rising phase of SD was decreased in the absence of calcium. The onset slope, measured as either the slope between 20 and 40% of the peak (B), or the maximum slope from onset to peak (C), was smaller in the absence of calcium. The recovery phase is faster in 0-Ca2+ aCSF (D, E). The time to decay 25 or 50% from the peak is shown inD, whereas the rate of decay defined as the percentage decay over a fixed time interval is given in E.

References

    1. Andrew RD, MacVicar BA. Imaging cell volume changes and neuronal excitation in the hippocampal slice. Neuroscience. 1994;62:371–383. - PubMed
    1. Andrew RD, Lobinowich ME, Osehobo EP. Evidence against volume regulation by cortical brain cells during acute osmotic stress. Exp Neurol. 1997;143:300–312. - PubMed
    1. Charles AC. Glia-neuron intercellular calcium signalling. Dev Neurosci. 1994;16:196–206. - PubMed
    1. Charles AC, Dirksen ER, Merrill JE, Sanderson MJ. Mechanisms of intracellular calcium signalling in glial cells studied with dantrolene and thapsigargin. Glia. 1993;7:134–145. - PubMed
    1. Churchwell KB, Wright SH, Emma F, Rosenberg PA, Strange K. NMDA receptor activation inhibits neuronal volume regulation after swelling induced by veratridine-stimulated Na+ influx in rat cortical cultures. J Neurosci. 1996;16:7447–7457. - PMC - PubMed

Publication types

MeSH terms

LinkOut - more resources