. 1998 Sep 15;18(18):7232-43.
doi: 10.1523/JNEUROSCI.18-18-07232.1998.

Intracellular calcium and cell death during ischemia in neonatal rat white matter astrocytes in situ

Affiliations

Intracellular calcium and cell death during ischemia in neonatal rat white matter astrocytes in situ

R Fern. J Neurosci. .

Abstract

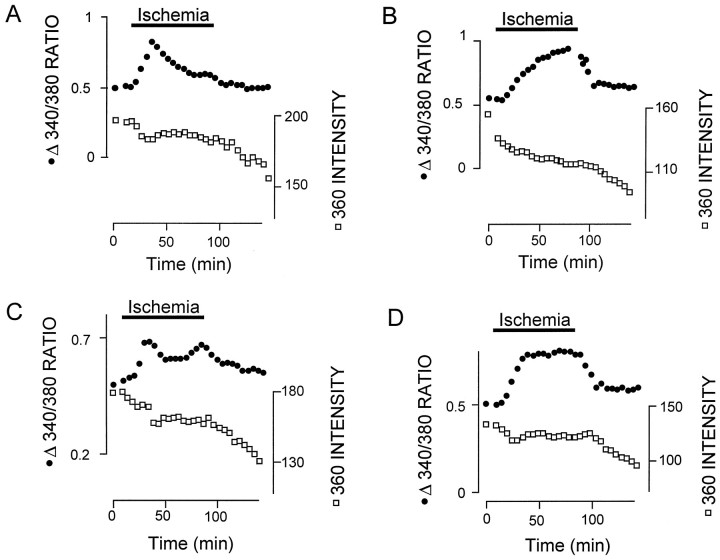
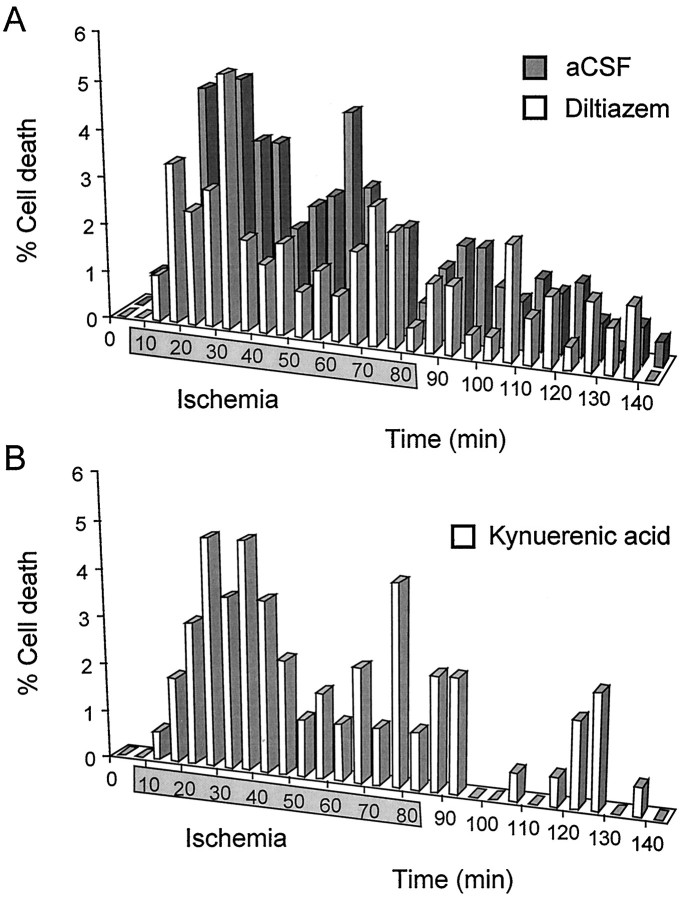
The major pathological correlate of cerebral palsy is ischemic injury of CNS white matter. Histological studies show early injury of glial cells and axons. To investigate glial cell injury, I monitored intracellular Ca2+ and cell viability in fura-2-loaded neonatal rat white matter glial cells during ischemia. Fura-2 fixation combined with immunohistochemistry revealed that fura-2-loaded cells were GFAP+/O4(-) and were therefore a population of neonatal white matter astrocytes. Significant ischemic Ca2+ influx was found, mediated by both L- and T-type voltage-gated Ca2+ channels. Ca2+ influx via T-type channels was the most important factor during the initial stage of ischemia and was associated with significant cell death within 10-20 min of the onset of ischemia. The Na+-Ca2+ exchanger acted to remove cytoplasmic Ca2+ throughout the ischemic and recovery periods. Neither the release of Ca2+ from intracellular stores nor influx via glutamate-gated channels contributed to the rise in intracellular Ca2+ during ischemia. Ischemic cell death was reduced significantly by removing extracellular Ca2+ or by blocking voltage-gated Ca2+ channels. The exclusively voltage-gated Ca2+ channel nature of the Ca2+ influx, the role played by T-type Ca2+ channels, the protective effect of the Na+-Ca2+ exchanger, and the lack of significant Ca2+ release from intracellular stores are features of ischemia that have not been reported in other CNS cell types.


Figures

Fig. 1.
Fig. 1.
Colocalization of GFAP and fura-2 in the nRON.Top left, Confocal image of GFAP immunoreactivity in a P1 RON. Cy3 secondary antibody was excited at 550 nm, and the image was collected at 565 nm. This slice was taken at the edge of the nerve (oriented at the top of the panel), showing a number of GFAP+ somata. Top right, Confocal image of fura-2 in the same section as the top left panel. Fura-2 was excited at 364 nm, and the image was collected at 520 nm. Bottom, Superimposed images from the top panels, showing that all cells containing fura-2 are GFAP+.
Fig. 2.
Fig. 2.
Ischemia is followed by increased [Ca2+]i and cell death in neonatal white matter astrocytes. Left, A series of 360 images of a section of nRON taken at various times after the onset of ischemia. Six cells are clearly visible at t = 0 min (shown in a line drawing, top right). At different points during ischemia three of the cells disappear from the images. A, The change in 340:380 ratio of cells1, 2, and 3, showing that ischemia results in increases in [Ca2+]i. Filled symbolsindicate that the cell retained dye; open symbolsindicate that the cell died and no longer retained dye.B, The 360 intensity of the cells, showing loss of signal at different times after the onset of ischemia. Loss of fluorescence was taken to indicate cell death, and the 340:380 ratio no longer represented [Ca2+]i after that point. Note that plots have been shifted along they-axis to differentiate the data more clearly.
Fig. 3.
Fig. 3.
The incidence of cell death during ischemia and under control conditions. A, The percentage of the total initial number of cells that die in each 5 min epoch is plotted against time for ischemia experiments. Note that cell death rises to a peak between 20 and 35 min of ischemia, with a second peak between 55 and 70 min. B, Similar plot for control experiments in which nerves are perfused with oxygenated aCSF throughout.
Fig. 4.
Fig. 4.
Ischemic changes in [Ca2+]i are dependent on extracellular Ca2+. A, The 340:380 ratio (filled circles, left scale) and 360 intensity (open squares, right scale) recorded from a representative cell during an ischemia experiment performed in the absence of extracellular Ca2+. There was no change in 340:380 ratio, and cell death did not occur.B, A similar plot for a cell that died during ischemia in the absence of extracellular Ca2+. Note that no increase in the 340:380 ratio occurred before cell death.C, A cell that died under control conditions, in oxygenated aCSF. Note that the 340:380 ratio increases before cell death. D, The incidence of cell death in ischemia experiments performed in the absence of extracellular Ca2+ (open bars). Ischemic cell death in normal Ca2+ is shown for comparison (filled bars). The shaded box on the time axis represents the period of ischemia.
Fig. 5.
Fig. 5.
Changes in [Ca2+]i during ischemia. The 340:380 ratio (filled circles, left scale) and 360 intensity (open squares, right scale) were recorded from four cells during ischemia experiments. A, [Ca2+]irises quickly during ischemia, reaches a peak, and declines almost to resting during the ongoing insult. B, [Ca2+]i rises slowly during ischemia and starts to decline only in the recovery period. C, Both an initial and a late increase in [Ca2+]i. D, [Ca2+]i rises quickly, reaches a plateau, and starts to recover only once the control conditions are reestablished. Note that none of these cells died.
Fig. 6.
Fig. 6.
The late increase in [Ca2+]i is attributable to Ca2+ influx through L-type channels.A, The 340:380 ratio and 360 intensity of a cell during an ischemia experiment performed in the presence of the nonselective ionotropic glutamate antagonist kynurenic acid (1 mm). Both an early and a late Ca2+ influx are apparent.B, A similar plot from an ischemia experiment performed in the presence of the L-type Ca2+ channel blocker diltiazem (50 μm). Note that only an early change in [Ca2+]i is present. C, A plot from an ischemia experiment performed in the combined presence of 1 mm kynurenic acid and 50 μm diltiazem. None of these representative cells dies.
Fig. 7.
Fig. 7.
A, The incidence of cell death in the presence of 50 μm diltiazem (open bars). Cell death in normal Ca2+ is shown for comparison (filled bars). The shaded box on the time axis represents the period of ischemia. Note that an early peak in the incidence of cell death is present in diltiazem. B, The incidence of cell death in the presence of 1 mm kynurenic acid.
Fig. 8.
Fig. 8.
Early Ca2+ influx and early cell death are blocked by Ni2+. A, The 340:380 ratio and 360 intensity of a representative cell from an ischemia experiment performed in the presence of 400 μmNi2+. Note that there is a gradual increase in [Ca2+]i, with no early component. The cell does not die. B, The incidence of cell death in the presence of 400 μmNi2+ (open bars). Note that there is no early peak in the incidence of cell death. Cell death in normal Ca2+ is shown for comparison (filled bars). The shaded box on the time axis represents the period of ischemia.
Fig. 9.
Fig. 9.
Combined T-type and L-type Ca2+channel block removes both early and late Ca2+influx during ischemia and mitigates early and late cell death.A, The 340:380 ratio and 360 intensity of a representative cell from an ischemia experiment performed in the presence of 400 μm Ni2+ and 50 μm diltiazem. No significant change in [Ca2+]i occurs, and the cell does not die. B, Similar plot showing a cell that dies under the same experimental conditions. Note that cell death (indicated by thearrow) is preceded by an increase in [Ca2+]i. C, The incidence of cell death in an ischemia experiment in the presence of 400 μm Ni2+ and 50 μmdiltiazem. Note that little cell death occurs during ischemia.
Fig. 10.
Fig. 10.
Perfusion with bepridil during ischemia.A, The 340:380 ratios of four representative cells from an ischemia experiment performed in the presence of the Na+–Ca2+ exchange inhibitor bepridil (50 μm). [Ca2+]i increases in all cells, and no fall in [Ca2+]i is found during ischemia. Partial recovery of [Ca2+]iis apparent in some cells after ischemia. B, The incidence of cell death during ischemia experiments performed in the presence of 50 μm bepridil.
Fig. 11.
Fig. 11.
Perfusion with La3+ during ischemia. A, The 340:380 ratios of two cells from an ischemia experiment performed in the presence of 100 μmLa3+. The top recording (open squares) is from a representative cell that shows no significant change in 340:380 ratio during or after ischemia. Thebottom recording (filled circles) shows a large increase in ratio in the latter part of the experiment. This kind of response was found in a significant minority of cells. Neither cell died (data not shown). B, The incidence of cell death in ischemia experiments performed in the presence of 100 μm La3+. A low level of cell death is present throughout.
Fig. 12.
Fig. 12.
Histogram showing the incidence of cell death in ischemia experiments performed in various solutions. nrepresents sample size (cells); *** represents statistical significance as compared with cell death in normal aCSF (p < 0.001); †† represents statistical significance as compared with cell death in ischemia experiments performed in zero Ca2+(p < 0.05; ††† < 0.01).
Fig. 13.
Fig. 13.
Two patterns of delayed cell death after ischemia. A, B, Plots of 340:380 ratio (top) and 360 intensity (bottom) from ischemia experiments. A, Ischemia is associated with an early Ca2+ influx that is not associated with cell death and a late influx that is (cell death indicated byarrows). B, Ischemia is associated with Ca2+ influx that does not return to baseline and is associated with cell death. C, Delayed cell death, defined as the percentage of cells alive at the end of ischemia that subsequently die in the recovery period, under various conditions. Delayed cell death is abolished by removing Ca2+from the perfusing solution and is reduced to nonsignificant levels by a block of Ca2+ influx. ** represents statistical significance as compared with delayed cell death in control conditions (p < 0.05; ***p < 0.01).
Fig. 14.
Fig. 14.
Ca2+ influx and cell death during ischemia in neonatal optic nerve astrocytes. Ischemia is followed by a drop in ATP and breakdown in the operation of ATP-dependent membrane transport proteins (1). The resulting membrane depolarization activates Ni2+- and La3+-sensitive voltage-gated Ca2+ channels (2; apparently T-type channels). T-type channel-mediated Ca2+ influx is transitory, and [Ca2+]i may recover because of the action of the Na+–Ca2+ exchanger (4). There is a subsequent Ca2+ influx mediated by L-type Ca2+ channels (3). Increased [Ca2+]i resulting from Ca2+ influx through voltage-gated channels is associated with cell death.

Similar articles

Cited by

References

    1. Banker BQ, Larroche J-C. Periventricular leukomalacia of infancy: a form of neonatal anoxic encephalopathy. Arch Neurol. 1962;7:386–410. - PubMed
    1. Barres BA, Chun LL, Corey DP. Calcium current in cortical astrocytes: induction by cAMP and neurotransmitters and permissive effect of serum factors. J Neurosci. 1989;9:3169–3175. - PMC - PubMed
    1. Barres BA, Koroshetz WJ, Chun LL, Corey DP. Ion channel expression by white matter glia: the type-1 astrocyte. Neuron. 1990;5:527–544. - PubMed
    1. Bevensee MO, Schwiening CJ, Boron WF. Use of BCECF and propidium iodide to assess membrane integrity of acutely isolated CA1 neurons from rat hippocampus. J Neurosci Methods. 1995;58:61–75. - PubMed
    1. Butt AM, Ransom BR. Morphology of astrocytes and oligodendrocytes during development in the intact rat optic nerve. J Comp Neurol. 1993;338:141–158. - PubMed

Publication types

MeSH terms

LinkOut - more resources