. 1998 Sep 15;18(18):7411-25.
doi: 10.1523/JNEUROSCI.18-18-07411.1998.

A statistical paradigm for neural spike train decoding applied to position prediction from ensemble firing patterns of rat hippocampal place cells

Affiliations

A statistical paradigm for neural spike train decoding applied to position prediction from ensemble firing patterns of rat hippocampal place cells

E N Brown et al. J Neurosci. .

Abstract

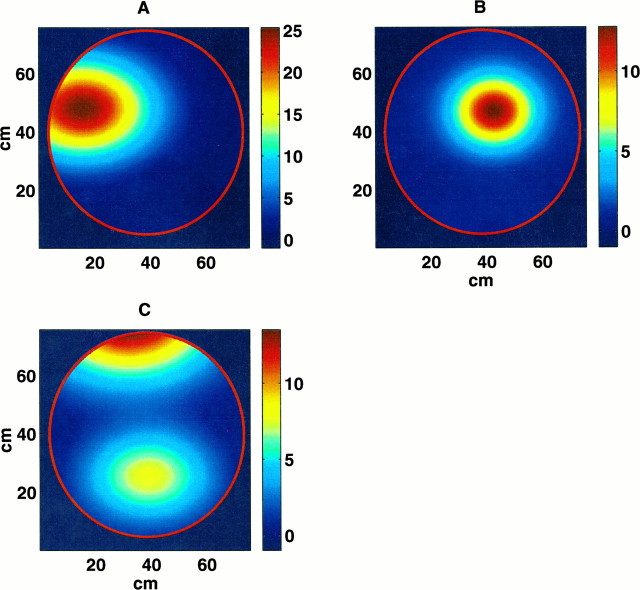
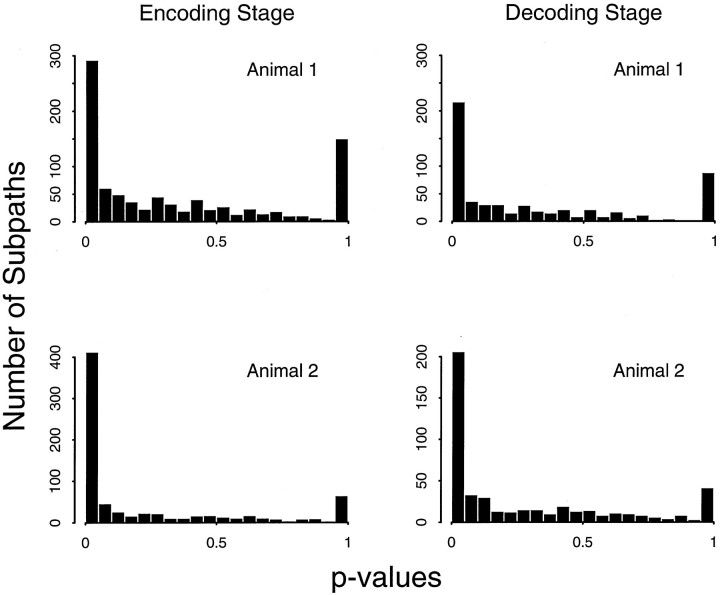
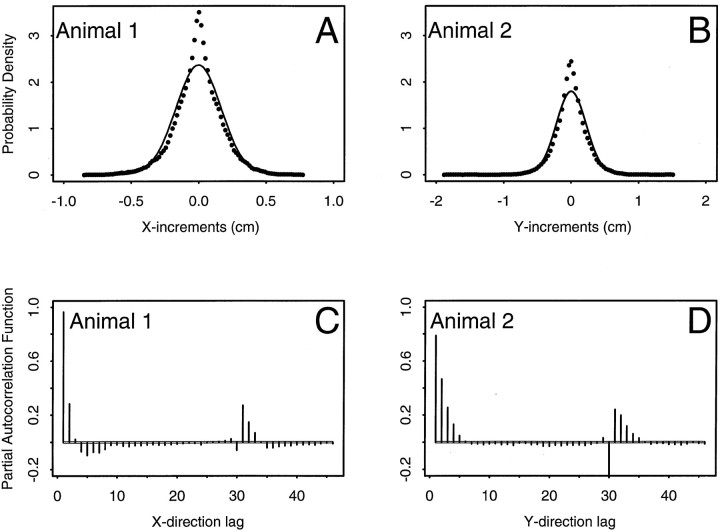
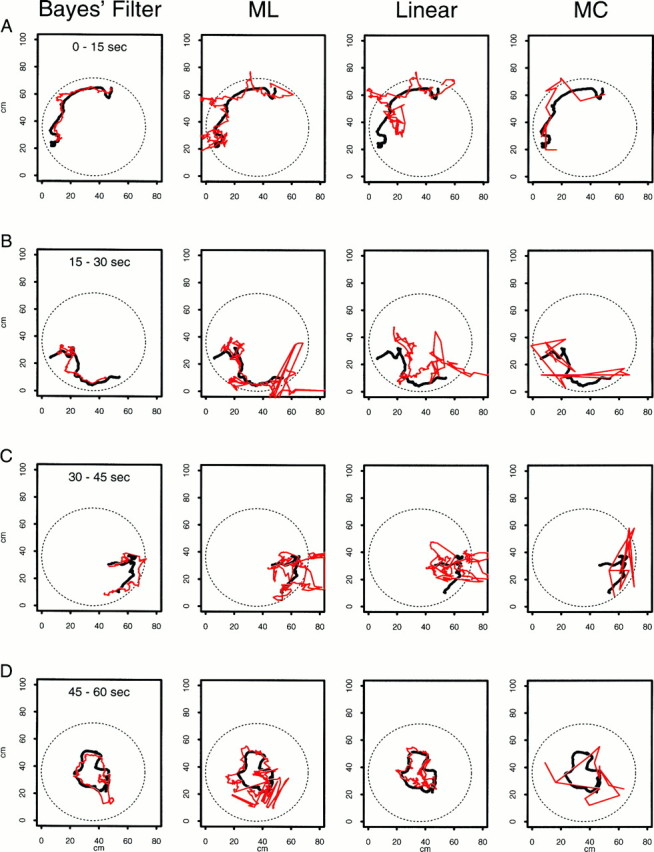
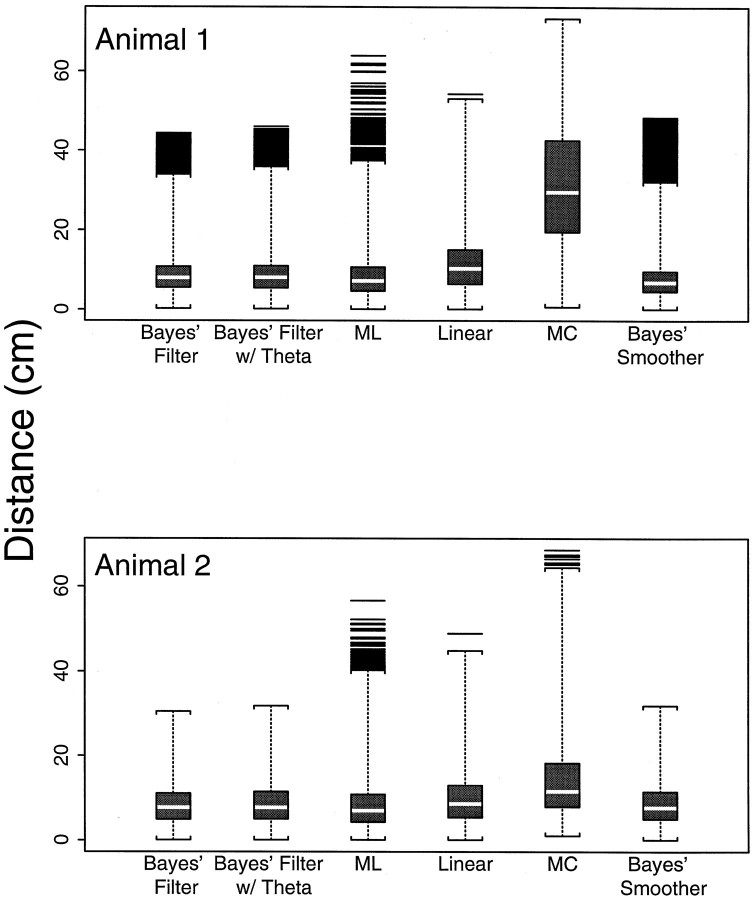
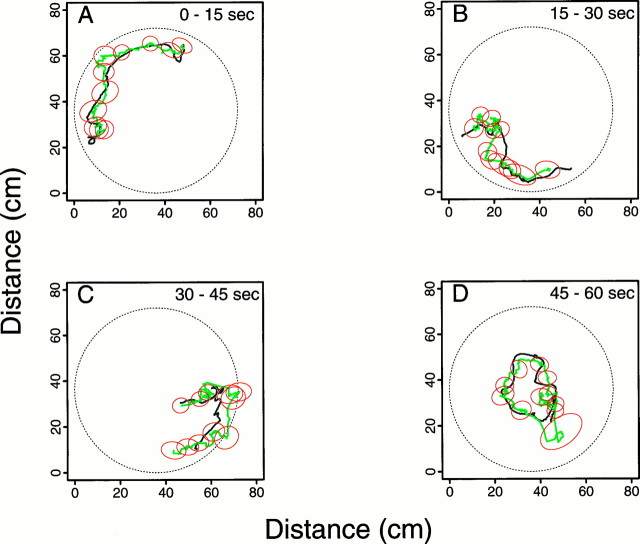
The problem of predicting the position of a freely foraging rat based on the ensemble firing patterns of place cells recorded from the CA1 region of its hippocampus is used to develop a two-stage statistical paradigm for neural spike train decoding. In the first, or encoding stage, place cell spiking activity is modeled as an inhomogeneous Poisson process whose instantaneous rate is a function of the animal's position in space and phase of its theta rhythm. The animal's path is modeled as a Gaussian random walk. In the second, or decoding stage, a Bayesian statistical paradigm is used to derive a nonlinear recursive causal filter algorithm for predicting the position of the animal from the place cell ensemble firing patterns. The algebra of the decoding algorithm defines an explicit map of the discrete spike trains into the position prediction. The confidence regions for the position predictions quantify spike train information in terms of the most probable locations of the animal given the ensemble firing pattern. Under our inhomogeneous Poisson model position was a three to five times stronger modulator of the place cell spiking activity than theta phase in an open circular environment. For animal 1 (2) the median decoding error based on 34 (33) place cells recorded during 10 min of foraging was 8.0 (7.7) cm. Our statistical paradigm provides a reliable approach for quantifying the spatial information in the ensemble place cell firing patterns and defines a generally applicable framework for studying information encoding in neural systems.


Figures

Fig. 1.
Fig. 1.
Pseudocolor maps of the fits of the inhomogeneous Poisson model to the place fields of three representative place cells from animal 2. The panels show A, a field lying along the border of the environment; B, a field near the center of the environment; and C, a split field with two distinct regions of maximal firing. Most of the place cells for both animals were like that of cell A (see Encoding stage: evaluation of the Poisson model fit to the place cell firing patterns). The color bars along the right border of each panel show the color map legend in spikes per second. The spike rate near the center of cell A is 25 spikes/sec compared with 12 spikes/sec for cells B and C. Each place field has a nonzero spike rate across a sizable fraction of the circular environment.
Fig. 2.
Fig. 2.
Histograms of p values for the goodness-of-fit analyses of the inhomogeneous Poisson model on the subpaths for the encoding (left column) and decoding (right column) stages for animals 1 and 2. Each place cell contributed 10–65 subpaths to the analysis. Each p value measures for its associated subpath how likely the number of spikes recorded on that subpath is under the Poisson model. The smaller thep value the more improbable the recorded number of spikes is given the Poisson model. If the recorded number of spikes on most of the subpaths are consistent with the Poisson model then, the histogram should be approximately uniform. The large numbers of subpaths whosep values are <0.05 for both animals in both the encoding and decoding stages prevent the four histograms shown here from being uniform. This suggests that the spike train data have extra-Poisson variation and that the current Poisson model does not describe all the structure in the place cell firing patterns.
Fig. 3.
Fig. 3.
Marginal probability densities estimated from the path increments, x(tk) − x(tk−1), during the encoding stage for animal 1 (A) and animal 2 (B). Thesolid line is the estimated Gaussian probability density of the increments computed from the random walk parameters of the x1 coordinate (x direction) increments for animal 1 (A) and the x2 (y direction) coordinate increments for animal 2 (B). The dotted line in each panel is the corresponding kernel density estimate of the increment marginal probability density computed by smoothing the histogram of path increments with a cosine kernel. The kernel methods provide model-free estimates of the true probability densities of the path increments. Although the Gaussian and corresponding kernel probability densities are both symmetric, and agree in their tails, the kernel density estimates have significantly more mass near their centers than predicted by the Gaussian random walk model. C, D, Partial autocorrelation functions of the x1 coordinate (x direction) path increments for animal 1 (C) and the x2 (y direction) coordinate increments for animal 2 (D). The x-axes in these plots are in units of increment lags, where 1 lag corresponds to 33 msec, the sampling rate of the path (frame rate of the camera). Thesolid horizontal lines are approximate 95% confidence bounds. The widths of these bounds are narrow and imperceptible because the number of increments used to estimate the partial autocorrelation function is large (27,000 for animal 1 and 23,400 for animal 2). Correlations following outside these bound are considered statistically significant. Animal 1 (2) has significant partial autocorrelations up to order 2 (4 or 5), suggesting strong serial dependence in the path increments. The significant spikes at lag 30 (∼1 sec) in both panels is from the path smoothing (see Evaluation of the random walk assumption).
Fig. 4.
Fig. 4.
A continuous 60 sec segment of the true path (black line) from animal 2 displayed in four 15 sec intervals along with the predicted paths (red line) from four decoding algorithms. Each column gives the results from the application of one decoding algorithm. The first column is the Bayes’ filter; the second column, the maximum likelihood algorithm (ML); the third column, the linear algorithm; and the fourth column, the maximum correlation procedure (MC). The rows show for each decoding algorithm the true and predicted paths for times 0–15 sec (row A), 15–30 sec (row B), 30–45 sec (row C), and 45–60 sec (row D). For example, third column, row B shows the true path and the linear algorithm prediction for times 15–30 sec. The paths are continuous between the rows within a column; e.g., where the paths end for the Bayes’ filter analysis (first column) at approximately coordinates x1(t) = 7 cm and x2(t) = 21 cm in row Ais where they begin in row B. Position predictions are determined at each of the 1800 (60 sec × 30 points/sec) points for each procedure with the exception of the MC algorithm. For the MC algorithm there are 60 predictions computed in nonoverlapping 1 sec intervals. None of the algorithms is constrained to give predictions within the circle. Because of the continuity constraint of the random walk, the Bayes’ filter predictions are less erratic than those of the non-Bayes algorithms.
Fig. 5.
Fig. 5.
Box and whisker plot summaries of the error distributions (histograms)—point-by-point distances between the true and predicted paths—for both animals for each of the six decoding methods. The bottom whisker cross-bar is at the minimum value of each distribution. The bottom border of the box is the 25th percentile of the distribution, and the top border is the 75th percentile. The white bar within the box is the median of distribution. The distance between the 25th and 75th percentiles is the interquartile range (IQR). The topwhisker is at 3 × IQR above the 75th percentile. All theblack bars above the upper whiskers are far outliers. For reference, <0.35% of the observations from a Gaussian distribution would lie beyond the 75th percentile plus 1.5 × IQR, and <0.01% of the observations from a Gaussian distribution would lie beyond the 75th percentile plus 3.0 × IQR. The box and whisker plots show that all the error distributions, with the possible exception of the MC error distribution for animal 1, are highly non-Gaussian with heavily right-skewed tails.
Fig. 6.
Fig. 6.
The continuous 60 sec segment of the true path (black line) for animal 2 and the predicted path (green line) for the Bayes’ filter in Fig. 4replotted along with 11 95% confidence regions (red ellipses) computed at position predictions spaced 1.5 sec apart. The confidence regions quantify the information content of the spike trains in terms of the most probable location of the animals at a given time point. Comparison of the predicted path and its confidence regions with the true path provides a measure of the accuracy of the decoding algorithm. The sizes of the confidence regions vary depending on the number of cells that fire, the shape of the true path, and the locations of the place fields (see Decoding stage: position prediction from place cell ensemble firing patterns).

Similar articles

Cited by

References

    1. Abbott LF. Decoding neuronal firing and modeling neural networks. Q Rev Biophys. 1994;27:291–331. - PubMed
    1. Bialek W, Zee A. Coding and computation with neural spike trains. J Stat Phys. 1990;59:103–115.
    1. Bialek W, Rieke F, de Ruyter van Steveninck RR, Warland D. Reading a neural code. Science. 1991;252:1854–1857. - PubMed
    1. Box GEP, Jenkins GM, Reinsel GC. Time series analysis: forecasting and control, Ed 3. Prentice Hall; Englewood Cliffs, NJ: 1994.
    1. Brown EN, Frank LM, Wilson MA. Statistical approaches to place field estimation and neuronal ensemble decoding. Soc Neurosci Abstr. 1996;22:910.

Publication types

LinkOut - more resources