. 1998 Sep 15;18(18):7519-34.
doi: 10.1523/JNEUROSCI.18-18-07519.1998.

Modulation of neuronal activity in superior colliculus by changes in target probability

Affiliations

Modulation of neuronal activity in superior colliculus by changes in target probability

M A Basso et al. J Neurosci. .

Abstract

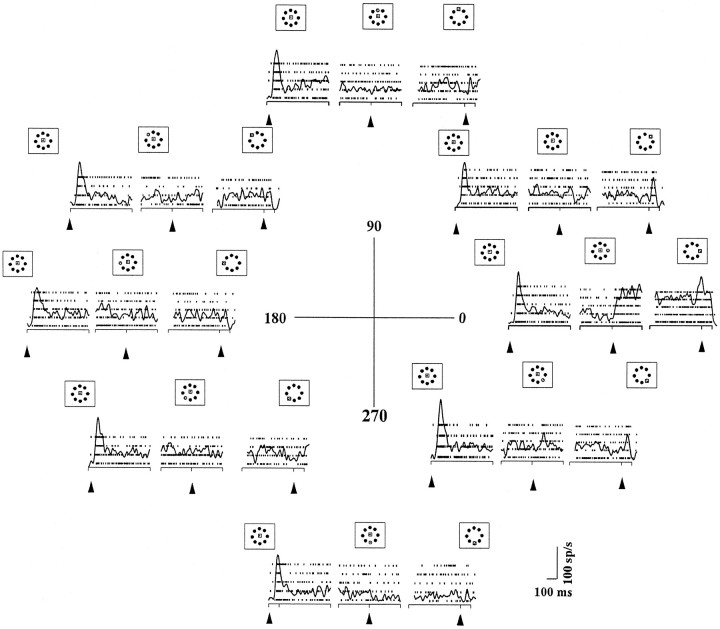
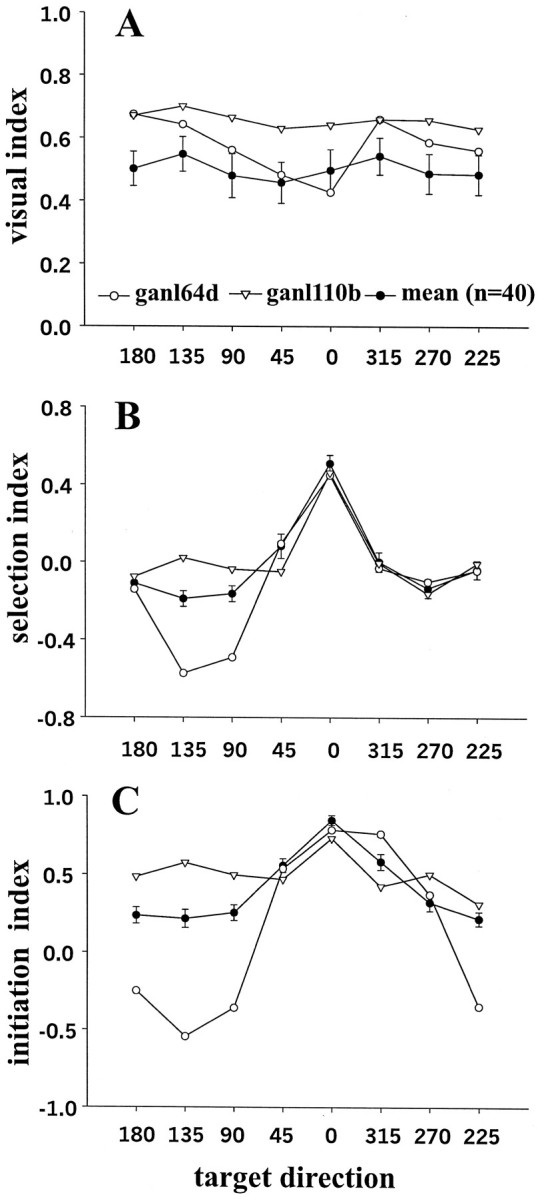
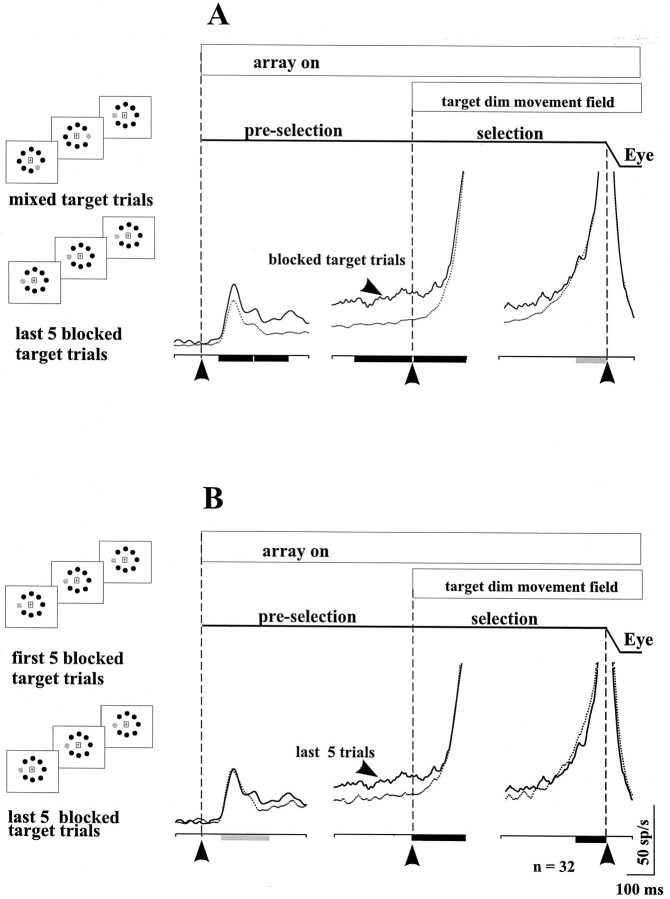
Complex visual scenes require that a target for an impending saccadic eye movement be selected from a larger number of possible targets. We investigated whether changing the probability that a visual stimulus would be selected as the target for a saccade altered activity of monkey superior colliculus (SC) neurons in two experiments. First, we changed the number of possible targets on each trial. Second, we kept the visual display constant and presented a single saccade target repeatedly so that target probability was established over time. Buildup neurons in the SC, those with delay period activity, showed a consistent reduction in activity as the probability of the saccade decreased, independent of the visual stimulus configuration. Other SC neurons, fixation and burst, were largely unaffected by the changes in saccade target probability. Because we had monkeys making saccades to many locations within the visual field, we could examine activity associated with saccades outside of the movement field of neurons. We found the activity of buildup neurons to be similar across the SC, before the target was identified, and reduced when the number of possible targets increased. The results of our experiments are consistent with a role for this activity in establishing a motor set. We found, consistent with this interpretation, that the activity of these neurons was predictive of the latency of a saccadic eye movement and not other saccade parameters such as end point or peak velocity.


Figures

Fig. 1.
Fig. 1.
A, Multi-target task. Along the top, the bars labeled “fixation,” “array on,” and “target dim” depict the temporal sequence of the multi-target task. The line below labeled “Eye” is a schematic of a representative eye position trace in this task. The lower portion of the figure depicts the spatial arrangement of the trial types. The large boxes are a schematic of the tangent screen. Thecross represents the fixation point, and the surroundingbox represents the criterion window for the monkeys to maintain eye position for correct task performance. Each of these trial types was randomly interleaved. As the number of possible targets (filled circles) increased, the probability that any one of them would be identified as the saccade target decreased. The fixation period began with the onset of a fixation point, followed by the pre-selection period when the array of possible stimuli came on. The selection period was the time when the target dimmed, and the initiation period was the time when the monkeys were given a cue to initiate the saccade, in this case, when the fixation point was removed. The temporal separation of events allowed the neuronal activity associated with each event to be dissociated.B, The blocked-mixed task. Along the top, the labeled bars indicate the temporal sequence of events in the task. Mixed target trials were those in which the saccade target was selected randomly on each trial from the eight stimuli. The blocked target trials were those in which the saccade target was always the one located in the movement field of the recorded neuron. Note that the time the target dimmed and the time the fixation point was removed occurred simultaneously, allowing the saccade to be initiated as soon as the target was selected.
Fig. 2.
Fig. 2.
Decreased target probability reduced buildup neuron activity. The events of the task are indicated by the labeled periods across the top, and the spatial arrangement is indicated by the schematic of the tangent screen as drawn in Figure 1. The eye position trace is a schematic. This example is from trials when the stimulus that fell in the movement field of the neuron was identified as the target. The left columnshows rasters and the average spike density function for five trials during the pre-selection period when one (A), two (B), four (C), or eight (D) possible targets were presented. Thearrowheads and the vertical dashed linesindicate the alignment of the traces. The left column is aligned on the onset of the possible targets, and themiddle column is aligned on the beginning of the selection period, when one of the stimuli dimmed. Both the initial visual and the delay period responses decreased as the number of stimuli increased. Activity increased after the stimulus in the movement field dimmed, indicating it was the target (dashed vertical line in the middle column). Theright column is aligned on the onset of the saccade, the initiation period. This neuron had a burst of action potentials associated with the onset of the saccade that did not differ between the probability conditions.
Fig. 3.
Fig. 3.
The activity across the sample of buildup neurons showed a reduction of activity with decreased target probability. Thetraces show the mean spike density function of the 40 neurons for each target probability condition when the target was in the center of the movement field of each neuron. The alignments are identical to that in Figure 2. Black bars indicate a statistically significant difference between the conditions for the measurement intervals. Gray bars indicate no significant difference. The visual interval was the first 150 msec after the minimal visual latency of SC neurons of 50 msec (Goldberg and Wurtz, 1972a). The early pre-selection interval was 150 msec after the visual interval. The late pre-selection interval was the 200 msec before the target dimmed, and the early pre-selection interval was the 200 msec after the target dimmed. The late selection interval was the 100 msec before the fixation point was extinguished. The initiation interval was the 100 msec before the saccade began.
Fig. 4.
Fig. 4.
The average firing rate for the 40 neurons in each of the four target probability conditions during the visual interval is plotted. The visual interval was divided into two intervals, an initial 50 msec (black bars) and a later 100 msec (gray bars). The initial 50 msec interval was measured with respect to the onset of the burst for each individual neuron using a Poisson burst detection algorithm (Hanes et al., 1995). Both components of the initial response time locked to the onset of the visual stimulus showed a decrement in activity with increased target probability.
Fig. 5.
Fig. 5.
Activity of a buildup neuron during the presentation of all eight targets. Each trace in each of the eight sets of three plots is aligned on the same events described in the Figure 2 legend. The leftmost plots are aligned on stimulus onset, the middle plots are aligned on target dimming, and the rightmost plots are aligned on saccade onset. Each set of threeplots is in the location where the target appeared on the screen. The movement field is rotated so that the center is in the 0° location.
Fig. 6.
Fig. 6.
Selectivity indices for the sample of 40 buildup neurons. Neural activity is plotted as a function of target direction. The center of the movement field is normalized to the 0° location for all the neurons. A, The visual index shows the neural activity during the visual interval (150 msec after a visual latency of 50 msec) minus 200 msec of baseline neural activity (during the fixation interval before the stimuli appeared) divided by the sum of the two activities. B, The selection index is the neural activity 400 msec after the target dimmed minus the neural activity 400 msec before the target dimmed divided by the sum of both activities.C, The initiation index is the neural activity 100 msec before the onset of the saccade (initiation interval) minus the 200 msec of baseline activity divided by the sum of the two activities. Shown are the results from two example neurons (▿ and ○) as well as the result for the mean (•). The neuron indicated by the (○) shows an inhibition of activity for adjacent targets after the target dimmed as well as just before the saccade.
Fig. 7.
Fig. 7.
Comparison of neuronal activity related to a target in the movement field and in the opposite visual field. Theplot shows the mean (black lines) and the unidirectional SE (gray shading) of the neuronal activity for the sample of 40 neurons. The arrangement and alignments are the same as in Figure 3. A, Thetraces from the two possible target condition trials in which the stimulus in the movement field was identified as the saccade target and in which the stimulus in the ipsilateral visual field was the saccade target are superimposed. B, The same conditions described in A apply except the trials are from the eight possible target condition. The black barsunder the plots indicate statistically significant differences in the intervals of activity between the movement field and opposite target trials. The gray bars indicate a lack of statistical significance. The horizontal dotted reference line in A and B indicates the mean activity in the late pre-selection interval in the two possible target condition (27 sp/sec). The reference line shows that the activity after the target dimmed in the movement field was virtually identical in the two and eight possible target conditions and that the neurons did not reduce their activity after the opposite target was identified for selection.
Fig. 8.
Fig. 8.
Burst neurons and saccade target probability.A, The arrangement and alignment of this figure are the same as in Figure 3. The mean spike density function of the 12 burst neurons in each target condition is plotted. Black bars indicate a statistically significant difference between the conditions for the different intervals. Gray barsindicate no significant difference. The quantification intervals are the same as in Figure 3.
Fig. 9.
Fig. 9.
Comparison of the activity of buildup neurons in the blocked-mixed task (A) and the multi-target task (B). A, Comparison of the neuronal activity in the mixed- (first row) and blocked- (second two rows) target trials. The blocked target trials are divided into the first and last set of 20 trials in a series of 100 blocked trials. The spatial arrangement of this task is depicted to the left of the rasters and spike density functions. The effect of the changing target probability was evident in the pre-selection period in both the multi-target task (B) and the blocked-mixed task (A). Because in both tasks for the recording of these neurons the target dim and the fixation point offset occurred simultaneously, monkeys could initiate the saccade as soon as the target dimmed. Therefore, after the target identification, there remained some difference in activity between the blocked and mixed conditions. The activity in the late pre-selection period between the first 20/100 and the last 20/100 trials in the blocked condition suggests a reflection of the learning of the saccade goal by the monkeys. B, The neuronal activity in the multi-target task with one possible target presented, shown by the first row of rasters and spike density functions. The figure is arranged the same as Figure 3. Note that for the experiments comparing the multi-target and the blocked-mixed tasks, we modified the timing of the multi-target task so that the fixation point offset and the target dim occurred simultaneously, as they did in the blocked-mixed task. Thetraces are aligned on the array onset (first column), target dim and fixation point offset (middle column), and the saccade onset (last column). The vertical dashed linesand the arrowheads at the bottom of the figure indicate the alignment.
Fig. 10.
Fig. 10.
Comparison of the activity of the buildup neurons in the blocked-mixed task conditions. A, The mean spike density function for each of the 32 neurons is plotted in each condition for the mixed target trials (dotted line) and the last five blocked target trials (solid line).B, The mean spike density function for each of the 32 neurons is plotted for the first five trials (dotted line) and the last five trials (solid line) in the blocked condition. Consistent with the change in the saccade latency, the activity of neurons was greater as the monkeys repeated the same saccade on every trial.
Fig. 11.
Fig. 11.
Comparison of one and eight stimulus conditions when target probability was the same. The data from the 19 neurons recorded in both the multi-target task and the blocked-mixed task are plotted to compare activity in the single stimulus, single target condition with that in the eight stimuli, single target condition (see Results). A, The mean firing rate during the visual interval in the single target case is plotted against the mean firing rate in the blocked target. B, The same activity is plotted for the pre-selection interval data. C, The same is plotted for the initiation interval. In the visual interval, many neurons fell above the line, showing greater activity when only a single stimulus was present and indicating an effect of the stimulus display. Most neurons fell around the unity line in both the pre-selection and the initiation intervals.

Similar articles

Cited by

References

    1. Andersen RA, Snyder LH, Bradley DC, Xing J. Multimodal representation of space in the posterior parietal cortex and its use in planning movements. Annu Rev Neurosci. 1997;20:303–330. - PubMed
    1. Basso MA, Wurtz RH. Modulation of neuronal activity by target uncertainty. Nature. 1997;389:66–69. - PubMed
    1. Becker W, Jürgens R. An analysis of the saccadic system by means of double step stimuli. Vision Res. 1979;19:967–983. - PubMed
    1. Bravo MJ, Nakayama K. The role of attention in different visual-search tasks. Percept Psychophys. 1992;51:465–472. - PubMed
    1. Britten KH, Shadlen MN, Newsome WT, Movshon JA. The analysis of visual motion: a comparison of neuronal and psychophysical performance. J Neurosci. 1992;12:4745–4765. - PMC - PubMed

LinkOut - more resources