. 1998 Sep 15;95(19):11158-62.
doi: 10.1073/pnas.95.19.11158.

Clustering of low-energy conformations near the native structures of small proteins

Affiliations

Clustering of low-energy conformations near the native structures of small proteins

D Shortle et al. Proc Natl Acad Sci U S A. .

Abstract

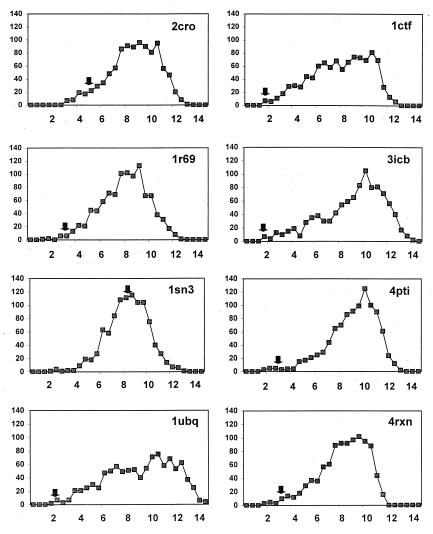
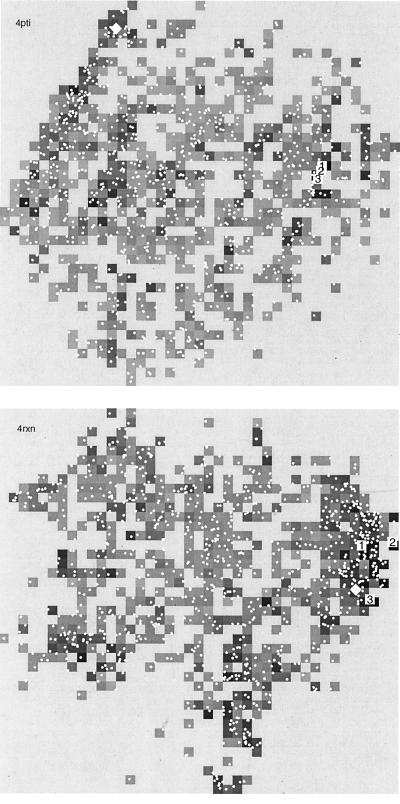
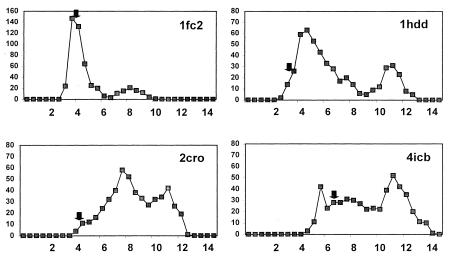
Recent experimental studies of the denatured state and theoretical analyses of the folding landscape suggest that there are a large multiplicity of low-energy, partially folded conformations near the native state. In this report, we describe a strategy for predicting protein structure based on the working hypothesis that there are a greater number of low-energy conformations surrounding the correct fold than there are surrounding low-energy incorrect folds. To test this idea, 12 ensembles of 500 to 1,000 low-energy structures for 10 small proteins were analyzed by calculating the rms deviation of the Calpha coordinates between each conformation and every other conformation in the ensemble. In all 12 cases, the conformation with the greatest number of conformations within 4-A rms deviation was closer to the native structure than were the majority of conformations in the ensemble, and in most cases it was among the closest 1 to 5%. These results suggest that, to fold efficiently and retain robustness to changes in amino acid sequence, proteins may have evolved a native structure situated within a broad basin of low-energy conformations, a feature which could facilitate the prediction of protein structure at low resolution.


Figures

Figure 1
Figure 1
Schematic diagram of a hypothetical folding energy landscape. The x axis corresponds to a generalized structure coordinate (17, 26). The solid line corresponds to the internal free energy (17), and the dashed line corresponds to the value of a database-derived scoring function such as the one used in this work. The scoring function follows the true potential because it is sensitive to hydrophobic burial but produces noise and fails to detect the sharp drop in energy of the native state because of inaccuracies in quantifying hydrogen bonds, electrostatic, and van der Waals interactions. However, the scoring function is able to detect the higher density of low-energy states in the broad region surrounding the native state.
Figure 2
Figure 2
Histograms of the rmsd (Cα coordinates) from the native state to members of each of the Park–Levitt sets. An arrow marks the position of the center of the largest cluster of conformations by using a 4-Å rmsd cutoff. The bin intervals along the x axis are in 0.5-Å increments.
Figure 3
Figure 3
Multidimensional scaling maps of the ensemble of conformations in the Park–Levitt sets of conformations for 4pti (Upper) and 4rxn (Lower). The distance in rmsd between each pair of conformations is projected onto two dimensions, retaining relative distance relationships so that two structurally similar conformations tend to be located near each other. The position of each conformation is indicated by a small white dot. The position of the native state is marked with a white diamond, and the three conformations with three lowest (best) energy scores are marked with white boxes. The gray scale value of each pixel is determined by the lowest energy conformation within that small region of the map, with black being the very lowest energies.
Figure 4
Figure 4
Histograms of the rmsd (Cα coordinates) from the native state to members of each of the Simons sets. An arrow marks the position of the center of the largest cluster of conformations by using a 4-Å rmsd cutoff. The bin intervals along the x axis are in 0.5-Å increments.

References

    1. Anfinsen C B. Science. 1973;181:223–230. - PubMed
    1. Tanford C. Adv Protein Chem. 1968;23:121–282. - PubMed
    1. Tanford C. Adv Protein Chem. 1970;24:1–95. - PubMed
    1. Shortle D. FASEB J. 1996;10:27–34. - PubMed
    1. Dill K A, Shortle D. Annu Rev Biochem. 1991;60:795–825. - PubMed

Publication types

LinkOut - more resources