. 1998 Sep 15;95(19):11348-53.
doi: 10.1073/pnas.95.19.11348.

Regulatory dysfunction of the interleukin-2 receptor during HIV infection and the impact of triple combination therapy

Affiliations

Regulatory dysfunction of the interleukin-2 receptor during HIV infection and the impact of triple combination therapy

D David et al. Proc Natl Acad Sci U S A. .

Abstract

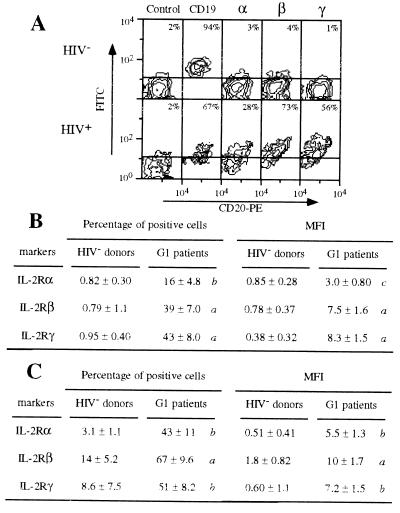
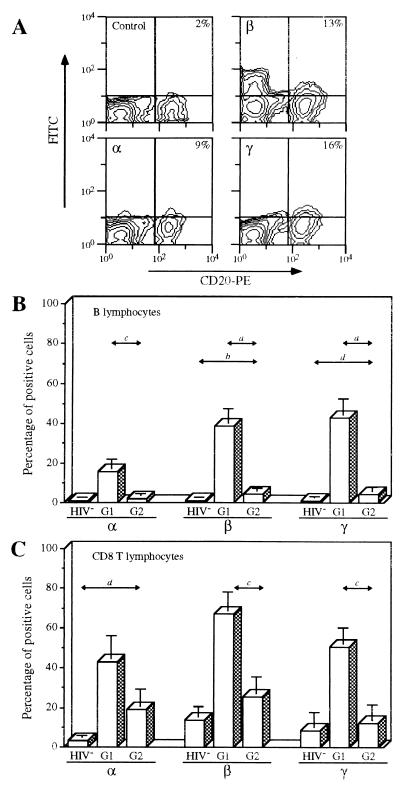
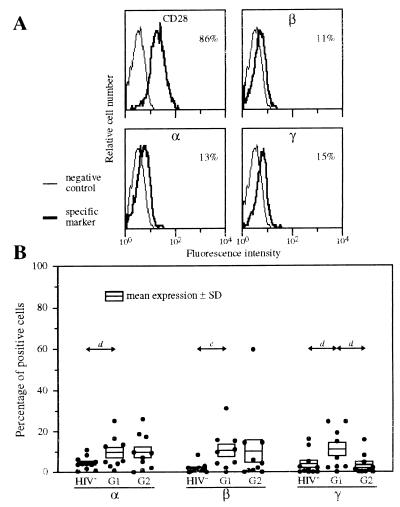
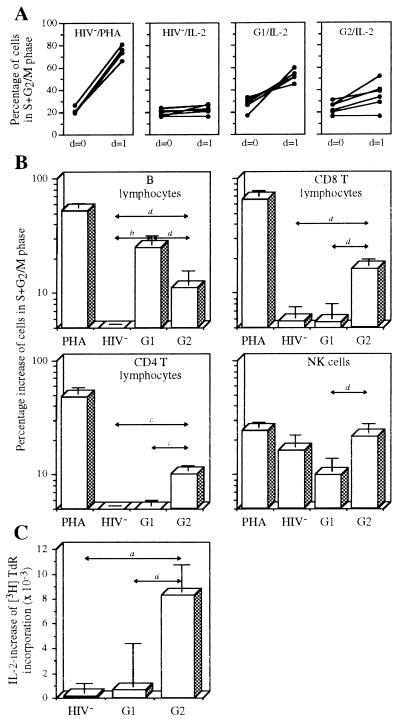
The interleukin-2 (IL-2)/IL-2 receptor (IL-2R) system is the main regulatory determinant of T cell reactivity. Although it is well known that IL-2 secretion is impaired during HIV infection, up to now IL-2R expression has not been extensively studied in HIV-infected patients despite the use of IL-2 in clinical therapy trials. We show here that IL-2R expression in HIV patients with high viral load (group 1 in the study) is greatly enhanced on B lymphocytes, CD8 T lymphocytes, and monocytes, but not on CD4 T lymphocytes, compared with noninfected individuals. Paradoxically, this modified IL-2R expression does not lead to increased IL-2 responsiveness, except for B lymphocytes. In patients receiving triple combination therapy (TCT, two reverse transcriptase inhibitors and one protease inhibitor) that has triggered a drastic reduction in plasma viral load and an increase in CD4 counts (group 2 patients), IL-2R expression is significantly lower than in group 1 patients. Moreover, cells involved in cellular immunity and CD4 T lymphocytes have the capacity to respond to IL-2 after TCT. These results allow us to anticipate a beneficial role of IL-2 immunotherapy in combination with TCT.


Figures

Figure 1
Figure 1
Expression of IL-2Rα, IL-2Rβ, and IL-2Rγ by B and CD8 T lymphocytes of group 1 patients (high viral load). (A) IL-2R expression by B lymphocytes of a representative healthy donor (HIV) and of a representative group 1 HIV-infected patient (HIV+). PBMC were treated by mAbs 33B3 (anti-IL-2Rα), CF1 (anti-IL-2Rβ), 3B5 (anti-IL-2Rγ), and isotype-matched controls. FITC-labeled Fab fragment anti-IgG was used, followed by PE-conjugated anti-CD20 + TC-conjugated anti-CD14 mAbs. Only the two FL2-positive squares—i.e., CD20-positive cells—are shown. The percentage of B lymphocytes located above (FL1 scale) the quadrant settings is indicated. Markers used for FL1 scale are shown on the top. (B) Expression of IL-2R chains by B lymphocytes from healthy donors (HIV donors, n = 14) and from group 1 patients (G1 patients, n = 10). Expression is indicated by the mean percent (±SD) of B lymphocytes positive for the IL-2R chains and by the MFI (±SD) of the B lymphocytes. P values (nonpaired Student’s t test) are shown as follows: a, P ≤ 0.0001; b, 0.0001 < P ≤ 0.001; c, 0.001 < P ≤ 0.01; and d, 0.01 < P < 0.05. P values of ≥ 0.05 are not shown (indicated as NS in Table 1). (C) Expression of IL-2R chains by CD8 T lymphocytes from healthy donors (HIV donors, n = 12) and from group 1 patients (G1 patients, n = 10). Expression is indicated by the mean percent (±SD) positive cells and by the MFI (±SD) of the population. P values are indicated as in B.
Figure 2
Figure 2
Expression of IL-2Rα, IL-2Rβ, and IL-2Rγ by B and CD8 T lymphocytes of HIV-infected patients treated with TCT (group 2); labeling and analysis of the cells were performed as described in the legend of Fig. 1. (A) IL-2R expression by B lymphocytes of a representative patient receiving TCT (group 2). (B) Mean expression (±SD) of IL-2R by B lymphocytes of the three groups of individuals: healthy donors (HIV, n = 14), group 1 patients (G1, n = 10), and group 2 (TCT) patients (G2, n = 12). P values are indicated as in Fig. 1. (C) Mean expression (±SD) of IL-2R by CD8 lymphocytes of the three groups of individuals: healthy donors (HIV, n = 12), group 1 patients (G1, n = 10), and group 2 patients (G2, n = 12). P values are indicated as in Fig. 1.
Figure 3
Figure 3
Expression of IL-2Rα, IL-2Rβ, and IL-2Rγ by CD4 T lymphocytes of HIV-infected patients. PBMC were treated by mAbs 33B3, CF1, 3B5, or IOT28 (anti-CD28). Characterization of the population was achieved by treatment with anti-CD3 mAb (data not shown). FITC-labeled Fab fragment anti-IgG was used, followed by PE-conjugated anti-CD4 + TC-conjugated anti-CD14 mAbs. (A) IL-2R expression of a representative group 1 patient. The percentage of CD4 T lymphocytes positive for the different IL-2R chains is indicated. (B) Expression of IL-2Rα, IL-2Rβ, and IL-2Rγ by CD4 T lymphocytes of healthy donors (HIV, n = 11), group 1 patients (G1, n = 9), and group 2 (TCT) patients (G2, n = 10). Mean numbers of positive cells (±SD) are shown. P values are indicated as in Fig. 1.
Figure 4
Figure 4
IL-2 response of the different PBMC subsets. (A) Response of B lymphocytes. Cells from healthy donors were stimulated by PHA (HIV/PHA) or IL-2 (HIV/IL-2). Cells from group 1 patients (G1/IL-2) and from group 2 (TCT) patients (G2/IL-2) were stimulated by IL-2. Percentage of cells in S+G2/M phase before (day 0) and after (day 1) stimulation are shown for each individual. (B) Responses of B lymphocytes, CD8 T lymphocytes, CD4 T lymphocytes, and NK cells. The four conditions shown in A were studied. Mean percentage of cells in S+G2/M phase after overnight stimulation with PHA or IL-2 are shown (HIV, n = 7; G1, n = 10; G2, n = 10). Background obtained with unstimulated cells is removed. P values are indicated as in Fig. 1. (C) PBMC proliferation. PBMC (5 104 per well) were cultured in 96-well flat-bottom plates in a total volume of 200 μl of RPMI 1640 medium with PHA (5 μg/ml) and PHA + IL-2 (5 × 10⁻⁸ M). After 2 days, cultures were pulsed for 18 h with 1 μCi (1 Ci = 37 GBq) of [3H]thymidine, and incorporated radioactivity was measured. Variation of incorporated radioactivity between PHA+IL-2 and PHA alone is shown for healthy donors (HIV, n = 18), group 1 patients (G1, n = 6), and group 2 patients (G2, n = 5). P values are indicated as in Fig. 1.

Similar articles

Cited by

References

    1. Smith K A. Science. 1988;240:1169–1176. - PubMed
    1. Bani L, David D, Moreau J-L, Cayota A, Nakarai T, Ritz J, Thèze J. Int Immunol. 1997;9:573–580. - PubMed
    1. Caligiuri M A, Zmuidzinas A, Manley T J, Levine H, Smith K A, Ritz J. J Exp Med. 1990;171:1509–1526. - PMC - PubMed
    1. Anderson T D. In: Structure and Function of Interleukin-2. Kunkel S L, Remick D G, editors. New York: Dekker; 1992. pp. 27–60.
    1. Moreau J-L, Chastagner P, Tanaka T, Miyasaka M, Kondo M, Sugamura K, Thèze J. J Immunol. 1995;155:3401–3408. - PubMed

Publication types

MeSH terms