. 1998 Oct 1;18(19):7650-61.
doi: 10.1523/JNEUROSCI.18-19-07650.1998.

Macroscopic and microscopic properties of a cloned glutamate transporter/chloride channel

Affiliations

Macroscopic and microscopic properties of a cloned glutamate transporter/chloride channel

J I Wadiche et al. J Neurosci. .

Abstract

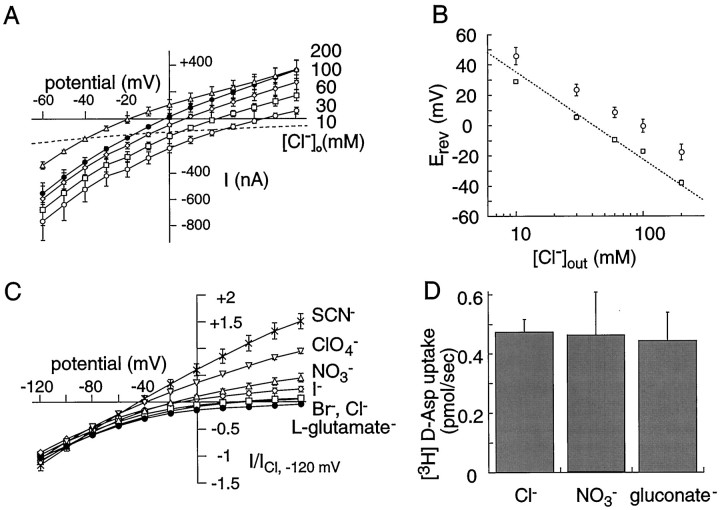
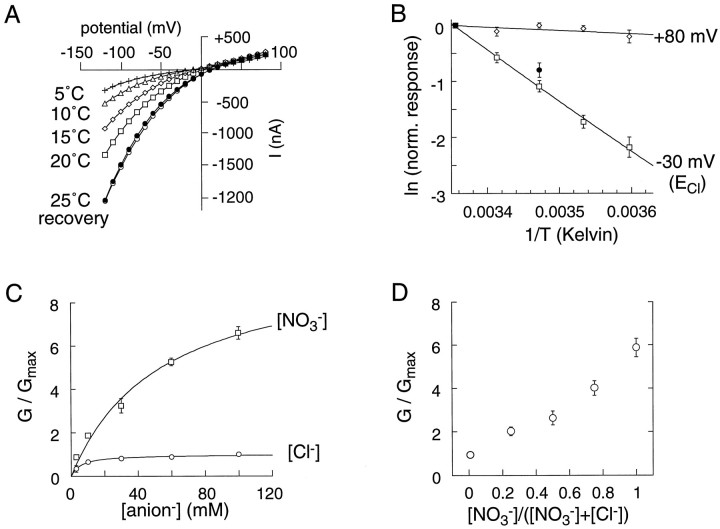
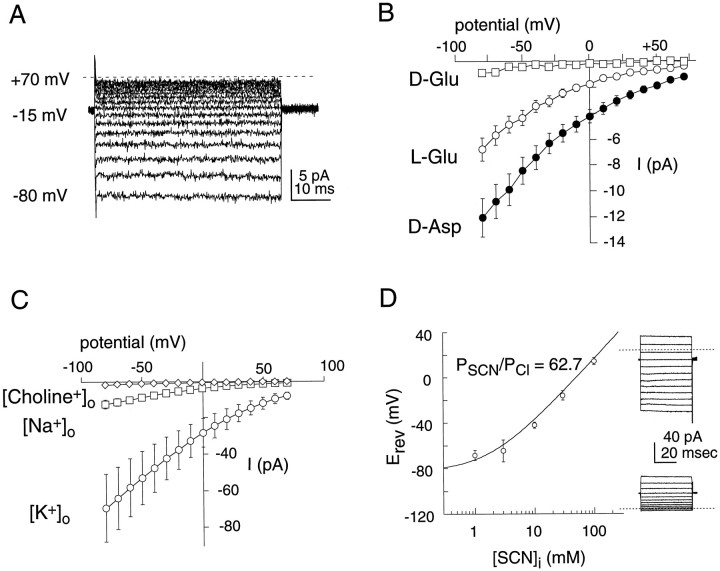
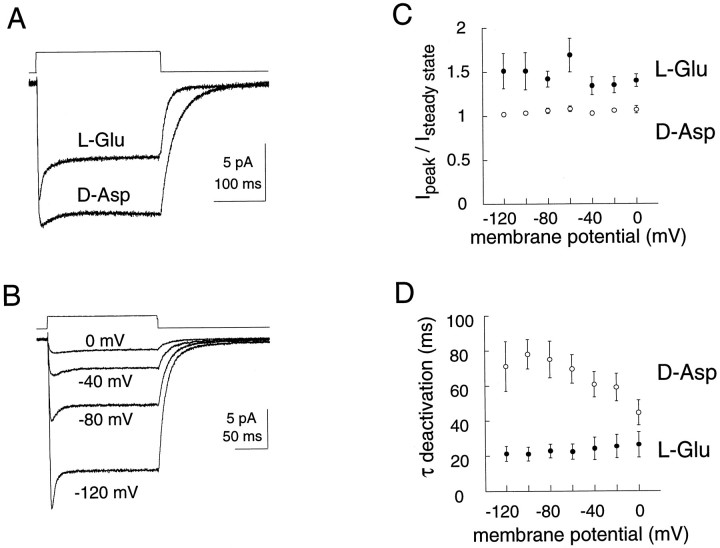
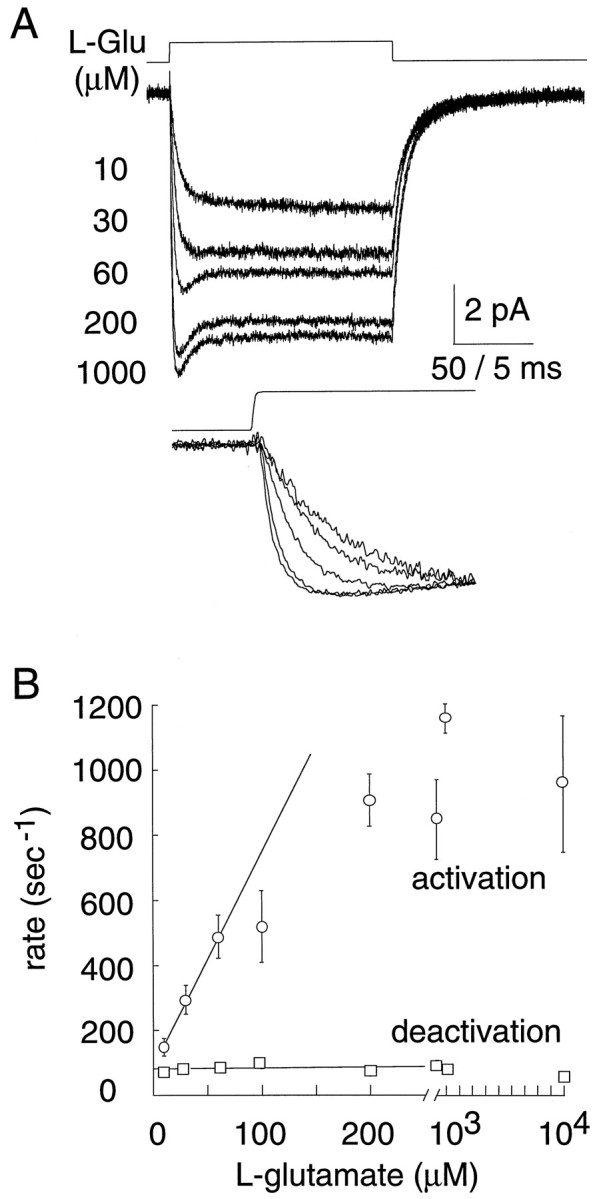
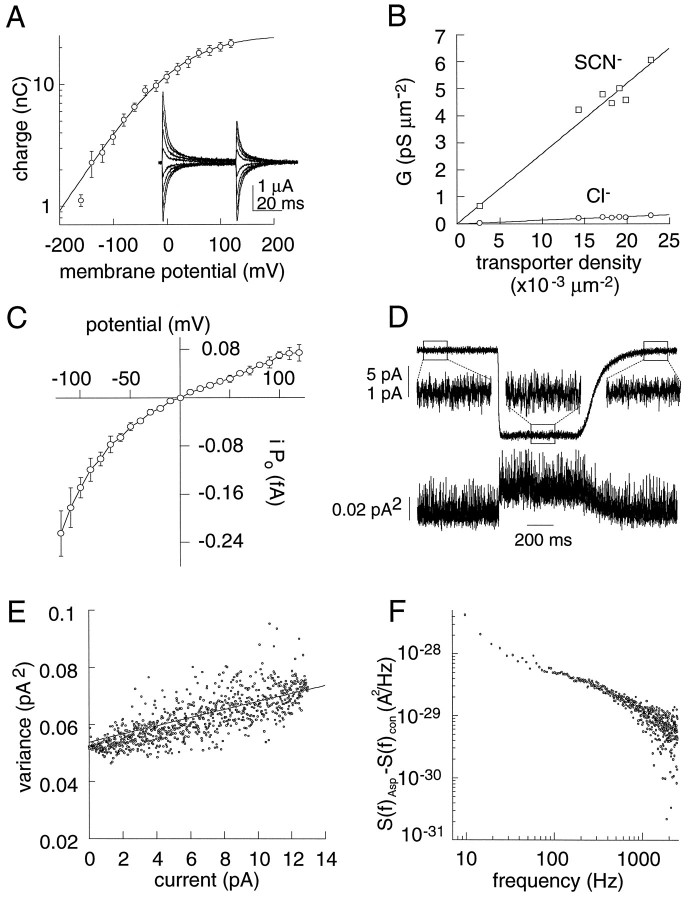
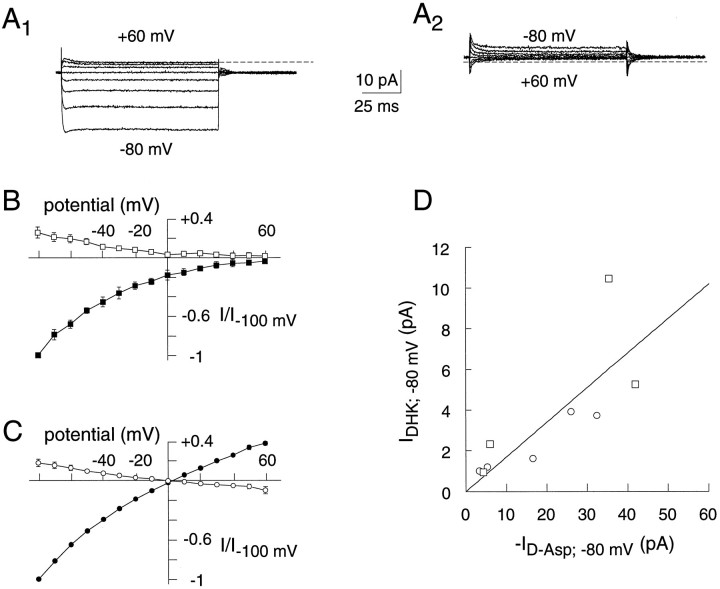
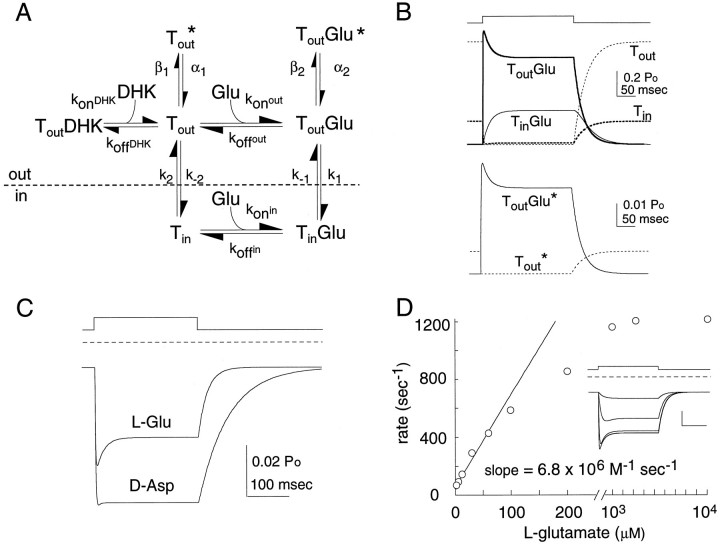
The behavior of a Cl- channel associated with a glutamate transporter was studied using intracellular and patch recording techniques in Xenopus oocytes injected with human EAAT1 cRNA. Channels could be activated by application of glutamate to either face of excised membrane patches. The channel exhibited strong selectivity for amphipathic anions and had a minimum pore diameter of approximately 5A. Glutamate flux exhibited a much greater temperature dependence than Cl- flux. Stationary and nonstationary noise analysis was consistent with a sub-femtosiemen Cl- conductance and a maximum channel Po << 1. The glutamate binding rate was similar to estimates for receptor binding. After glutamate binding, channels activated rapidly followed by a relaxation phase. Differences in the macroscopic kinetics of channels activated by concentration jumps of L-glutamate or D-aspartate were correlated with differences in uptake kinetics, indicating a close correspondence of channel gating to state transitions in the transporter cycle.


Figures

Fig. 1.
Fig. 1.
Two currents are mediated by EAAT1.A, Average currents induced by 100 μmd-aspartate application on oocytes expressing EAAT1 with recording solutions containing various Clconcentrations (○, 10 mm; ■, 30 mm; ⋄, 60 mm; •, 100 mm; ▵, 200 mm). Thedashed line corresponds to the predicted coupled uptake current for this group of cells. It represents the mean of exponential fits (e-fold, 89.7 ± 16.4 mV; n = 5) through current values at the respective chloride equilibrium potentials. Recording solutions were standard Ringer’s solutions with gluconate substitution for Cl to obtain the indicated chloride concentration. Tris-Cl (100 mm) was added to the solutions in experiments with Cl = 200 mm. The equilibrium potential for chloride is +35, +8, −10, −22, and −39 mV in 10, 30, 60, 100, and 200 mmexternal chloride, respectively. B, The reversal potential of the net current (○,Itotal) and the chloride-dependent current (■, Ichloride) induced by 100 μmd-aspartate are dependent on [Cl]out. The reversal potentials of the chloride-dependent current (IChloride) were obtained from current–voltage relationships after the calculated uptake current was subtracted from the total d-aspartate currents (Itotal). The dashed line represents the predicted Nernst equilibrium potential for chloride assuming [Cl]in = 41 mm (see Materials and Methods). C, Normalized anion-specific currents activated by 100 μmd-aspartate in oocytes expressing EAAT1. Recording solutions contained 10 mm Na salts of various test anions (×, SCN; ▿, ClO4; ▵, NO3; ⋄, I; ■, Br; ○, Cl) plus gluconate substitution to obtain 90 mm Na+, 1.8 mm Ca2+, 1 mmMg2+, and 2 mm K+. The average steady-state currents were obtained by subtraction of control currents from the corresponding d-aspartate (100 μm) currents and normalized to a test dose ofd-aspartate in Ringer’s solution. Current records with glutamate as a test anion (•) represent records in 100 mmNa gluconate subtracted from 100 mm Nal-glutamate; this current did not reverse up to +80 mV.D, Radiolabeled d-aspartate uptake from oocytes expressing EAAT1 measured under voltage clamp (Vm = −50 mV) with the indicated anion substitution (0.47 ± 0.04, 0.46 ± 0.15, and 0.44 ± 0.10 pmol/sec for Cl, NO3, and gluconate, respectively; n = 4–7).
Fig. 2.
Fig. 2.
EAAT1 anion conductance properties.A, d-Aspartate (1 mm)-dependent current–voltage relationship for a representative oocyte expressing EAAT1 at several bath temperatures (recording solution is Ringer’s solution). B, Arrehnius plot of normalized currents mediated by EAAT1. The temperature coefficients (Q10) between 10 and 20°C are 0.96 ± 0.1 and 3.2 ± 0.2 at +80 mV (⋄) and −30 mV (■,ECl), respectively. TheQ10 for the normalized radiolabeled uptake performed under voltage clamp (−60 mV) was 2.9 (•).C, Concentration dependence of the anion-specific chord conductance (+60 mV) activated by application ofd-aspartate (100 μm). Conductances were normalized to the maximum Cl chord conductance. The apparent EC50 values are 54 ± 5.4 and 5.5 ± 1.6 mm for NO3 and Cl, respectively (n = 4).D, Lack of anomalous mole fraction behavior [(NO3) + (Cl) = 3 mm] for the anion chord conductance (+60 mV) in cells expressing EAAT1 (n = 3–4).
Fig. 3.
Fig. 3.
Reverse transport currents in inside-out patches.A, Currents in a representative inside-out patch from an EAAT1 oocyte. The currents were obtained by subtraction of control currents from corresponding currents in the presence of 3 mmd-aspartate (Vm = +70 and −80 mV). Pipette solution contained 100 mm KCl, 3 mm MgCl2, 5 mm HEPES, pH 7.45, and bath solution contained 100 mm NaSCN, 3 mm MgCl2, 10 mm EGTA, and 5 mm HEPES, pH 7.45. B, Voltage dependence of EAAT1-mediated currents (n = 3 patches) induced by application of d-glutamate (■, 3 mm),l-glutamate (○, 3 mm), andd-aspartate (•, 3 mm). Recording solutions were the same as in A. C, Effect of the external (trans) ion on the steady-stated-aspartate (3 mm)-induced currents. Excised inside-out patch currents from EAAT1-expressing oocytes were recorded with pipettes containing 110 mm choline chloride (⋄; n = 6), NaCl (■; n = 4), or KCl (n = 7) plus 3 mmMgCl2 and 5 mm HEPES, pH 7.4. Bath solutions contained 100 mm NaSCN, 10 mm NaCl, 3 mm MgCl2, 10 mm EGTA, and 5 mm HEPES, pH 7.4. D, Relative permeability of SCN/Cl in EAAT1 inside-out patches. Pipettes contained 50 mm KSCN/56 mm KCl. The mean reversal potentials for patches (n = 3–9) are plotted as a function of the internal SCN concentration. The drawn curve corresponds to nonlinear least squares fit to the functionErev = RT/zFln((PSCN[SCN]o +PCl[Cl]o)/(PSCN[SCN]i+ PCl[Cl]i)) and results in aPSCN/PClof 62.7. Representative d-aspartate currents in response to voltage jumps in different [SCN]in (30 and 3 mm) are shown to the right (dotted line represents zero current).
Fig. 4.
Fig. 4.
Macroscopic outside-out patch kinetics.A, Rapid application of 10 mmd-aspartate and l-glutamate to a representative outside-out patch from an oocyte expressing EAAT1 (Vm = −80 mV). The pipette solution contained 100 mm KSCN, 10 mm KCl, 3 mm MgCl2, 5 mm HEPES, and 10 mm EGTA, pH 7.5, whereas the external recording solutions contained 110 mm NaCl, 3 mmMgCl2, 5 mm HEPES, and 100 μm LaCl3. The application of excitatory amino acids was delivered via flow pipes attached to a piezo-electric device. After the patch was ruptured, the solution exchange time was tested by switching between solutions of different osmolarities. The open tip controls ordinarily had 10–90% rise and decay times of 350 μsec (shown above current traces). B, Rapid application of l-glutamate (10 mm) to a representative outside-out patch expressing EAAT1 at the indicated holding potentials. Open tip control is shown above current traces.C, Voltage dependence of the peak to steady-state current for l-glutamate (•, 10 mm) ord-aspartate (○, 10 mm). D, Voltage dependence of current deactivation time constant (single exponential) for l-glutamate (•, 10 mm) ord-aspartate (○, 10 mm). Only patches with open tip controls of <500 μsec were used for analysis (10–90% rise and decay times).
Fig. 5.
Fig. 5.
[l-Glutamate] dependence of currents. A, Rapid exchange of variousl-glutamate concentrations to a representative EAAT1 expressing outside-out patch. Inset, Normalized currents emphasize the concentration dependence of the current activation rate.Vm = −80 mV. Open tip solution exchange control is shown above current traces (10–90% rise = 250 μsec). B, Concentration dependence of the time constant (single exponential) for activation and deactivation ofl-glutamate currents (−80 mV; n = 8). The limiting slope for the activation time constants equals 6.8 × 10⁶m−1sec−1.
Fig. 6.
Fig. 6.
EAAT1 unitary current properties.A, Semi-log plot of the charge movements for a group of cells expressing EAAT1 (Qmax = 26.3 ± 1.2 nC). The data were fit to a Boltzmann function with aV0.5 = −12.1 ± 3 mV and slope factor 74.3 ± 2 mV (zδ =RT/F * 74.3 = 0.34). The DHK concentration dependence of the normalized charge movements (EC50 for DHK block) is 1.43 ± 0.24 mm(data not shown, n = 4). Inset, Subtracted current record showing the voltage dependence of transient currents blocked by 10 mm DHK. Voltage command pulses in 40 mV increments (+120 mV to −160 mV). B, Correlation of transporter density with the d-aspartate-elicited anion conductance per unit area (0 mV; ■, SCN; ○, Cl). The number of transporters was calculated by dividing the charge blocked because of a saturating concentration of DHK by the product of the Boltzmann function’s effective valance and the elementary charge (n =Qtotal/eozδ = 1.6 × 10−19 * 0.34). The anion conductance in chloride (0 mV) was calculated by first subtracting thed-aspartate-coupled transport current from thed-aspartate dependent total current (as in Fig. 1). Thed-aspartate-dependent Cl and SCN chord conductance per unit area at 0 mV (○,Erev = −22.3 mV; ■,Erev = −79.9 mV, respectively) was then plotted as a function of transporter density. Linear regression of these data yielded a slope of 1.37 × 10⁻¹⁷S/transporter and 2.65 × 10⁻¹⁶ S/transporter for Cl and SCN, respectively. The average membrane area of oocytes was 2.85 × 10⁷ ± 0.14 × 107μm2 (Wadiche et al., 1995a). C, Voltage dependence of the unitary current − open probability product (i * Po).d-Aspartate-dependent currents from outside-out EAAT1 patches were recorded with symmetrical anions [(100 mmNaSCN + 10 NaCl)out/(100 mm KSCN + 10 mm KCl)in]. The macroscopic current induced by aspartate (NPoi) was divided by the number of transporters in each patch based on a chord conductance (+80 mV) of 1.69 × 10⁻¹⁶S/transporter (see Materials and Methods). The mean number of transporters in these patches was 5.65 ± 0.37 × 10⁵ transporters (n = 7).D, Nonstationary noise analysis of EAAT1 currents. Representative current trace (top) and variance (bottom) resulting from 500 consecutive 625 msec applications of 10 mmd-aspartate to an EAAT1-expressing outside-out patch (0 mV). Middle tracesrepresent an enlarged 200 msec sub-record before, during, and after agonist application. Recording solutions are the same as in Figure4. E, Mean current and variance plot during current deactivation (same patch as in C). Data were binned into 1000 points for clarity. The line drawn corresponds to the best fit to the equation: ς2 = IiI2/N +C where N = 473962 andi = 1.45 fA and C = 0.054 pA2. The number of transporters (N) was determined as in Bgiven 2.65 × 10⁻¹⁶ S/transporters at 0 mV.F, Difference of the average spectra in the presence and absence of 10 mmd-aspartate. Five hundred sweeps (600 msec each) were acquired at 10 kHz and filtered at 5 kHz. Same patch as in D.
Fig. 7.
Fig. 7.
Agonist-independent EAAT1 anion currents.A1, Representative outside-out patch recording of steady-state d-aspartate (10 mm)-induced currents from an EAAT1-expressing oocyte. A2, Record of the DHK blocked current (10 mm) from the same patch as in A1. Records of both currents were measured in asymmetrical anion solutions (see below). B, Current–voltage plots of steady-state difference currents induced or blocked by application of d-aspartate (10 mm;filled symbols; n = 4) or DHK (10 mm; open symbols; n = 4). Outside-out patches expressing EAAT1 were recorded in asymmetrical anionic solutions [(110 mm Cl)out and (100 mm SCN + 10 mm Cl)in].C, Current–voltage plots (as in B), but with symmetrical anionic solutions [(100 mm SCN + 10 mm Cl)out and (100 mm SCN + 10 mm Cl)in]. Current amplitude has been normalized to d-aspartate-dependent currents measured at −100 mV. D, Correlation of the current induced by 10 mmd-aspartate and the current blocked by 10 mm DHK at −80 mV. Squares represent data obtained in asymmetrical anionic solutions (as in B) andcircles represent data obtained in symmetrical anion solutions (as in C). The slope of this line is 0.17.
Fig. 8.
Fig. 8.
Computer simulation. A, Kinetic model of l-glutamate and d-aspartate transport and anion conductance. Model parameters were obtained by least squares fitting of data and fit an average pulse of l-glutamate ofd-aspartate. The microscopic rates were as follows:konout = 6.8 × 10⁶m−1sec−1,koffout = 30.6 sec−1; k1 = 16.0 sec−1; k−1 = 2.9 sec−1;konin = 6.8 × 10⁶m−1sec−1;koffin = 37.2 sec−1; k2 = 885 sec−1; k−2 = 200 sec−1; α1 = 8094 sec−1; β1 = 100 sec−1; α2 = 1260 sec−1; β2 = 70 sec−1. d-Aspartate data were fit with identical rates for agonist independent states andkoffout = 7.6 sec−1; k1 = 7.3 sec−1; k−1 = 1.0 sec−1;koffin = 165 sec−1; α2 = 978 sec−1, and β2 = 70 sec−1. DHK binding was assigned as 6.8 × 10⁶m−1sec−1, whereas DHK unbinding (kdhkout) = 97 sec−1.B, Probability of occupancy for each state in the kinetic scheme shown in A during a 250 msec pulse of 10 mml-glutamate. The top traces show the nonconducting states: the unliganded states are represented bydashed lines (Tout andTin; bold), whereas the liganded states are represented by a solid line(ToutGlu; bold andTinGlu). The bottom traces show the occupancy of the anion conducting states. Note the different scale bars. C, Simulation of a 250 msec pulse of 10 mml-glutamate or d-aspartate (A). The channel’s steady-state open probability was determined from nonstationary noise analysis (Fig. 4) and the DHK-blocked currents (Fig. 6). The fraction of transporters in either conducting state TGluopen orTopen are plotted as a function of time.D, Concentration dependence of the time constant for activation of l-glutamate currents for the kinetic scheme shown in A. The time constants for the activation and deactivation were calculated by fitting the current records to a single exponential. The limiting slope for the activation rate equals 6.8 × 10⁶m−1sec−1. Inset,l-Glutamate concentration dependence of the open probability (1 μm, 10 μm, 100 μm, and 1 mm). The model’s apparent affinity at steady state is 7 μm.

References

    1. Anderson CR, Stevens CF. Voltage clamp analysis of acetylcholine produced end-plate current fluctuations at frog neuromuscular junction. J Physiol (Lond) 1973;235:655–691. - PMC - PubMed
    1. Arriza JL, Kavanaugh MP, Fairman WA, Wu YN, Murdoch GH, North RA, Amara SG. Cloning and expression of a human neutral amino acid transporter with structural similarity to the glutamate transporter gene family. J Biol Chem. 1993;268:15329–15332. - PubMed
    1. Arriza JL, Eliasof S, Kavanaugh MP, Amara SG. Excitatory amino acid transporter 5, a retinal glutamate transporter coupled to a chloride conductance. Proc Natl Acad Sci USA. 1997;94:4155–4160. - PMC - PubMed
    1. Asztely F, Erdemli G, Kullmann DM. Extrasynaptic glutamate spillover in the hippocampus: dependence on temperature and the role of active glutamate uptake. Neuron. 1997;18:281–293. - PubMed
    1. Barbour B, Brew H, Attwell D. Electrogenic glutamate uptake in glial cells is activated by intracellular potassium. Nature. 1988;335:433–435. - PubMed

Publication types

MeSH terms

LinkOut - more resources