. 1998 Oct 1;18(19):7687-99.
doi: 10.1523/JNEUROSCI.18-19-07687.1998.

Whole-cell and single-channel analysis of P-type calcium currents in cerebellar Purkinje cells of leaner mutant mice

Affiliations

Whole-cell and single-channel analysis of P-type calcium currents in cerebellar Purkinje cells of leaner mutant mice

L S Dove et al. J Neurosci. .

Abstract

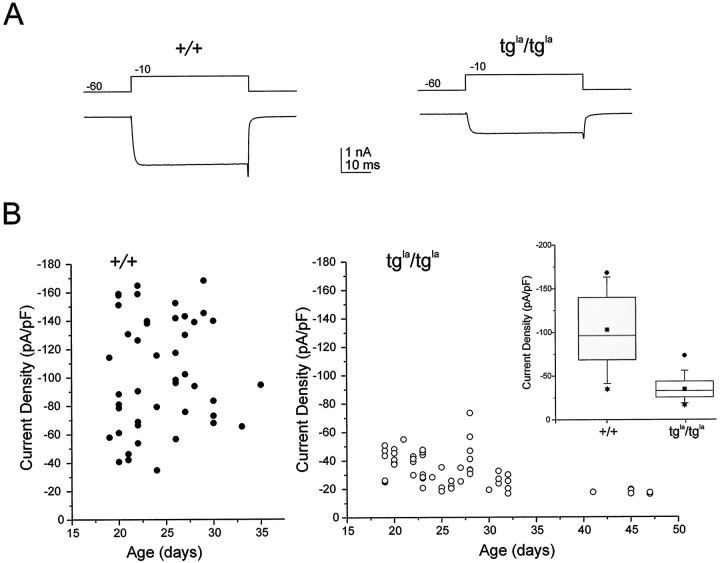
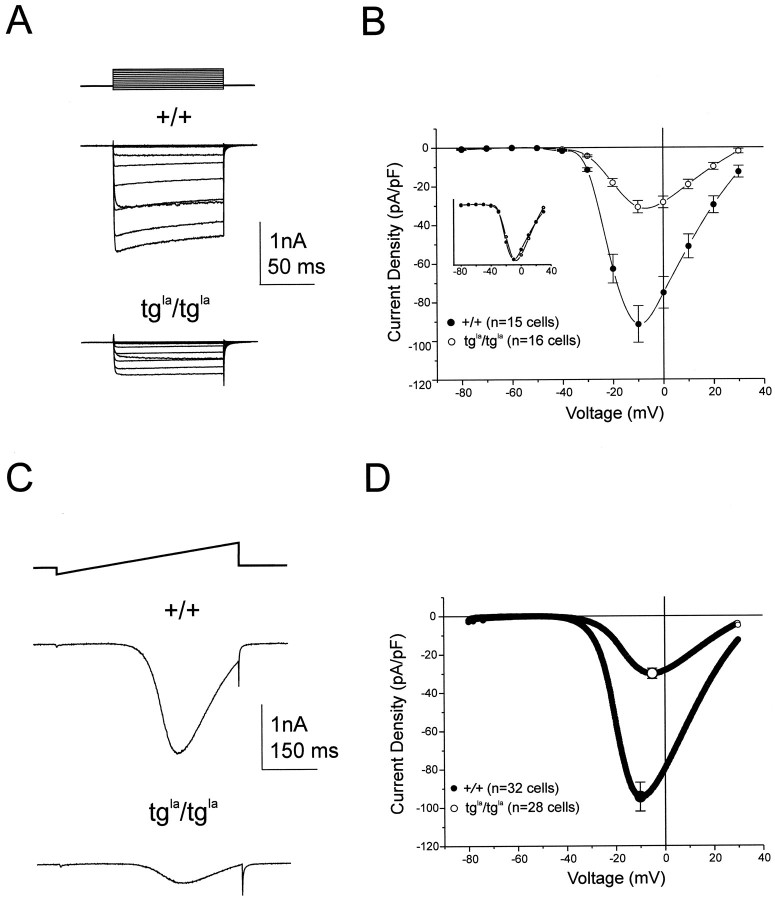
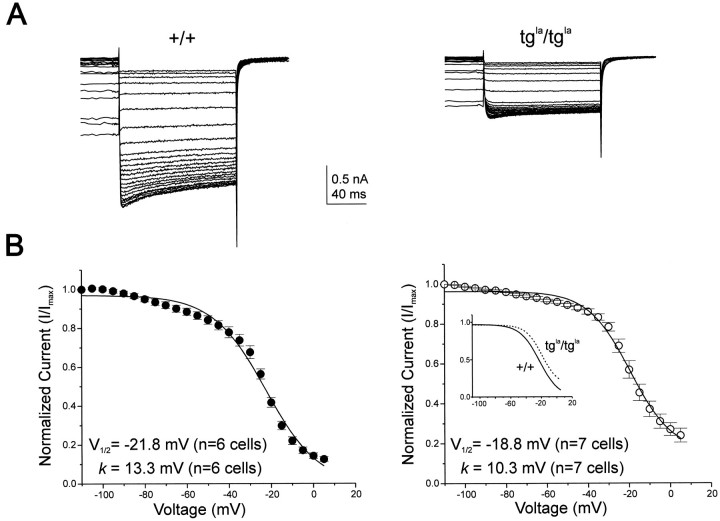
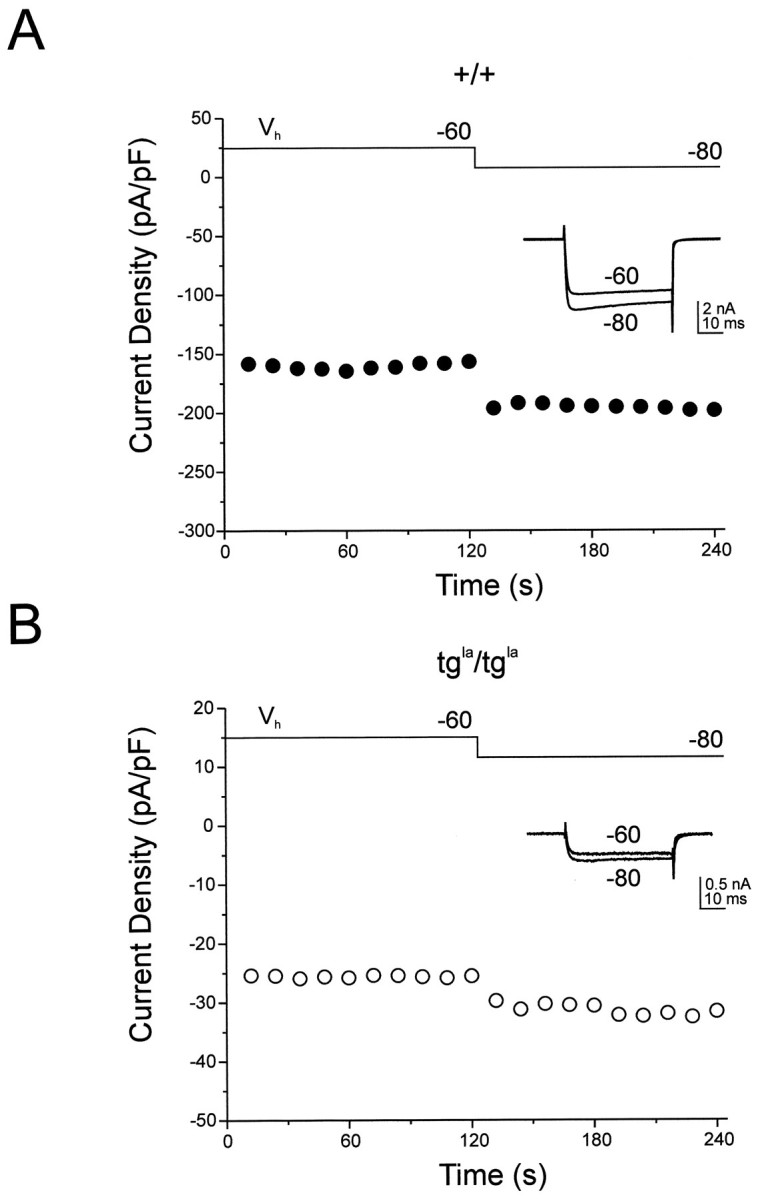
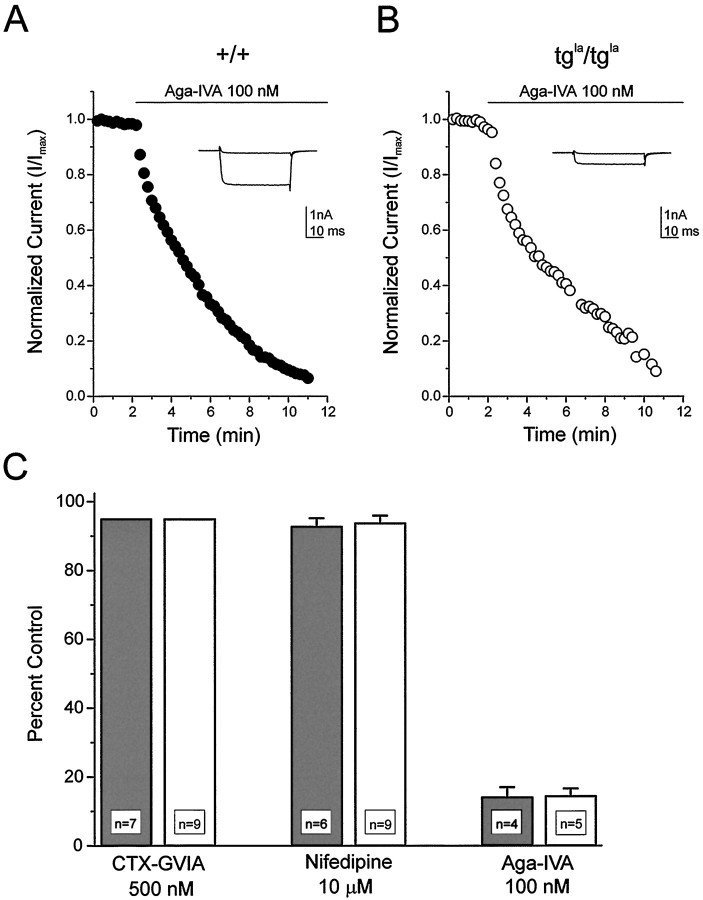
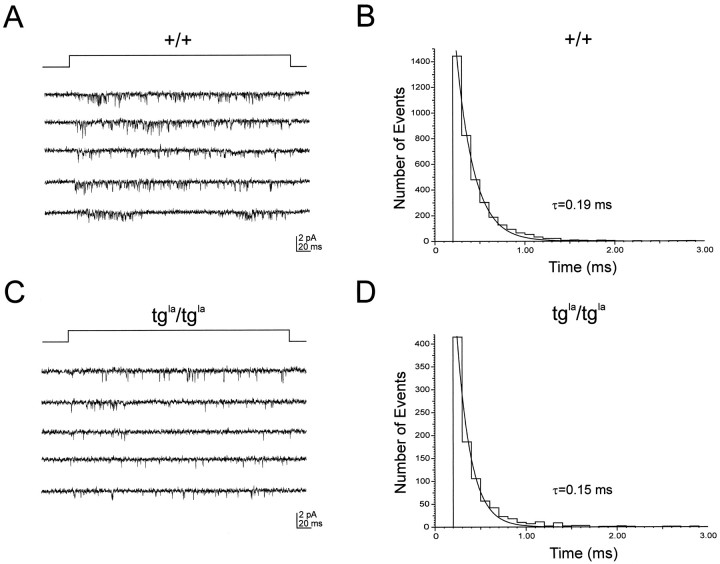
The leaner (tgla) mutation in mice results in severe ataxia and an overt neurodegeneration of the cerebellum. Positional cloning has revealed that the tgla mutation occurs in a gene encoding the voltage-activated calcium channel alpha1A subunit. The alpha1A subunit is highly expressed in the cerebellum and is thought to be the pore-forming subunit of P- and Q-type calcium channels. In this study we used both whole-cell and single-channel patch-clamp recordings to examine the functional consequences of the tgla mutation on P-type calcium currents. High-voltage-activated (HVA) calcium currents were recorded from acutely dissociated cerebellar Purkinje cells of homozygous leaner (tgla/tgla) and age-matched wild-type (+/+) mice. In whole cell recordings, we observed a marked reduction of peak current density in tgla/tgla Purkinje cells (-35.0 +/- 1.8 pA/pF) relative to that in +/+ (-103.1 +/- 5.9 pA/pF). The reduced whole-cell current in tgla/tgla cells was accompanied by little to no alteration in the voltage dependence of channel gating. In both genotypes, HVA currents were predominantly of the omega-agatoxin-IVA-sensitive P-type. Cell-attached patch-clamp recordings revealed no differences in single-channel conductance between the two genotypes and confirmed the presence of three distinct conductance levels (9, 13-14, and 17-18 pS) in cerebellar Purkinje cells. Analysis of patch open-probability (NPo) revealed a threefold reduction in the open-probability of channels in tgla/tgla patches (0.04 +/- 0.01) relative to that in +/+ (0.13 +/- 0.02), which may account for the reduced whole-cell current in tgla/tgla Purkinje cells. These results suggest that the tgla mutation can alter native P-type calcium channels at the single-channel level and that these alterations may contribute to the neuropathology of the leaner phenotype.


Figures

Fig. 1.
Fig. 1.
HVA calcium currents recorded from wild-type (+/+) and leaner (tgla/tgla) Purkinje cells. A, Currents were elicited by a depolarizing test pulse to −10 mV (40 msec) from Vh = −60 mV. Voltage protocol is shown at top. B, Peak currents from +/+ and tgla/tglaPurkinje cells were divided by cell capacitance and reported as current densities (pA/pF). Peak current densities for individual cells were plotted versus days of age. Inset, Box plot summary for current densities in +/+ (shaded) and tgla/tgla (open) Purkinje cells is shown. Box boundaries represent 25th and 75th percentiles. The horizontal line within eachbox represents the median percentile, andextended lines represent 10th and 90th percentiles. Thefilled square within the box represents the mean, and asterisks and filled diamonds (below and above extended lines) represent 1st and 99th percentiles, respectively. There is a statistically significant difference (p< 0.001) between the means for +/+ (−103.1 ± 5.9 pA/pF;n = 45 cells) and tgla/tgla (−35.0 ± 1.8 pA/pF; n = 46 cells) Purkinje cells.
Fig. 2.
Fig. 2.
Current–voltage relationships in +/+ and tgla/tgla Purkinje cells.A, Representative current traces are shown for +/+ and tgla/tglaPurkinje cells. Currents were elicited by voltage steps from −80 to +30 mV (200 msec) delivered at 8 sec intervals with Vh = −60 mV. Voltage protocol is shown at top.B, Currents were divided by cell capacitance and reported as current densities (pA/pF). Current density ± SE was plotted versus test voltage. There are statistically significant differences (p < 0.002) in current densities between +/+ (n = 15 cells, 10 mice, 8 litters) and tgla/tgla(n = 16 cells, 8 mice, 7 litters) Purkinje cells from −30 to +30 mV. Inset, The scaled activation curve for tgla/tgla cells is superimposed on the +/+ activation curve. C, Representative current traces are shown for +/+ and tgla/tgla Purkinje cells. Currents were elicited by voltage ramps from −80 to +30 mV (400 msec) with Vh = −60 mV. Voltage protocol is shown attop. D, Currents were divided by cell capacitance and reported as current densities (pA/pF). Current densities were averaged and plotted versus membrane voltage. SEs are shown at peak current densities.
Fig. 3.
Fig. 3.
Voltage-dependent inactivation in +/+ and tgla/tgla Purkinje cells.A, Inactivation records show 24 superimposedtraces of currents elicited by a depolarizing test pulse to −10 mV (120 msec). Before the test pulse, a 2 sec conditioning pulse varying in 5 mV increments between −110 and +5 mV was given.B, Voltage-dependent inactivation curves in +/+ and tgla/tgla Purkinje cells are shown. Currents were measured near the end of the pulse and were normalized to the maximum current in each record. Normalized currents ± SE were plotted versus conditioning voltage and fit with a Boltzmann distribution. Inset, Normalized activation curves are superimposed for +/+ and tgla/tgla Purkinje cells.
Fig. 4.
Fig. 4.
Relief of steady-state inactivation in +/+ and tgla/tgla Purkinje cells. Currents were elicited by a depolarizing test pulse to −10 mV from the indicated Vh. Currents were divided by cell capacitance and reported as current density. A, Time course of relief of steady-state inactivation after changing Vh from −60 to −80 mV is shown for a +/+ Purkinje cell. B, Time course of relief of steady-state inactivation after changing Vhfrom −60 to −80 mV is shown for a tgla/tgla Purkinje cell.Insets, Superimposed current traceselicited from holding potentials of −60 and −80 mV are shown.
Fig. 5.
Fig. 5.
Antagonist block of HVA current in +/+ and tgla/tgla Purkinje cells. Currents were elicited by depolarizing test pulses to −10 mV (40 msec) from Vh = −60 mV at 12 sec intervals. A, Time course of block by Aga-IVA is shown for a +/+ Purkinje cell.Inset, Superimposed current records showtraces before and after application of Aga-IVA (100 nm). B, Time course of block by Aga-IVA is shown for a tgla/tgla Purkinje cell. Inset, Superimposed current records showtraces before and after application of Aga-IVA (100 nm). C, Current fractions in +/+ (shaded) and tgla/tgla (open) Purkinje cells are shown. Bar graphs with error bars show current remaining after maximum blockade. Percent blockade was corrected for gradual current rundown. The effect of CTX-GVIA was indistinguishable from current rundown in both +/+ (n = 7 cells) and tgla/tgla (n= 9 cells) Purkinje cells (nominally 5%). There were no significant differences in the amount of current blockade by nifedipine in +/+ (n = 6 cells) and tgla/tgla (n= 9 cells) cells or by Aga-IVA in +/+ (n = 4) and tgla/tgla (n= 5 cells) cells.
Fig. 6.
Fig. 6.
Conductance of single calcium channels in +/+ and tgla/tgla Purkinje cells. Single-channel currents were recorded from cell-attached patches with 110 mm Ba2+ in the patch pipette. Currents were elicited by 300 msec steps to the indicated potential from a holding potential of −60 mV at 4 sec intervals. Currents were low-pass filtered at 2 kHz and digitally acquired at 10 kHz.A, Single-channel current records from a +/+ patch are shown. Three open levels are indicated on the bottom trace. B, Single-channelIV plot yields three distinct slope conductances as labeled. C, Single-channel current records from a tgla/tgla patch are shown. Open levels are indicated on the bottom trace. D, Single-channelIV plot yields three distinct slope conductances as labeled.
Fig. 7.
Fig. 7.
Patch open-probability (NPo) for cell-attached patches of +/+ and tgla/tgla Purkinje cells. Currents were elicited by 300 msec steps to −10 mV from a holding potential of −60 mV at 4 sec intervals. Currents were low-pass filtered at 2 kHz and digitally acquired at 10 kHz. Currents are displayed here with a 1 kHz filter imposed. A, Ten consecutive current traces recorded from a +/+ patch are shown. B, For the +/+ patch in A,NPo has been calculated for individual sweeps. NPo is displayed for 45 consecutive sweeps in which the total patchNPo is 0.10. C, Ten consecutive current traces recorded from a tgla/tgla patch are shown.D, For the tgla/tgla patch inC, NPo is displayed for 45 consecutive sweeps in which the total patchNPo is 0.02.
Fig. 8.
Fig. 8.
Mean open times of calcium channels from +/+ and tgla/tgla Purkinje cells. Calcium currents were elicited by 300 msec steps to −10 mV from a holding potential of −60 mV at 4 sec intervals. Currents were low-pass filtered at 2 kHz and digitally acquired at 10 kHz. A, Single-channel current records from a +/+ patch. B, Open-time histogram for the +/+ patch shown in A, fitted with a single exponential. C, Single-channel current records from a tgla/tgla patch.D, Open-time histogram for the tgla/tgla patch shown inC, fitted with a single exponential.

References

    1. Bean BP. Classes of calcium channels in vertebrate cells. Annu Rev Physiol. 1989;51:367–384. - PubMed
    1. Berrow NS, Brice NL, Tedder I, Page KM, Dolphin AC. Properties of cloned rat α1A calcium channels transiently expressed in the COS-7 cell line. Eur J Neurosci. 1997;9:739–748. - PubMed
    1. Birnbaumer L, Campbell KP, Catterall WA, Harpold MM, Hofmann F, Horne WA, Mori Y, Schwartz A, Snutch TP, Tanabe T, Tsien RW. The naming of voltage-gated calcium channels. Neuron. 1994;13:505–506. - PubMed
    1. Catterall WA, Striessnig J. Receptor sites for Ca2+ channel antagonists. Trends Pharmacol. 1992;13:256–262. - PubMed
    1. Colquhoun D, Hawkes AG. Stochastic properties of ion channel openings and bursts in a membrane patch that contains two channels: evidence concerning the number of channels present when a record containing only single openings is observed. Proc R Soc Lond [Biol] 1990;240:453–477. - PubMed

Publication types

MeSH terms