. 1998 Oct 1;18(19):7953-61.
doi: 10.1523/JNEUROSCI.18-19-07953.1998.

Brain-derived neurotrophic factor and basic fibroblast growth factor downregulate NMDA receptor function in cerebellar granule cells

Affiliations

Brain-derived neurotrophic factor and basic fibroblast growth factor downregulate NMDA receptor function in cerebellar granule cells

C Brandoli et al. J Neurosci. .

Abstract

Evidence has accumulated to suggest that the NMDA glutamate receptor subtype plays an important role in neuronal degeneration evoked by hypoxia, ischemia, or trauma. Cerebellar granule cells in culture are vulnerable to NMDA-induced neuronal excitotoxicity. In these cells, brain-derived neurotrophic factor (BDNF) and basic fibroblast growth factor (FGF2) prevent the excitotoxic effect of NMDA. However, little is known about the molecular mechanisms underlying the protective properties of these trophic factors. Using cultured rat cerebellar granule cells, we investigated whether BDNF and FGF2 prevent NMDA toxicity by downregulating NMDA receptor function. Western blot and RNase protection analyses were used to determine the expression of the various NMDA receptor subunits (NR1, NR2A, NR2B, and NR2C) after BDNF or FGF2 treatment. FGF2 and BDNF elicited a time-dependent decrease in the expression of NR2A and NR2C subunits. Because NMDA receptor activation leads to increased intracellular Ca2+ concentration ([Ca2+]i), we studied the effect of the BDNF- and FGF2-induced reduction in NR2A and NR2C synthesis on the NMDA-evoked Ca2+ responses by single-cell fura-2 fluorescence ratio imaging. BDNF and FGF2 reduced the NMDA-mediated [Ca2+]i increase with a time dependency that correlates with their ability to decrease NR2A and NR2C subunit expression, suggesting that these trophic factors also induce a functional downregulation of the NMDA receptor. Because sustained [Ca2+]i is believed to be causally related to neuronal injury, we suggest that BDNF and FGF2 may protect cerebellar granule cells against excitotoxicity by altering the NMDA receptor-Ca2+ signaling via a downregulation of NMDA receptor subunit expression.


Figures
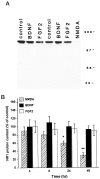
Fig. 1.
Fig. 1.
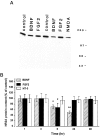
NMDA but not BDNF or FGF2 elicits a time-dependent decrease in NR1 subunit protein levels. Cerebellar granule cells (8 DIV) were exposed to NMDA (100 μm), BDNF (50 ng/ml), or FGF2 (50 ng/ml) for 3, 6, 24, and 48 hr. Cells were harvested, and the content of the NR1 subunit protein was determined by Western blot analysis using NR1 antibody. A, Representative blot showing NR1 immunoreactivity in cerebellar granule cells 24 hr after various treatments. Molecular weight markers are in kilodaltons.B, Time course of the effect of BDNF, FGF2, and NMDA on the NR1 subunit protein levels. Levels of NR1 were calculated by densitometric analysis of the NR1-immunoreactive band. Data, expressed as percent of control, are the mean ± SEM of three separate preparations of granule cells (n = 6). *p < 0.05; **p < 0.01 versus control (ANOVA and Dunnett’s test). Similar results were obtained using cells at 12 DIV.
Fig. 2.
Fig. 2.
BDNF and FGF2 decrease NR2A subunit protein levels. Cerebellar granule cells were exposed to BDNF, FGF2, or NT-3 (all at 50 ng/ml) for 1, 3, 6, 24, and 48 hr or to NMDA (100 μm) for 24 hr. Lysates were prepared, and Western blot analysis was performed using NR2A antibody. A, Representative blot showing NR2A immunoreactivity of cells 24 hr after various treatments. Molecular weight markers are in kilodaltons.B, Time course of the effect of BDNF, FGF2, and NT-3 on the NR2A protein levels. Protein content was calculated by densitometric analysis of the NR2A-immunoreactive band. Data, expressed as percent of control, are the mean ± SEM of three separate experiments (n = 6), using different preparations of granule cells. *p < 0.05; **p < 0.01 versus control (ANOVA and Dunnett’s test).
Fig. 3.
Fig. 3.
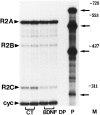
Reduction of NR2A and NR2C subunit mRNA levels by BDNF. RNase protection assay of 25 μg of total RNA extracted from cerebellar granule cells exposed to serum-free medium in the absence (CT) or presence of BDNF (50 ng/ml) for 6 hr.DP, Digested probe; P, aliquot of the hybridization solution containing the cRNA probes for NR2A (R2A), NR2B (R2B), NR2C (R2C), and cyclophilin (cyc). Thecyc probe was labeled at a lower specific activity.M, Molecular weight markers (MspI-digested pBR322). Protected fragments (indicated by arrows) were visualized by overnight exposure on x-ray film.
Fig. 4.
Fig. 4.
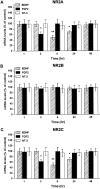
BDNF and FGF2 induce a time-dependent decrease in NR2A and NR2C subunit mRNA content. Cerebellar granule cells were exposed to BDNF, FGF2, or NT-3 for the indicated times. NR2A (A), NR2B (B), and NR2C (C) mRNA levels were determined by RNase protection assay and were calculated as described in Materials and Methods. Data, expressed as percent of control, are the mean ± SEM of three independent experiments (n = 6). *p < 0.05; **p < 0.01 versus control (ANOVA and Dunnett’s test).
Fig. 5.
Fig. 5.
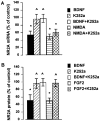
K252a prevents the BDNF- and FGF2-mediated downregulation of NR2A expression. Cerebellar granule cells were preincubated with K252a (100 nm) 10 min before the addition of BDNF (50 ng/ml), FGF2 (50 ng/ml), or NMDA (100 μm). NR2A mRNA (A) and protein (B) levels were determined by RNase protection assay and Western blot analysis at 6 and 24 hr, respectively (NR2A protein levels in FGF2-treated cells were measured at 6 hr). Data, expressed as percent of control, are the mean ± SEM of three determinations from three separate cell preparations (n = 6). *p < 0.05 versus control;  p < 0.05 versus BDNF or FGF2.
Fig. 6.
Fig. 6.
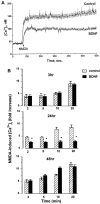
BDNF elicits a time-dependent inhibition of the NMDA-evoked [Ca2+]i increase in cerebellar granule cells. Neurons (8 DIV) were exposed to serum-free medium for 3, 24, or 48 hr in the absence (control, vehicle-treated) or presence of BDNF (50 ng/ml). Neurons were then loaded with fura-2, and Ca2+ imaging was performed in Mg2+-free Locke’s solution. Resting [Ca2+]i was recorded, and NMDA (100 μm) was applied. Single-cell [Ca2+]i was measured and analyzed as described in Materials and Methods. A, Representative of NMDA-induced Ca2+ response in neurons exposed to BDNF or vehicle (control) for 24 hr. B, Time course of the effect of BDNF on the NMDA-induced [Ca2+]i increase. The single-cell [Ca2+]i rise after NMDA was measured in neurons exposed to BDNF for 3, 24, or 48 hr. Data are expressed as an NMDA-induced fold [Ca2+]i increase plotted against time after NMDA addition. Results represent the mean ± SEM of four separate preparations of cerebellar granule cells (each preparation included at least three coverslips; 50–99 neurons being imaged per coverslip in a single microscopic field). *p < 0.01 (ANOVA and Dunnett’s test).
Fig. 7.
Fig. 7.
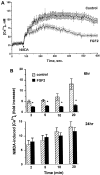
Inhibitory effect of FGF2 on the NMDA-evoked [Ca2+]i increase. Cerebellar granule cells were exposed to serum-free medium for 6 or 24 hr in the absence (control, vehicle-treated) or presence of FGF2 (50 ng/ml). [Ca2+]i imaging was performed as described in the legend of Figure 6. A, Representative of NMDA-induced Ca2+ response in neurons exposed to FGF2 or vehicle for 6 hr. B, Time course of the effect of FGF2 on the NMDA-induced [Ca2+]iincrease. The single-cell [Ca2+]iincrease after NMDA was measured in neurons exposed to FGF2 for 6 or 24 hr. Data are expressed as an NMDA-induced fold [Ca2+]i increase plotted against time after NMDA addition and represent the mean ± SEM from a population of 65 (control) and 70 (FGF2-treated) neurons per coverslip from four separate preparations of cerebellar granule cells (each preparation included at least three coverslips). *p< 0.05 (ANOVA and Dunnett’s test).

Similar articles

Cited by

References

    1. Anegawa NJ, Lynch DR, Verdoorn TA, Pritchett DB. Transfection of N-methyl-d-aspartate receptors in a nonneuronal cell line leads to cell death. J Neurochem. 1995;64:2004–2012. - PubMed
    1. Berg MM, Sterneberg DW, Parada LF, Chao MV. K-252a inhibits nerve growth factor-induced trk proto-oncogene tyrosine phosphorylation and kinase activity. J Biol Chem. 1992;267:13–16. - PubMed
    1. Burgoyne RD, Cambray-Deakin MA. The cellular neurobiology of neuronal development: the cerebellar granule cell. Brain Res Rev. 1988;13:77–101. - PubMed
    1. Chao M, Hempstead B. p75 and Trk: a two-receptor system. Trends Neurosci. 1995;18:321–326. - PubMed
    1. Cheng B, Furukawa K, O’Keefe JA, Goodman Y, Kihiko M, Fabian T, Mattson MP. Basic fibroblast growth factor selectively increases AMPA-receptor subunit GluR1 protein level and differentially modulates Ca2+ responses to AMPA and NMDA in hippocampal neurons. J Neurochem. 1995;65:2525–2536. - PubMed

Publication types

MeSH terms

LinkOut - more resources