. 1998 Sep 21;188(6):1063-74.
doi: 10.1084/jem.188.6.1063.

Molecular and biological characterization of the murine leukotriene B4 receptor expressed on eosinophils

Affiliations

Molecular and biological characterization of the murine leukotriene B4 receptor expressed on eosinophils

W W Huang et al. J Exp Med. .

Abstract

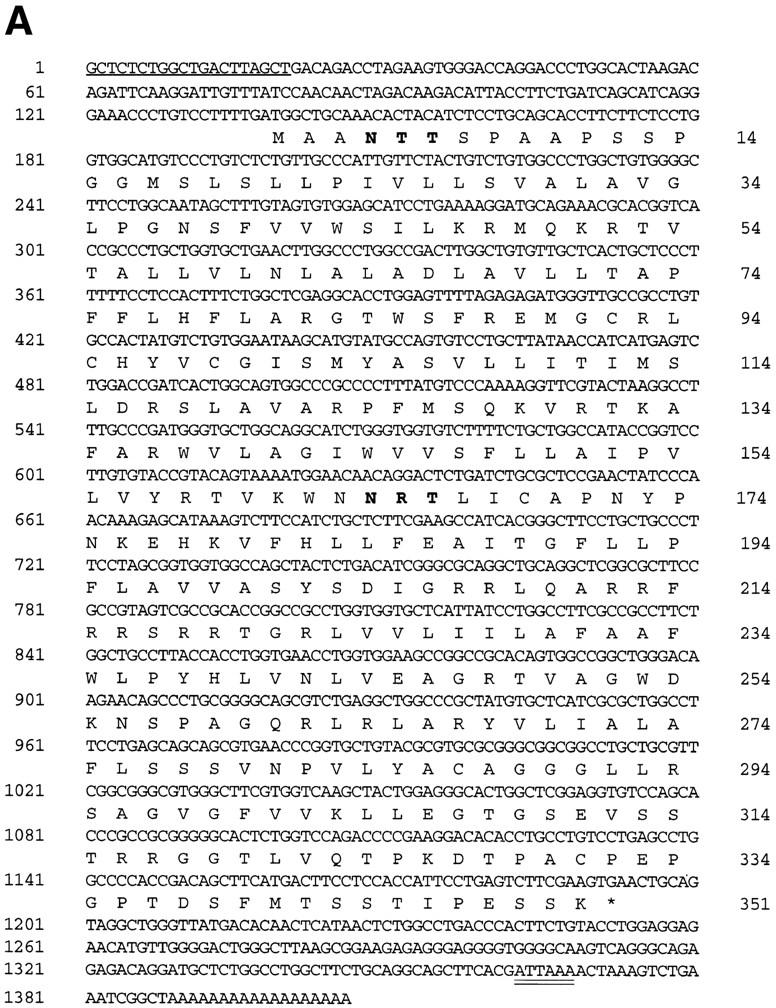
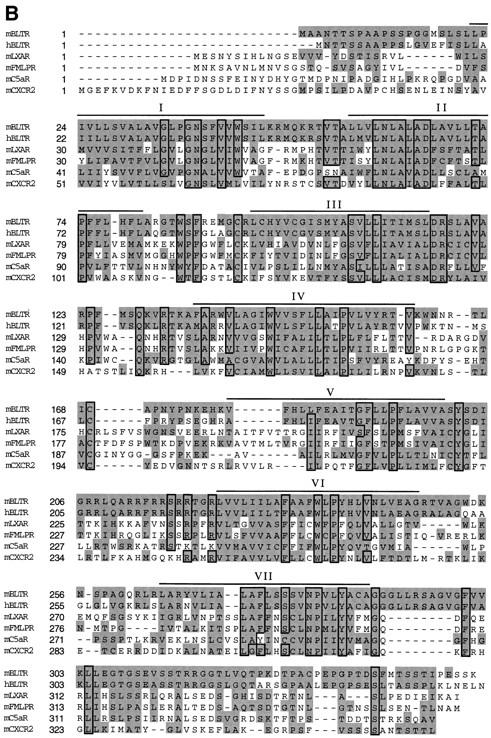
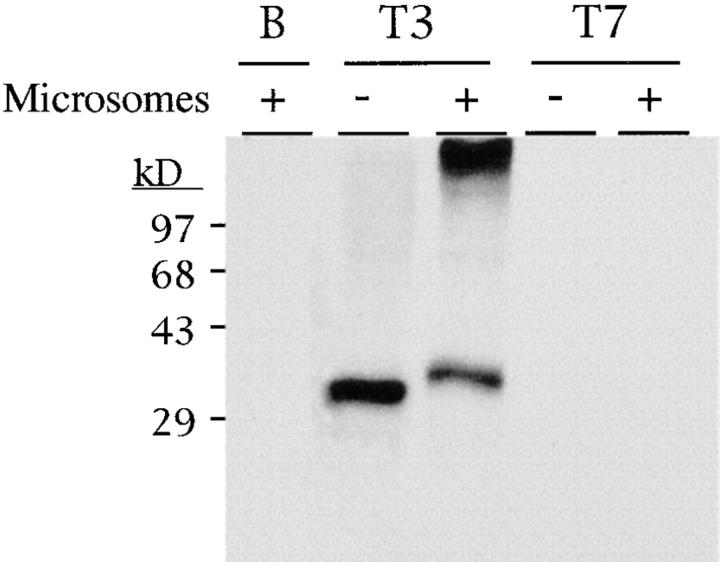
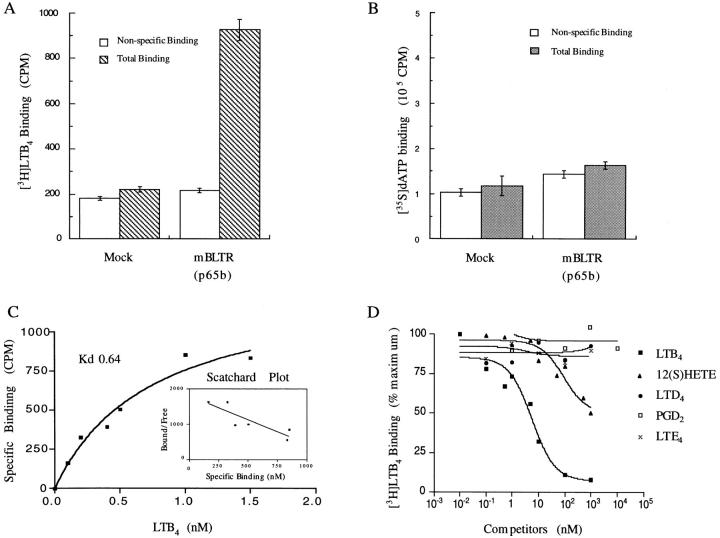
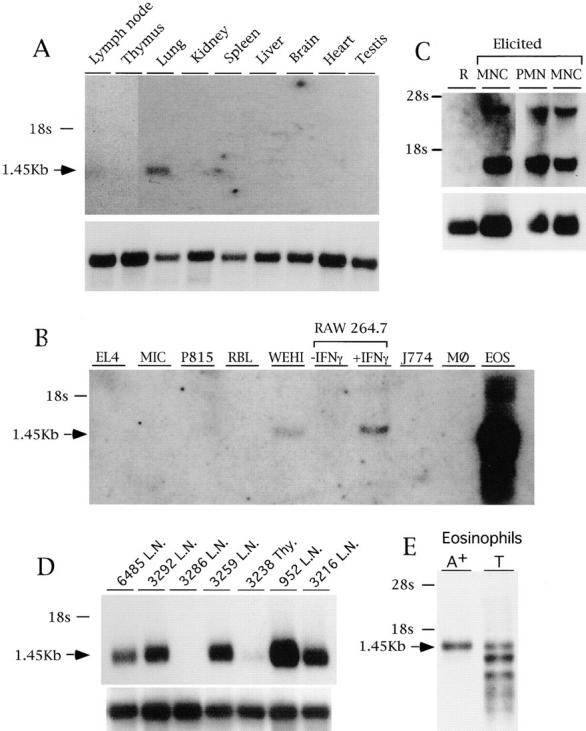
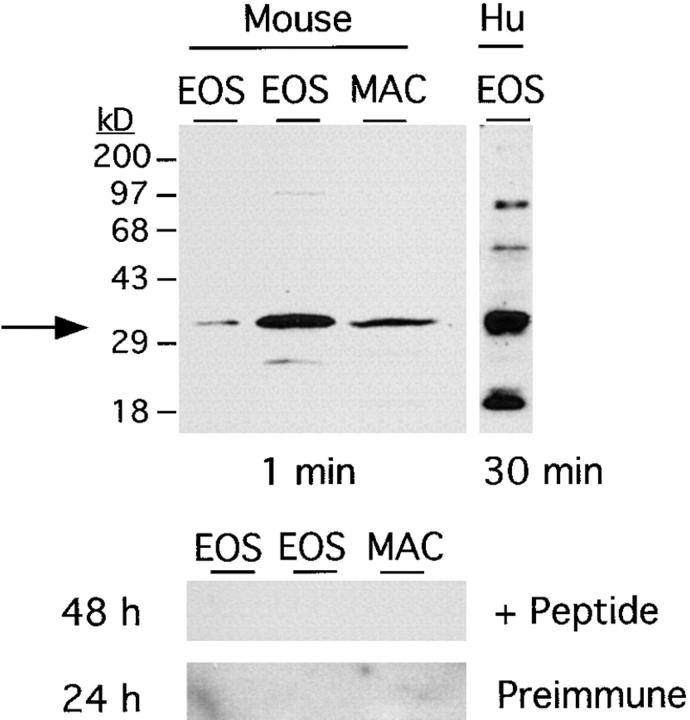
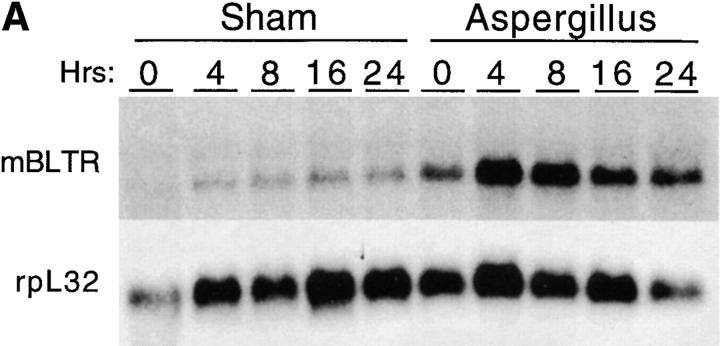
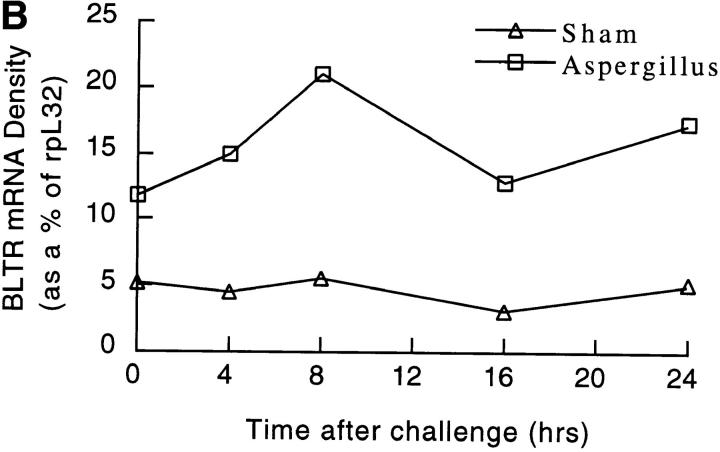
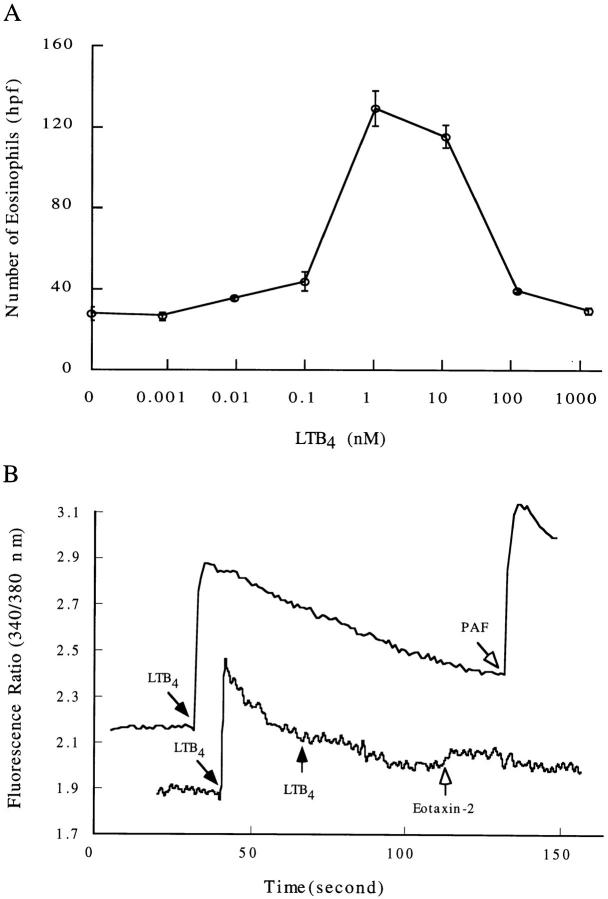
The movement of leukocytes into tissues is regulated by the local production of chemical mediators collectively referred to as chemoattractants. Although chemoattractants constitute a diverse array of molecules, including proteins, peptides, and lipids, they all appear to signal leukocytes through a related family of seven transmembrane-spanning G protein-coupled receptors. The eosinophil is a potent proinflammatory cell that is attracted into tissues during allergic inflammation, parasitic infection, and certain malignancies. Since the molecular mechanisms controlling eosinophil recruitment are incompletely understood, we performed a degenerate polymerase chain reaction on cDNA isolated from murine eosinophils to identify novel chemoattractant receptors. We report the isolation of a cDNA that encodes a 351-amino acid glycoprotein that is 78% identical to a human gene that has been reported to be a purinoceptor (P2Y7) and a leukotriene B4 (LTB4) receptor (BLTR). Chinese hamster ovary (CHO) cells transfected with this cDNA specifically bound [3H]LTB4 with a dissociation constant of 0.6 +/- 0.1 nM. Furthermore, LTB4 induced a dose-dependent intracellular calcium flux in transfected CHO cells. In contrast, [35S]dATP did not specifically bind to these transfectants. This mRNA was expressed at high levels in interleukin 5-exposed eosinophils, elicited peritoneal macrophages and neutrophils, and to a lesser extent interferon gamma stimulated macrophages. Low levels of expression were detected in the lung, lymph node, and spleen of unchallenged mice. Western blot analysis detected the mBLTR protein in murine eosinophils and alveolar macrophages as well as human eosinophils. In addition, elevated levels of mBLTR mRNA were found in the lungs of mice in a murine model of allergic pulmonary inflammation in a time course consistent with the influx of eosinophils. Our findings indicate that this murine receptor is an LTB4 receptor that is highly expressed on activated leukocytes, including eosinophils, and may play an important role in mediating eosinophil recruitment into inflammatory foci.


Figures

Figure 1
Figure 1
Nucleotide and amino acid sequence of mBLTR cDNA. (A) Nucleotide sequence is numbered on the left and the deduced amino acid sequence is numbered beginning with the predicated initiating methionine on the right. 20 nucleotides obtained from 5′ RACE are underlined and the polyadenylation signal sequence is double underlined. Two putative N-linked glycosylation sites are indicated in bold. These data are available from GenBank/EMBL/DDBJ under accession number AF044030. (B) Amino acid sequence alignment of the mBLTR open reading frame with the chemoattractant receptors: human LTB4 receptor (hBLTR), murine lipoxin A4 receptor (mLXAR), murine formyl-Met-Leu-Phe receptor (mFMLPR), murine C5a receptor (mC5aR), and murine CXCR2. The transmembrane domains predicted from a Kyte-Doolittle hydrophobicity analysis are overlined and labeled as I-VII. The shaded area indicates ≥90% sequence homology and the boxed area indicates regions of identity.
Figure 1
Figure 1
Nucleotide and amino acid sequence of mBLTR cDNA. (A) Nucleotide sequence is numbered on the left and the deduced amino acid sequence is numbered beginning with the predicated initiating methionine on the right. 20 nucleotides obtained from 5′ RACE are underlined and the polyadenylation signal sequence is double underlined. Two putative N-linked glycosylation sites are indicated in bold. These data are available from GenBank/EMBL/DDBJ under accession number AF044030. (B) Amino acid sequence alignment of the mBLTR open reading frame with the chemoattractant receptors: human LTB4 receptor (hBLTR), murine lipoxin A4 receptor (mLXAR), murine formyl-Met-Leu-Phe receptor (mFMLPR), murine C5a receptor (mC5aR), and murine CXCR2. The transmembrane domains predicted from a Kyte-Doolittle hydrophobicity analysis are overlined and labeled as I-VII. The shaded area indicates ≥90% sequence homology and the boxed area indicates regions of identity.
Figure 2
Figure 2
In vitro transcription and translation of the mBLTR cDNA (p65b). Translation in the presence (+) or absence (−) of pancreatic microsomal membranes of p65b cRNA transcribed with T3 polymerase (sense) and T7 polymerase (antisense control). B (blank) translation in the absence of added cRNA. Molecular mass markers in kD are indicated on the left.
Figure 3
Figure 3
Binding of [3H]LTB4 to mBLTR transfected CHO cell membranes. (A) 1 nM [3H]LTB4 and (B) 20 nM [35S]dATP binding to membranes (10 μg) of mBLTR (p65b) transiently transfected CHO cells or mock transfected CHO cells in the absence (Total Binding) and presence (Nonspecific Binding) of unlabeled excess ligand (mean ± SE, n = 4). (C) Binding isotherm and Scatchard analysis of [3H]LTB4 binding to membrane of mBLTR (p65b) transfected CHO cells (mean, n = 4). (D) Inhibition of [3H]LTB4 binding to membrane fractions of mBLTR-transfected CHO cells by various eicosanoids, including 12(S) HETE, LTD4, LTE4, and PGD2.
Figure 4
Figure 4
LTB4-induced calcium flux in mBLTR-CHO transfectants. Fura-2 loaded stable mBLTR-CHO clone (A1B2.1) and the parental wild-type CHO cells (Wt-CHO) were stimulated with LTB4 (concentrations indicated on the right) at the times indicated by the arrows. [Ca2+]i levels were measured as ratio fluorescence of excitation at 340/380 nm over time.
Figure 5
Figure 5
Expression of the mBLTR mRNA. (A) Northern blot analysis of 1.5 μg poly(A)+ RNA isolated from the indicated organs of a healthy FVB mouse. (B) Northern blot analysis of 10 μg total RNA isolated from the EL4 T cell line, MIC B cell line, P815 mastocytoma line, RBL basophilic line, WEHI macrophage line, RAW 264.7 macrophage cell line untreated or treated for 18 h with 200 U/ml IFN-γ, J774 macrophage line, bone marrow derived macrophages (), and eosinophils purified from IL-5 transgenic mice. (C) Northern blot analysis of 10 μg total RNA isolated from leukocytes recovered from peritoneal lavage before (R, resting) or after (elicited) intraperitoneal casein injection and percoll density gradient purification. M, macrophage fraction (76% macrophages, and 24% neutrophils); N, neutrophil fraction (95% neutrophils, 5% macrophages). (D) Northern blot analysis of 1.5 μg poly(A)+ RNA isolated from Thy1 positive fresh lymphomas obtained from lymph nodes (L.N.) or thymus (Thy). Each lane contains RNA isolated from a lymphoma that spontaneously arose in a different bigenic mouse containing a c-myc transgene and p53 null alleles numbered and described in Elson et al. (35). (E) Northern blot analysis of 2 μg of poly(A)+ RNA and 10 μg of total RNA before poly A selection (T) isolated from eosinophils purified from IL-5 transgenic mice. Blots were sequentially probed with the mBLTR (p65b) cDNA (top of each panel) and rpL32 or 28s as a control for RNA loading (bottom of panel).
Figure 6
Figure 6
Expression of the mBLTR protein. Protein extracts of eosinophils obtained from two IL-5 transgenic mice (30 μg/lane), murine alveolar macrophages (20 μg/lane), and human eosinophils purified from a normal donor (30 μg/ lane), were loaded onto a 10% SDS-PAGE gel and electrophoretically separated. Western blot analysis was performed using an affinity-purified rabbit anti– mouse BLTR antibody. The position of BLTR protein is indicated by the arrow and molecular mass markers in kD are indicated to the left of the top blot. The affinity-purified antibody cross-reacts with the human receptor. This antibody reaction was specific for the immune serum and was not seen with the preimmune serum and was completely blocked by excess BLTR peptide (bottom two blots). The exposure times are indicated below the top blots and to the left of the bottom blots. EOS, eosinophils; MAC, alveolar macrophages; Hu, human.
Figure 7
Figure 7
Expression of mBLTR in lungs of mice in the Af model of allergic pulmonary inflammation. Mice were treated three times a week for a period of three weeks with 50 μg Af intranasally (or normal saline in “sham” animals). (A) Northern blot analysis of 5 μg of total RNA isolated from the lungs of mice at the indicated times after the last Af treatment or saline treatment (sham control). Each lane represents a different mouse. The blot was probed sequentially with the mBLTR cDNA and rpL32 as a control for RNA loading. (B) Quantitation of the Northern blot using a PhosphorImager expressed as the percentage of rpL32 signal for each lane (PhosphorImager signal of BLTR/rpL32 × 100).
Figure 7
Figure 7
Expression of mBLTR in lungs of mice in the Af model of allergic pulmonary inflammation. Mice were treated three times a week for a period of three weeks with 50 μg Af intranasally (or normal saline in “sham” animals). (A) Northern blot analysis of 5 μg of total RNA isolated from the lungs of mice at the indicated times after the last Af treatment or saline treatment (sham control). Each lane represents a different mouse. The blot was probed sequentially with the mBLTR cDNA and rpL32 as a control for RNA loading. (B) Quantitation of the Northern blot using a PhosphorImager expressed as the percentage of rpL32 signal for each lane (PhosphorImager signal of BLTR/rpL32 × 100).
Figure 8
Figure 8
LTB4-induced chemotaxis and calcium flux of mouse eosinophils. (A) Chemotaxis of murine eosinophils in response to the indicated concentrations of LTB4 (mean ± SE, n = three separate experiments). (B) Calcium flux responses of murine eosinophils. Each tracing represents the [Ca2+]i levels of fura-2-loaded eosinophils measured as relative fluorescence over time. Arrows mark the time of addition of the indicated agonist LTB4 (100 nM), PAF (5 μM), and human eotaxin-2 (1.6 μM).

References

    1. Weller PF. The immunobiology of eosinophils. N Eng J Med. 1991;324:1110–1118. - PubMed
    1. Bousquett J, Chanez P, Lacoste JY, Barneon G, Ghavanian N, Enander I, Venge P, Ahlstedt S, Simony-Lafontaine J, et al. Eosinophilic inflammation in asthma. N Eng J Med. 1990;323:1033–1039. - PubMed
    1. Bochner BS, Schleimer RP. The role of adhesion molecules in human eosinophil and basophil recruitment. J Allergy Clin Immunol. 1994;94:427–428. - PubMed
    1. Resnick MB, Weller PF. Mechanisms of eosinophil recruitment. Am J Respir Cell Mol Biol. 1993;8:349–355. - PubMed
    1. Baggiolini M, Dahinden CA. CC chemokines in allergic inflammation. Immunol Today. 1994;15:127–133. - PubMed

Publication types

MeSH terms

Associated data