Comparative Study
. 1998 Oct 2;282(4):891-901.
doi: 10.1006/jmbi.1998.2054.

Temperature effects on the allosteric responses of native and chimeric aspartate transcarbamoylases

Affiliations
Comparative Study

Temperature effects on the allosteric responses of native and chimeric aspartate transcarbamoylases

L Liu et al. J Mol Biol. .

Abstract

Although structurally very similar, the aspartate transcarbamoylases (ATCase) of Serratia marcescens and Escherichia coli have distinct allosteric regulatory patterns. It has been reported that a S. marcescens chimera, SM : rS5'ec, in which five divergent residues (r93 to r97) of the regulatory polypeptide were replaced with their Escherichia coli counterparts, possessed E. coli-like regulatory characteristics. The reverse chimera EC:rS5'sm, in which the same five residues of E. coli have been replaced with their S. marcescens counterpart, lost both heterotrophic and homotropic responses. These results indicate that the r93-r97 region is critical in defining the ATCase allosteric character. Molecular modeling of the regulatory polypeptides has suggested that the replacement of the S5' beta-strand resulted in disruption of the allosteric-zinc interface. However, the structure-function relationship could be indirect, and the disruption of the interface could influence allostery by altering the global energy of the enzyme. Studies of the temperature-sensitivity of the CTP response demonstrate that it is possible to convert CTP inhibition of the SM:rS5'ec chimera at high temperature to activation below 10 degreesC. Nonetheless, the temperature response of the native S. marcescens ATCase suggests a strong entropic effect that counteracts the CTP activation. Therefore, it is suggested that the entropy component of the coupling free energy plays a significant role in the determination of both the nature and magnitude of the allosteric effect in ATCase.


Figures

Figure 1
Figure 1
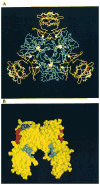
A, A molecular graphic representation of a CTP-liganded R-state holoenzyme of ATCase from E. coli. The holoenzyme is composed of two catalytic trimers (one trimer is shown in blue while the second is located beneath this trimer and not shown here for the purpose of simplification) and three regulatory dimers (in yellow). The nucleotide effector CTP (in white sticks and purple balls) binds to the allosteric domain and exerts its effect through the zinc domain (six zinc atoms are indicated as white balls) to the catalytic sites 60 Å away (the catalytic site lies between the Asp and CP domains of each catalytic monomer and is defined by the substrate analogs phosphonoacetamide (purple balls) and malonate (yellow balls)). The substituted regions (r93 to r97, red ribbon) are located at the junction between the allosteric binding sites and catalytic sites. B, A space-filled model of a regulatory dimer is shown in yellow. The altered S5′ β-strand regions (r93 to r97) are shown in red; the CTP nucleotide effectors in purple occupy the allosteric binding site; and the hydrophobic pockets (green) are located at the interface of the allosteric and zinc domains. All atomic coordinates are originally from file 8at1.full in the Protein Data Bank supplied by Gouaux et al. (1990).
Figure 2
Figure 2
A cartoon showing the secondary structure in a regulatory dimer. The α-helices are labeled with H1′, H2I or H3′ and the β-sheets are labeled S1′ to S9′. The altered S5′ β-strand regions (r93 to r97) connects the allosteric domain to the zinc domain. All atomic coordinates are originally from file 4at1 in the Protein Data Bank supplied by Stevens et al. (1990).
Figure 3
Figure 3
A diagram of sequence composition of the regulatory polypeptide of the native and chimeric enzymes and their coupling free energies between nucleotide effectors and substrate aspartate. The open boxes represent the E. coli sequence and the gray represents the S. marcescens sequence; the amino acid sequence of the corresponding r93 to r97 region is indicated within each box. The coupling free energies are determined using the equation: ΔGax = −1.3616 log(Qax), where Qax is the ratio of [Asp]0.5 in the absence of nucleotide effector to that in the presence of saturating concentration of nucleotide effector: ATP, CTP, UTP and CTP + UTP.
Figure 4
Figure 4
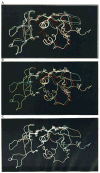
The modeled structures of the regulatory polypeptides of the native E. coli (in red), native S. marcescens (in purple), chimera SM : rS5′ec (in blue) and EC : rS5′sm (in green) enzymes display the overlapping and separation of the backbones and the relocation of the side-chains. A, The superimposed regulatory polypeptides of the four enzymes; B, The superimposed regulatory polypeptides of the native E. coli (in red) and EC : rS5′sm chimera (in green); and C, the superimposed regulatory polypeptides of the native S. marcescens (in purple) and SM : rS5′ec chimera (in blue) enzymes.
Figure 5
Figure 5
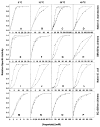
The aspartate saturation curves of native S. marcescens (A to D), SM:rS5′ec chimera (E to H), native E. coli (I to L) and EC:rS5′sm chimera (M to P) enzymes in the absence (●) and presence (○) of saturating concentration of CTP and at different temperatures. Although these assays were performed in the presence of various concentrations of CTP at each temperature, only the assays with maximum effect are shown here. The CTP concentrations for the native S. marcescens enzyme is 0.5 mM at 0°C and 10°C, 2 mM at 3 °C0 and 5 mM at 4 °C;0 for the native E. coli enzyme and the EC:rS5′sm chimera, 2 mM at 0 °C, 10°C, 30°C and 40°C.
Figure 6
Figure 6
The temperature effects on the [Asp]0.5 of native S. marcescens and SM : rS5′ec chimera in the presence of various concentrations of CTP.
Figure 7
Figure 7
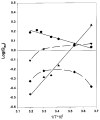
The effect of temperature on Qax for the CTP-aspartate interaction of the native E. coli (◆), S. marcescens (●), SM : rS5′ec chimera (▲) and EC : rS5′sm chimera (▼), presented as a plot of log(Qax) versus reciprocal temperature expressed in Kelvin. The broken lines are smoothed connecting lines between different temperatures and the continuous lines are the best-fit linear regression lines. The points above the line of log(Qax) = 0 indicate activation and those under the line, inhibition.

Similar articles

Cited by

References

    1. Allewell NN, LiCata VJ. Thermodynamic approaches to understanding aspartate transcarbamylase. Methods Enzymol. 1995;259:608–628. - PubMed
    1. Aucoin JM, Pishko EJ, Baker DP, Kantrowitz ER. Engineered complementation in Escherichia coli aspartate transcarbamoylase-heterotropic regulation by quaternary structure stabilization. J Biol Chem. 1996;271:29865–29869. - PubMed
    1. Beck DA, Kedzie KM, Wild JR. Comparison of the aspartate transcarbamoylases from Serratia marcescens and Escherichia coli. J Biol Chem. 1989;264:16629–16637. - PubMed
    1. Braxton BL, Tlapak-Simmons VL, Reinhart GD. Temperature-induced inversion of allosteric phenomena. J Biol Chem. 1994;269:47–50. - PubMed
    1. Braxton BL, Mullins LS, Raushel FM, Reinhart GD. Allosteric effects of carbamoyl phosphate synthetase from Escherichia coli are entropy-driven. Biochemistry. 1996;35:11918–11924. - PubMed

Publication types

MeSH terms

LinkOut - more resources