. 1998 Sep 15;12(18):2956-70.
doi: 10.1101/gad.12.18.2956.

Recovery from DNA replicational stress is the essential function of the S-phase checkpoint pathway

Affiliations

Recovery from DNA replicational stress is the essential function of the S-phase checkpoint pathway

B A Desany et al. Genes Dev. .

Abstract

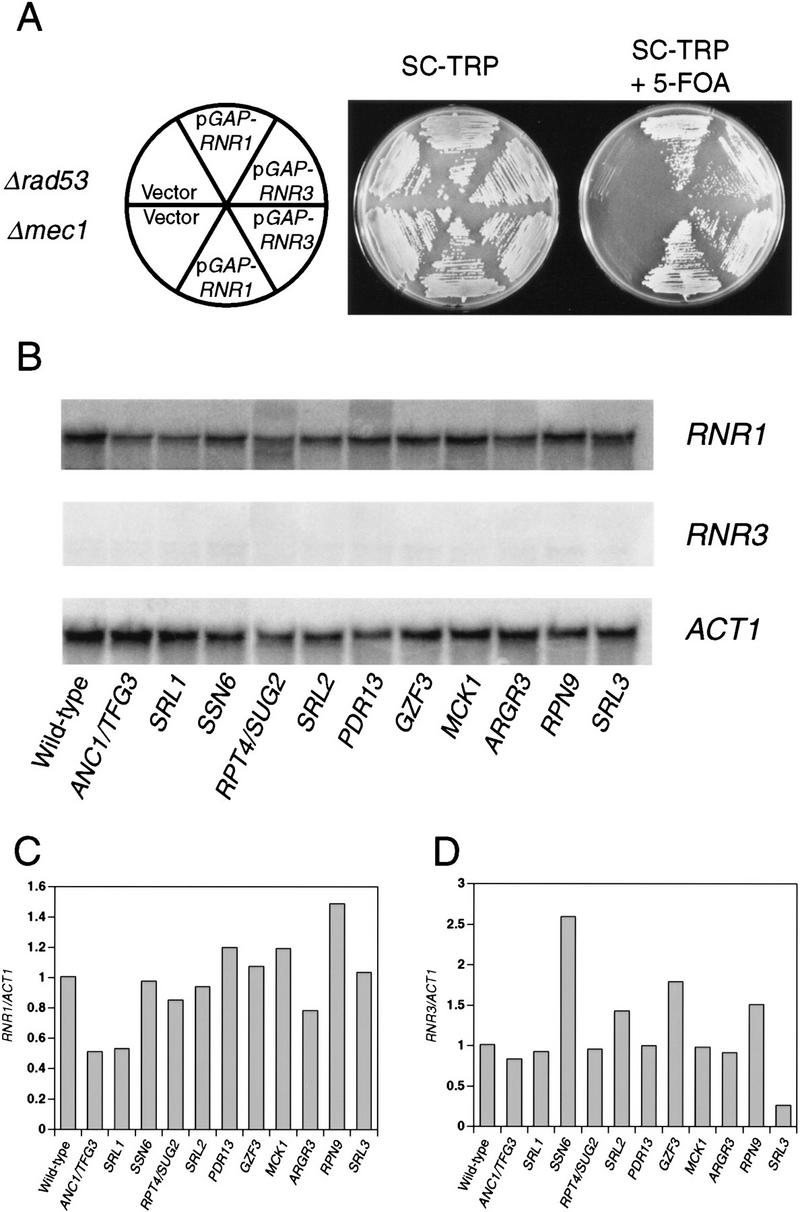
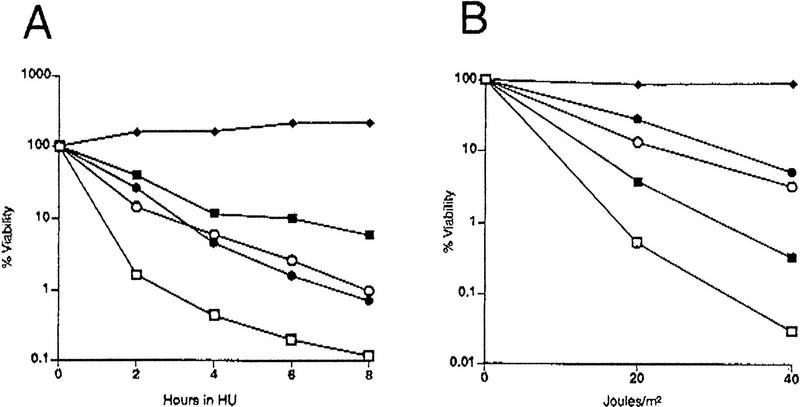
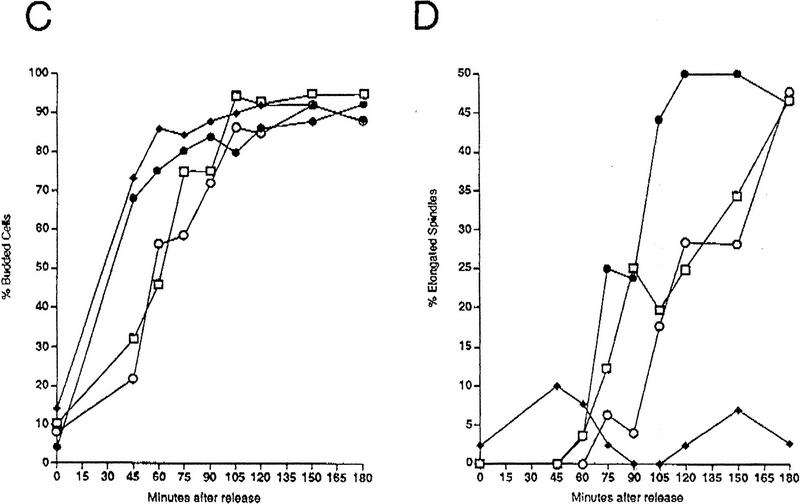
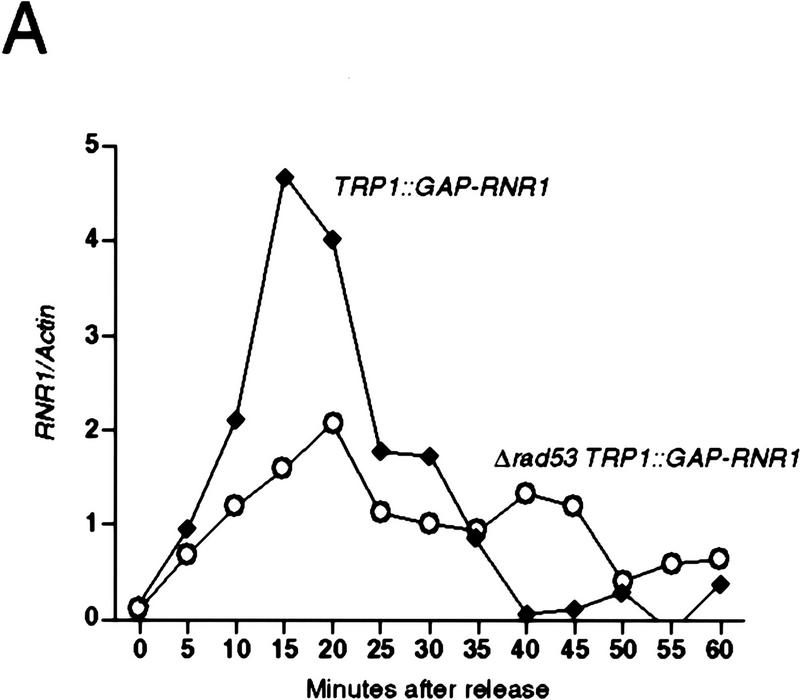
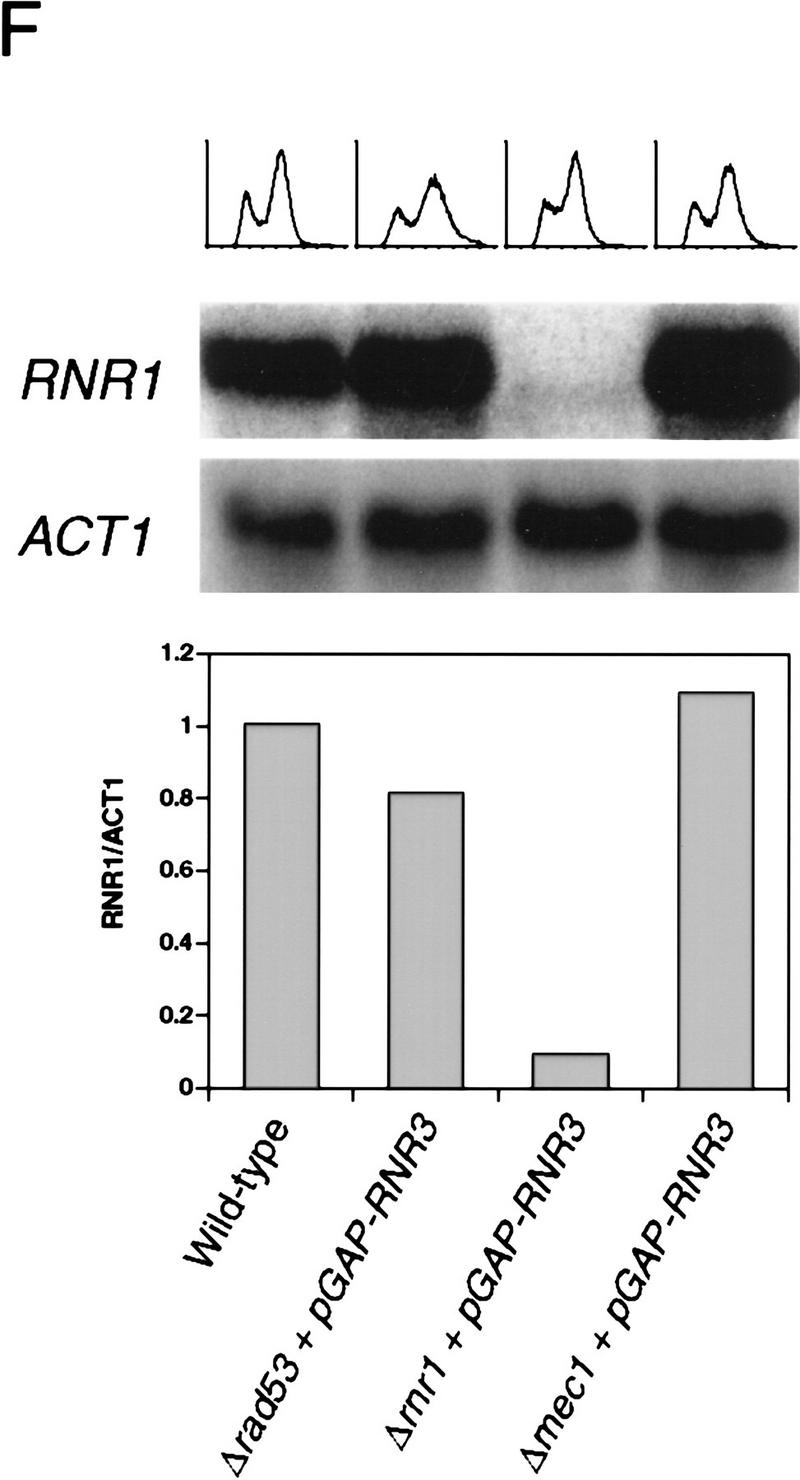
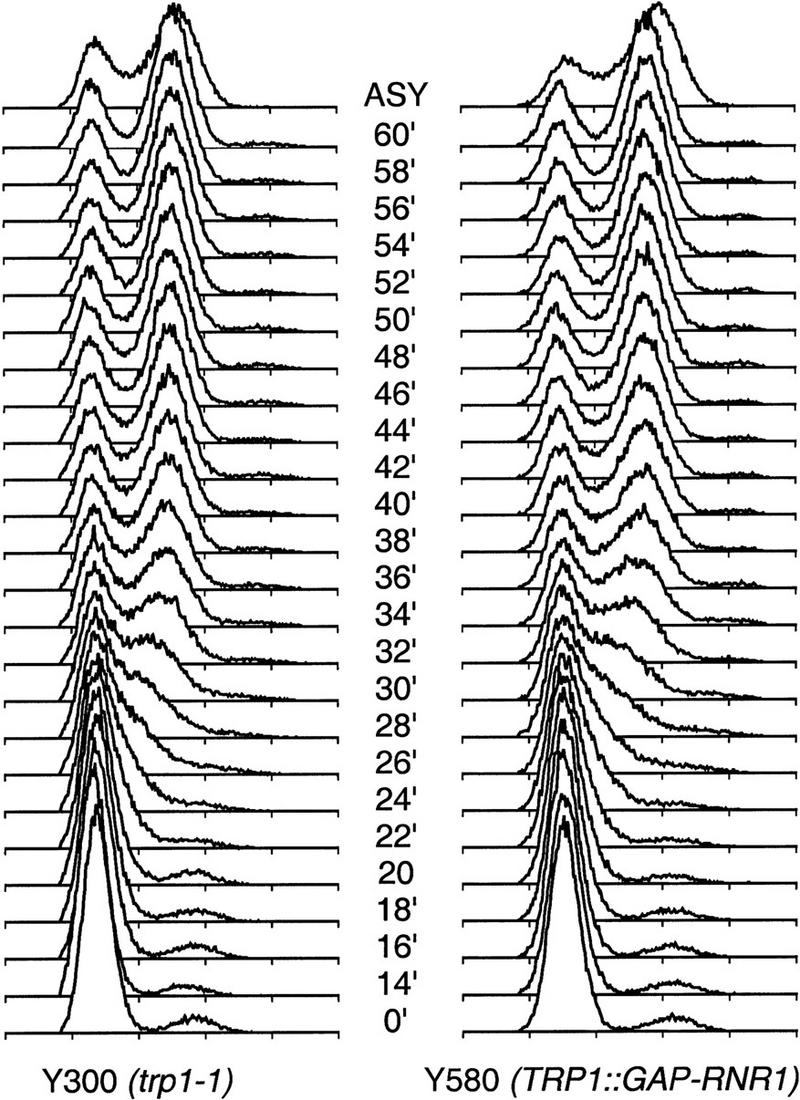
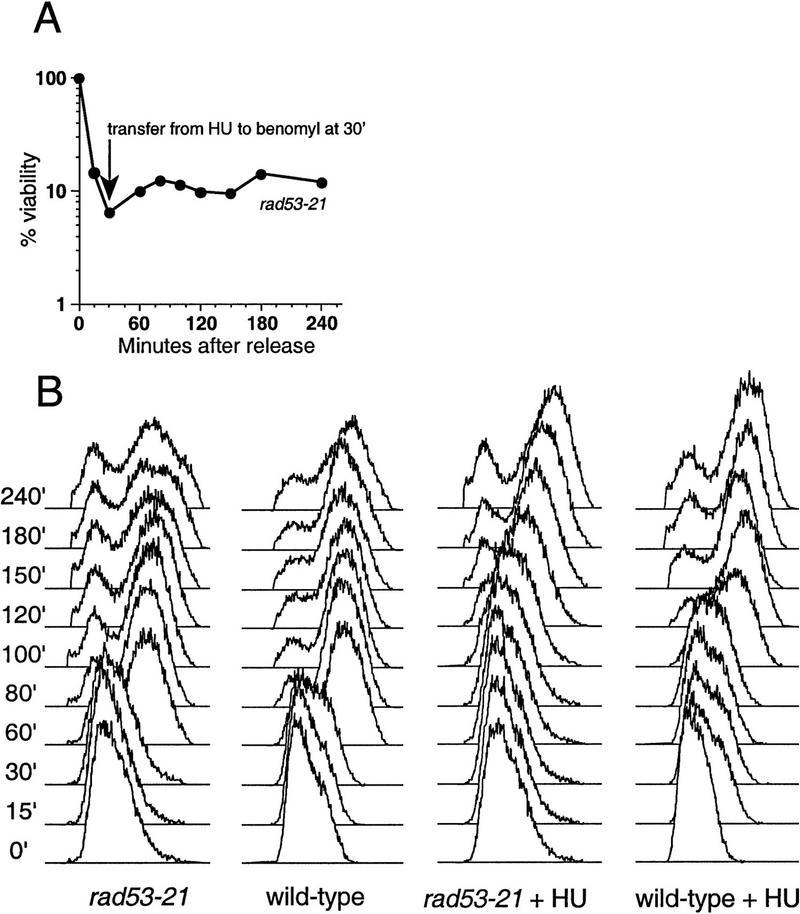
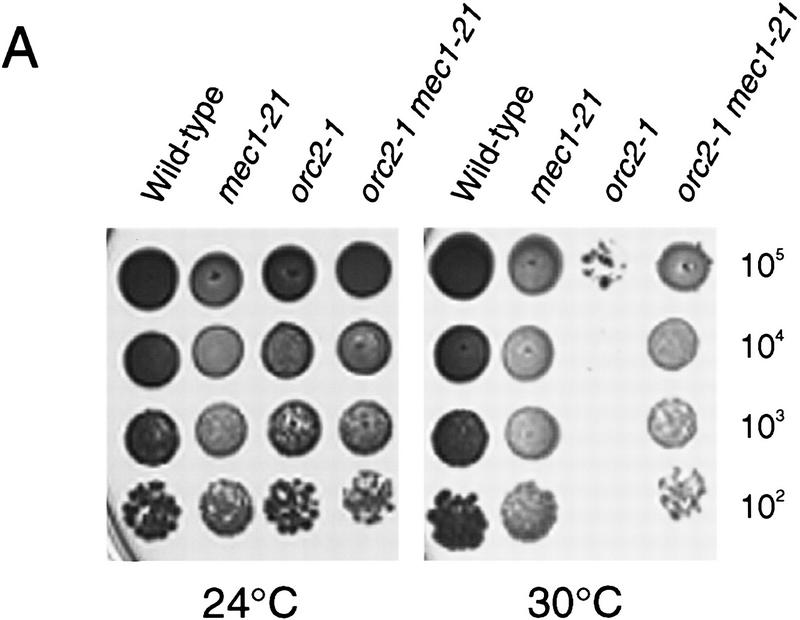
RAD53 and MEC1 are essential genes required for the transcriptional and cell cycle responses to DNA damage and DNA replication blocks. We have examined the essential function of these genes and found that their lethality but not their checkpoint defects can be suppressed by increased expression of genes encoding ribonucleotide reductase. Analysis of viable null alleles revealed that Mec1 plays a greater role in response to inhibition of DNA synthesis than Rad53. The loss of survival in mec1 and rad53 null or point mutants in response to transient inhibition of DNA synthesis is not a result of inappropriate anaphase entry but primarily to an inability to complete chromosome replication. We propose that this checkpoint pathway plays an important role in the maintenance of DNA synthetic capabilities when DNA replication is stressed.


Figures

Figure 1
Figure 1
Suppression of null alleles of rad53 and mec1 by overproduction of RNR1 and other genes. (A) RNR suppression of Δrad53 and Δmec1. Y601, a Δrad53 mutant containing a wild-type copy of RAD53 on a URA3 plasmid, and Y602, a Δmec1 mutant containing a wild-type copy of MEC1 on a URA3 plasmid, were transformed with a TRP plasmid carrying GAP-controlled RNR1 (pBAD70) or RNR3 (pBAD79), or empty vector (pBAD54) as indicated. These transformants were struck onto SC − Trp and SC − Trp + 5-FOA to assess the ability of the null alleles to grow in the presence of the RNR expression plasmids. (B) RNR1 and RNR3 levels in suppressed Δrad53 strains. Y81 (wild-type) and Y324 (Δrad53) strains containing the indicated suppressors were grown to log phase in YPGal at 30°C. Total RNA was prepared and Northern blot analysis was performed using RNR1 (top)-, RNR3 (middle)-, or ACT1 (bottom)-specific probes (see Materials and Methods). (C, D) PhosphorImager quantitation of the Northern blots presented in B. The amount of RNR1 (C) and RNR3 (D) transcript was first normalized to the amount of ACT1 transcript present in each strain and then to the amount of RNR1 or RNR3 present in wild-type cells.
Figure 2
Figure 2
Characterization of checkpoint deficiency of rad53 and mec1 null mutants. (A) Viability in HU of mec1 and rad53 null mutants compared to point mutants. Asynchronously growing log phase cultures were treated with 0.2 m HU. Aliquots were removed at timed intervals to determine cell number and to score for viable colony-forming units on YPD plates. The strains used were Y80 (wild type, ♦), Y301 (rad53-21, •), Y603 (Δrad53 + pGAP–RNR1, ○), Y604 (mec1-21, █), and Y605 (Δmec1 + pGAP–RNR1, □). (B) UV sensitivity of mec1 and rad53 null mutants compared to point mutants. The same strains as in A were grown asynchronously to log phase at 30°C and plated onto YPD. The plates were irradiated at 0, 20, or 40 J/m2, and surviving colony-forming units were calculated. (C) Budding profiles of checkpoint mutants in HU following release from an α-factor block. Log-phase yeast cultures were incubated at 30°C in YPD supplemented with 10 μg/ml α-factor for 3 hr. To release from the block, cultures were washed into YPD lacking α-factor but containing 0.2 m HU, and aliquots were removed at timed intervals and scored for the presence of a bud. The strains used were Y580 (RAD+ MEC+ TRP1::GAP–RNR1, ♦), Y301 (rad53-21, •), Y606 (Δrad53 TRP1::GAP–RNR1, ○), and Y581 (Δmec1 TRP1::GAP-RNR1, □). (D) Kinetics of spindle elongation of checkpoint mutants in HU following release from α-factor. Samples were taken from the same experiment as in C and stained with anti-α-tubulin antibodies. Cells were scored for the presence of an elongated mitotic spindle by indirect immunofluorescence.
Figure 2
Figure 2
Characterization of checkpoint deficiency of rad53 and mec1 null mutants. (A) Viability in HU of mec1 and rad53 null mutants compared to point mutants. Asynchronously growing log phase cultures were treated with 0.2 m HU. Aliquots were removed at timed intervals to determine cell number and to score for viable colony-forming units on YPD plates. The strains used were Y80 (wild type, ♦), Y301 (rad53-21, •), Y603 (Δrad53 + pGAP–RNR1, ○), Y604 (mec1-21, █), and Y605 (Δmec1 + pGAP–RNR1, □). (B) UV sensitivity of mec1 and rad53 null mutants compared to point mutants. The same strains as in A were grown asynchronously to log phase at 30°C and plated onto YPD. The plates were irradiated at 0, 20, or 40 J/m2, and surviving colony-forming units were calculated. (C) Budding profiles of checkpoint mutants in HU following release from an α-factor block. Log-phase yeast cultures were incubated at 30°C in YPD supplemented with 10 μg/ml α-factor for 3 hr. To release from the block, cultures were washed into YPD lacking α-factor but containing 0.2 m HU, and aliquots were removed at timed intervals and scored for the presence of a bud. The strains used were Y580 (RAD+ MEC+ TRP1::GAP–RNR1, ♦), Y301 (rad53-21, •), Y606 (Δrad53 TRP1::GAP–RNR1, ○), and Y581 (Δmec1 TRP1::GAP-RNR1, □). (D) Kinetics of spindle elongation of checkpoint mutants in HU following release from α-factor. Samples were taken from the same experiment as in C and stained with anti-α-tubulin antibodies. Cells were scored for the presence of an elongated mitotic spindle by indirect immunofluorescence.
Figure 3
Figure 3
Kinetics of cell cycle events in rad53 and mec1 deletion mutants. (A) Accumulation of endogenous RNR1 mRNA in a rad53 deletion mutant. Y607 (RAD+ TRP1::GAP–RNR1, ♦) and Y606 (Δrad53 TRP1::GAP–RNR1, ○) were grown at 30°C to log phase and arrested with 10 μg/ml α-factor for 3 hr. Upon release into YPD, aliquots were taken and total RNA was prepared and blotted. The blot was probed with DNA specific to the endogenous RNR1 transcript and also to ACT1 for normalizing to the total amount of RNA in each lane (see Materials and Methods). Quantitation was performed using ImageQuant and the values obtained for each time point were plotted as a function of minutes after α-factor release. (B–E) The data presented in parts B–E all come from the same experiment and employed strains Y580 (MEC+ TRP1::GAP–RNR1, ♦) and Y581 (Δmec1 TRP1::GAP–RNR1, □). (B) Accumulation of endogenous RNR1 mRNA in the mec1 null. RNA was harvested, blotted, and probed and quantitated as in A. (C) Accumulation of CLN2 mRNA in the mec1 deletion mutant. The blot used in B was stripped and reprobed with DNA specific to the CLN2 transcript (see Materials and Methods). (D) Budding profile of the mec1 null mutant. A small aliquot of the cells used in B and C was retained for visual analysis of bud growth. The data are represented as the percentage of the total cells that have elaborated a bud at the indicated times. (E) DNA content of Δmec1 cells as they progress through the cell cycle upon release from an α-factor block. A portion of each aliquot used in parts (B–D) was stained with propidium iodide and analyzed by flow cytometry (see Materials and Methods). (F) Overall RNR1 mRNA levels in asynchronously growing rad53 and mec1 null mutants suppressed by high copy RNR3. Strains were grown to log phase at 30°C in YPD. Total RNA was purified from harvested cells, blotted, and probed with DNA specific for RNR1 and ACT1, as noted. Abundance of RNR1 transcript was calculated as noted in A and B and is represented in the bar graph below the autoradiograms. Above each lane in the autoradiograms the FACS profile of each strain is placed at the time the cells were harvested, indicating that there is a similar cell cycle distribution between them and validating the comparison of mRNA levels. The strains employed were Y692 (TRP+ MEC+), Y608 (Δrad53 + pGAP–RNR3), Y609 (Δrnr1 + pGAP–RNR3), and Y610 (Δmec1 + pGAP–RNR3). Y609 is a deletion of RNR1 that is suppressed by overexpression of RNR3. This provides a control for the specificity of the RNR1 probe used in this experiment.
Figure 3
Figure 3
Kinetics of cell cycle events in rad53 and mec1 deletion mutants. (A) Accumulation of endogenous RNR1 mRNA in a rad53 deletion mutant. Y607 (RAD+ TRP1::GAP–RNR1, ♦) and Y606 (Δrad53 TRP1::GAP–RNR1, ○) were grown at 30°C to log phase and arrested with 10 μg/ml α-factor for 3 hr. Upon release into YPD, aliquots were taken and total RNA was prepared and blotted. The blot was probed with DNA specific to the endogenous RNR1 transcript and also to ACT1 for normalizing to the total amount of RNA in each lane (see Materials and Methods). Quantitation was performed using ImageQuant and the values obtained for each time point were plotted as a function of minutes after α-factor release. (B–E) The data presented in parts B–E all come from the same experiment and employed strains Y580 (MEC+ TRP1::GAP–RNR1, ♦) and Y581 (Δmec1 TRP1::GAP–RNR1, □). (B) Accumulation of endogenous RNR1 mRNA in the mec1 null. RNA was harvested, blotted, and probed and quantitated as in A. (C) Accumulation of CLN2 mRNA in the mec1 deletion mutant. The blot used in B was stripped and reprobed with DNA specific to the CLN2 transcript (see Materials and Methods). (D) Budding profile of the mec1 null mutant. A small aliquot of the cells used in B and C was retained for visual analysis of bud growth. The data are represented as the percentage of the total cells that have elaborated a bud at the indicated times. (E) DNA content of Δmec1 cells as they progress through the cell cycle upon release from an α-factor block. A portion of each aliquot used in parts (B–D) was stained with propidium iodide and analyzed by flow cytometry (see Materials and Methods). (F) Overall RNR1 mRNA levels in asynchronously growing rad53 and mec1 null mutants suppressed by high copy RNR3. Strains were grown to log phase at 30°C in YPD. Total RNA was purified from harvested cells, blotted, and probed with DNA specific for RNR1 and ACT1, as noted. Abundance of RNR1 transcript was calculated as noted in A and B and is represented in the bar graph below the autoradiograms. Above each lane in the autoradiograms the FACS profile of each strain is placed at the time the cells were harvested, indicating that there is a similar cell cycle distribution between them and validating the comparison of mRNA levels. The strains employed were Y692 (TRP+ MEC+), Y608 (Δrad53 + pGAP–RNR3), Y609 (Δrnr1 + pGAP–RNR3), and Y610 (Δmec1 + pGAP–RNR3). Y609 is a deletion of RNR1 that is suppressed by overexpression of RNR3. This provides a control for the specificity of the RNR1 probe used in this experiment.
Figure 4
Figure 4
RNR1 overproduction does not accelerate progression though S phase. DNA replication timing of Y300 (wild type, trp1-1) and Y580 (TRP1::GAP–RNR1) strains is shown. Cells were grown to log phase at 30°C and arrested with 10 μg/ml α-factor for 3 hr. Upon release from the α-factor block into YPD, samples were taken at close intervals and stained with propidium iodide and analyzed by flow cytometry for the purpose of detecting subtle differences in the rate of replication due to RNR1 overproduction.
Figure 5
Figure 5
Inability of a microtubule inhibitor to suppress the lethality of rad53 mutants transiently exposed to HU. (A) Sensitivity of rad53-21 to HU in the presence of benomyl. A rad53-21 strain, Y301, was released from α-factor arrest into 0.25 m HU for 30 min. Following this transient incubation the culture was maintained in 80 μg/ml benomyl, and timed aliquots were plated onto YPD for measurement of viable colony-forming units. (B) FACS analysis of Y301 (rad53-21) and Y300 (wild-type) cultures that had been transiently treated with HU. Wild-type and rad53-21 cultures were released from the G1 block into either 0.25 m HU for 30 min or medium lacking HU, as indicated. At 30 min after α-factor release, cells were washed and transferred into YPD containing 80 μg/ml benomyl. Progress through S phase was monitored by FACS at the indicated time points.
Figure 6
Figure 6
Inability of ρ0 rad53-21 mutants to complete chromosomal replication after a transient HU treatment. Y623 (wild-type ρ0) and Y624 (rad53-21 ρ0) cells were arrested in α-factor for 3 hr and washed into YPD media containing either 10 μg/ml nocodazole or 0.2 m HU and nocodazole. After a 60-min incubation, cells were washed and resuspended into YPD medium containing 10 μg/ml nocodazole only and monitored for viability (A), DNA content (B), and chromosome integrity (C,D). (A) Sensitivity of rad53-21 (•) to transient HU treatment in the presence of nocodazole. Wild-type (♦) is shown for comparison. (B) Flow cytometric analysis of the DNA content of wild-type and rad53-21 strains. Transiently HU-treated cultures are shown at bottom, with the asterisk (*) indicating the time at which the cells were washed out of HU. (Top) Cultures released from α-factor into nocodazole only. (C) CHEF gel of chromosomes from wild-type (left) and rad53-21 (right) strains transiently treated with HU. The vertical bar over each lane indicates time points at which HU was present (shaded bars) or had been washed out (open bars). The two chromosomes that were used in part (D) are indicated. (D) Quantitation of replication of chromosomes from wild-type [ρ0 Chr A (♦) and ρ0 Chr B (⋄)] and rad53-21 [rad53-21 ρ0 Chr A (•) and rad53-21 ρ0 Chr B (○)] cultures that had been transiently treated with HU and resolved by CHEF in C. The two chromosomes examined are indicated in C. The amount of fully duplicated chromosomes in the rad53 mutants precisely correlates with the percentage survival. Intensities of the bands were quantitated using NIH Image software and plotted as a function of time after release from α-factor and plotted in arbitrary units.
Figure 7
Figure 7
Genetic interactions between mec1 mutants and origin-firing mutants. (A) Suppression of orc2-1 by the mec1-21 mutation. Y300 (wild-type), Y604 (mec1-21), Y611 (orc2-1), and Y612 (orc2-1 mec1-21) cultures were grown to log phase in YPD at 24°C. Serial dilutions of 105, 104, 103, and 102 cells were spotted onto YPD plates at either 24°C (left) or 30°C (right). (B) Suppression of Δmec1 by dbf4-1. Representative Δmec1 dbf4-1 double mutants (Y613–Y616) containing MEC1 on a URA3 CEN plasmid (pBAD45) were struck to 5-FOA plates to identify suppressors of the mec1 null mutation. The wild-type and Δmec1 controls that were used in this experiment were isolated from the same cross as the double mutants.
Figure 7
Figure 7
Genetic interactions between mec1 mutants and origin-firing mutants. (A) Suppression of orc2-1 by the mec1-21 mutation. Y300 (wild-type), Y604 (mec1-21), Y611 (orc2-1), and Y612 (orc2-1 mec1-21) cultures were grown to log phase in YPD at 24°C. Serial dilutions of 105, 104, 103, and 102 cells were spotted onto YPD plates at either 24°C (left) or 30°C (right). (B) Suppression of Δmec1 by dbf4-1. Representative Δmec1 dbf4-1 double mutants (Y613–Y616) containing MEC1 on a URA3 CEN plasmid (pBAD45) were struck to 5-FOA plates to identify suppressors of the mec1 null mutation. The wild-type and Δmec1 controls that were used in this experiment were isolated from the same cross as the double mutants.

References

    1. Al-Khodairy F, Fotou E, Sheldrick KS, Griffiths DJF, Lehmann AR, Carr AM. Identification and characterization of new elements involved in checkpoint and feedback controls in fission yeast. Mol Biol Cell. 1994;5:147–160. - PMC - PubMed
    1. Allen JB, Elledge SJ. A family of vectors that facilitate transposon and insertional mutagenesis of cloned genes in yeast. Yeast. 1994;10:1267–1272. - PubMed
    1. Allen JB, Zhou Z, Siede W, Friedberg EC, Elledge SJ. The SAD1/RAD53 protein kinase controls multiple checkpoints and DNA damage-induced transcription in yeast. Genes & Dev. 1994;8:2416–2428. - PubMed
    1. Barlow C, Hirotsune S, Paylor R, Liyanage M, Eckhaus M, Collins F, Shiloh Y, Crawley JN, Ried T, Tagle D, Wynshaw-Boris A. Atm-deficient mice: A paradigm of ataxia telangiectasia. Cell. 1996;86:159–171. - PubMed
    1. Carr AM, Moudjou M, Bentley NJ, Hagan IM. The chk1 pathway is required to prevent mitosis following cell-cycle arrest at ‘start’. Curr Biol. 1995;5:1179–1190. - PubMed

Publication types

MeSH terms