. 1998 Sep 29;95(20):11757-62.
doi: 10.1073/pnas.95.20.11757.

Rapid hybrid speciation in wild sunflowers

Affiliations

Rapid hybrid speciation in wild sunflowers

M C Ungerer et al. Proc Natl Acad Sci U S A. .

Abstract

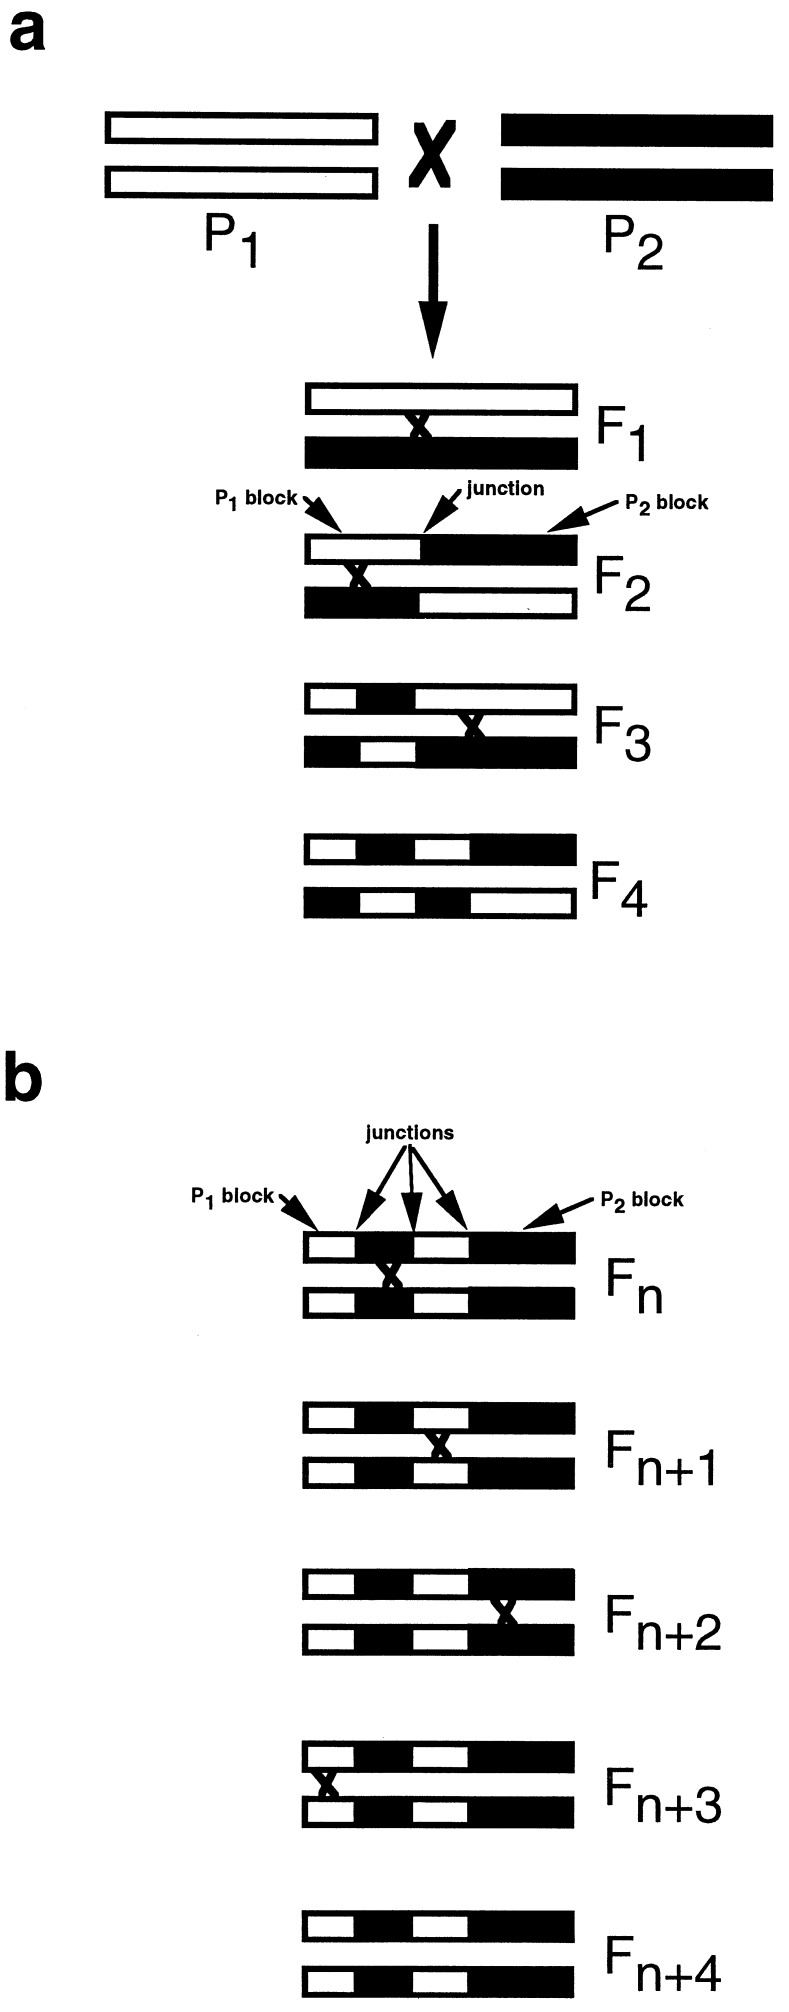
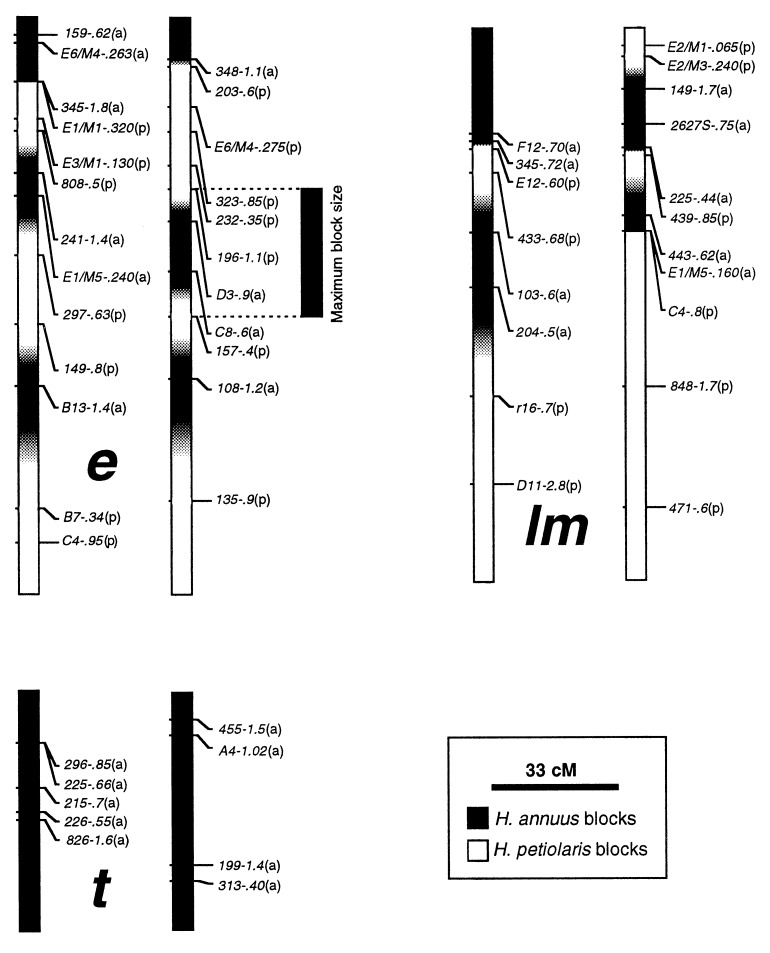
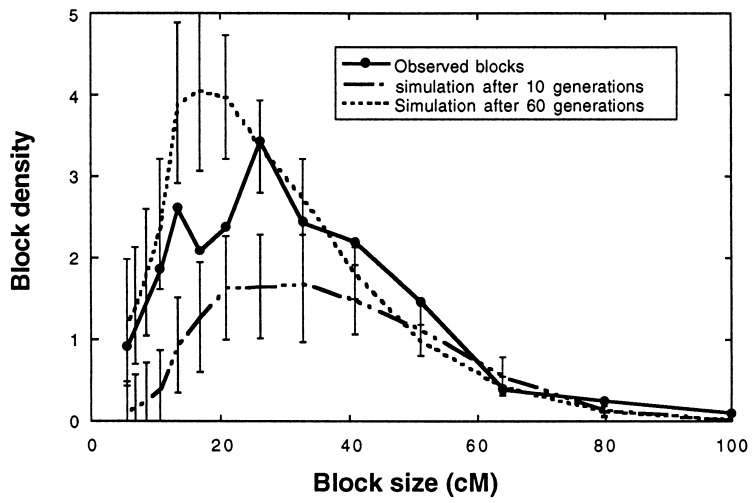
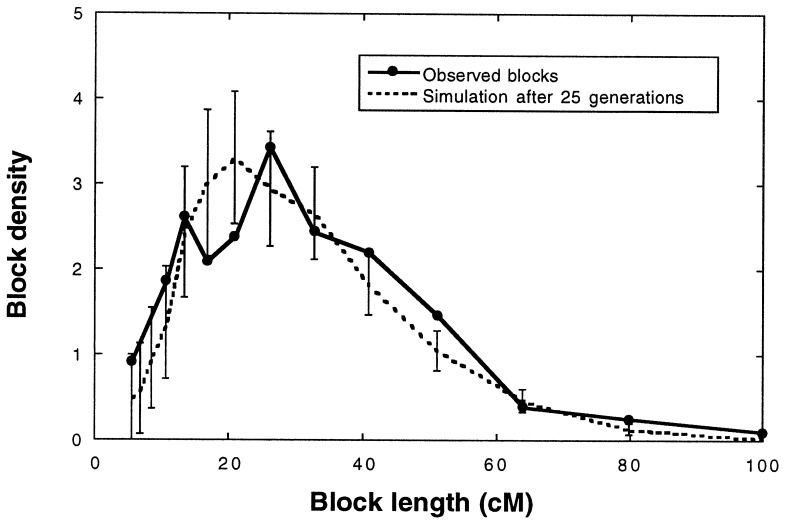
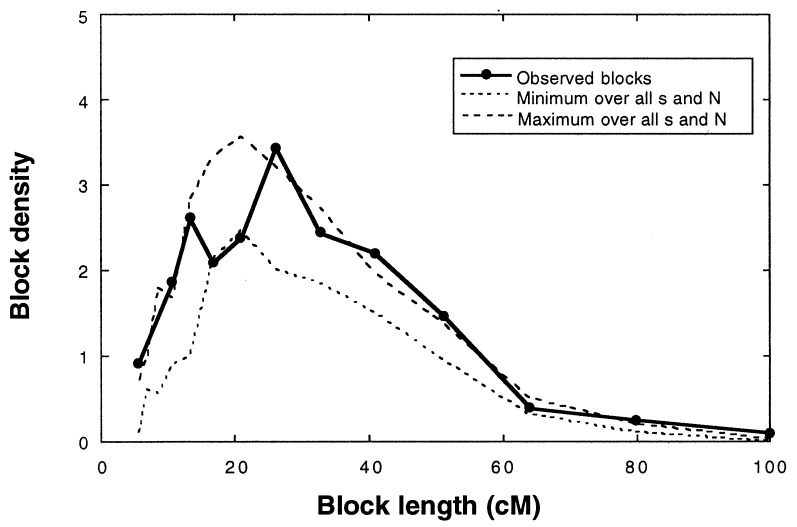
Hybrid or "recombinational" speciation refers to the origin of a new homoploid species via hybridization between chromosomally or genetically divergent parental species. Theory predicts that this mode of speciation is punctuated, but there has been little empirical evidence to support this claim. Here, we test the hypothesis of rapid hybrid speciation by estimating the sizes of parental species chromosomal blocks in Helianthus anomalus, a wild sunflower species derived via hybridization between H. annuus and H. petiolaris. Analysis of the frequency spectrum of parental species chromosomal blocks with respect to predictions based on R. A. Fisher's [Fisher, R. A. (1953) Heredity 8, 187-197] junctions approach, suggests that H. anomalus arose rapidly, probably in fewer than 60 generations. This result is corroborated by independent lines of evidence demonstrating (i) a significant concordance between the genomes of H. anomalus and early generation H. annuus x H. petiolaris synthetic hybrids, and (ii) a rapid recovery of pollen fertility in these synthetic hybrid lineages. These results are not only consistent with theory but also provide a new and general method for estimating the tempo of hybrid speciation and dating the origin of hybrid zones.


Figures

Figure 1
Figure 1
Illustration of the reduction and fixation of parental chromosomal blocks (black vs. white) over successive generations of hybridization. Chiasmata, and hence junction origin, are designated by “x”s between intra-generational chromosomes. (a) Hypothetical scenario demonstrating how parental species chromosomal block size decreases and junction number increases over successive generations of hybridization. (b) When genomic composition becomes fixed or stabilized, no further reduction in block size can occur, despite continued recombination in successive generations.
Figure 2
Figure 2
Selected linkage groups of H. anomalus. Each linkage is represented by two haplotypes, which are derived from the two natural populations of H. anomalus used to generate the mapping population. Large lower case letters between haplotypes designate linkage groups (22). Marker nomenclature includes, from left to right, the primer designation and the size in kilobases of the segregating fragments scored. Letters in parentheses after each marker indicate its parental species origin: a, H. annuus; p, H. petiolaris. Parental genomic composition is indicated by black and white blocks that span the distance between consecutive markers. Regions harboring recombination sites are indicated by a gray-scale, with the intensity of shading based on the genotype of the flanking markers. Maximum block size, which was used for analytical purposes, is illustrated by the H. annuus block to the right of linkage e.
Figure 3
Figure 3
Comparison of the frequency spectra (26) of maximum possible parental species block sizes in the H. anomalus genome to those of simulation populations after 10 and 60 generations of hybridization (n = 500; s = 0). The frequency spectrum shows the number of blocks in a class (block density), scaled by the size of that class (see Materials and Methods) and is the standard way of representing the distribution of block sizes (18, 34). The increase in the area under the curve over time indicates the increasing degree to which the genome is broken up by junctions. (Error bars indicate 95% confidence intervals).
Figure 4
Figure 4
Comparison of the frequency spectra of maximum possible parental species block sizes in the H. anomalus genome to those of simulation populations (cf. Fig. 3) after 25 generations of hybridization (population size = 500; selection coefficient = 0). (Error bars indicate 95% confidence intervals.)
Figure 5
Figure 5
Comparison of the frequency spectra of maximum possible parental species block sizes in the H. anomalus genome to those of simulation populations after 30 generations of hybridization (cf. Fig. 3). Dashed lines indicate the minimum and maximum average block sizes produced by any combination of population size (N) and selection coefficient (s). Note that variation in N and s has minimal effects on block sizes.

Similar articles

Cited by

References

    1. Morgan T H. The Physical Basis of Heredity. Philadelphia: Lippincott; 1919.
    1. Goldschmidt R. The Material Basis of Evolution. New Haven, CT: Yale Univ. Press; 1940.
    1. Eldredge N, Gould S J. In: Models in Paleobiology. Schopf T J M, editor. San Francisco: Freeman; 1972. pp. 82–115.
    1. Charlesworth B, Lande R, Slatkin M. Evolution. 1982;36:474–498. - PubMed
    1. Rosenzweig M L. Science. 1997;277:1622–1623.

Publication types

LinkOut - more resources