. 1998 Oct;64(10):3900-9.
doi: 10.1128/AEM.64.10.3900-3909.1998.

Determination of the biomasses of small bacteria at low concentrations in a mixture of species with forward light scatter measurements by flow cytometry

Affiliations

Determination of the biomasses of small bacteria at low concentrations in a mixture of species with forward light scatter measurements by flow cytometry

BR Robertson et al. Appl Environ Microbiol. 1998 Oct.

Abstract

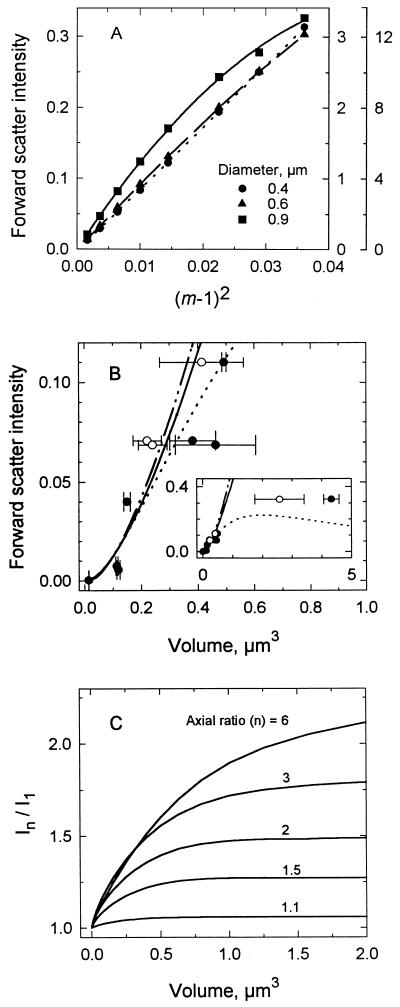
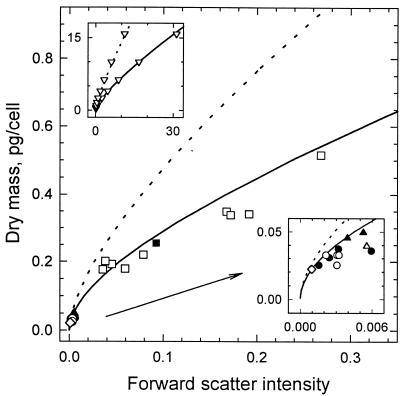
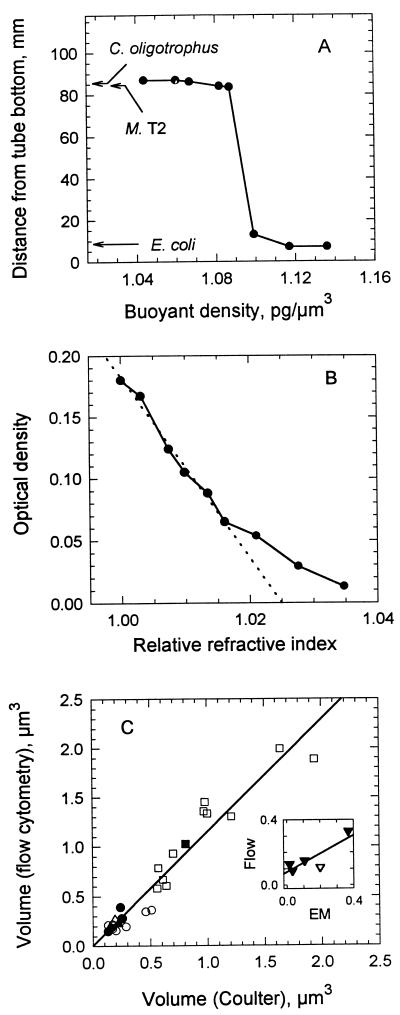
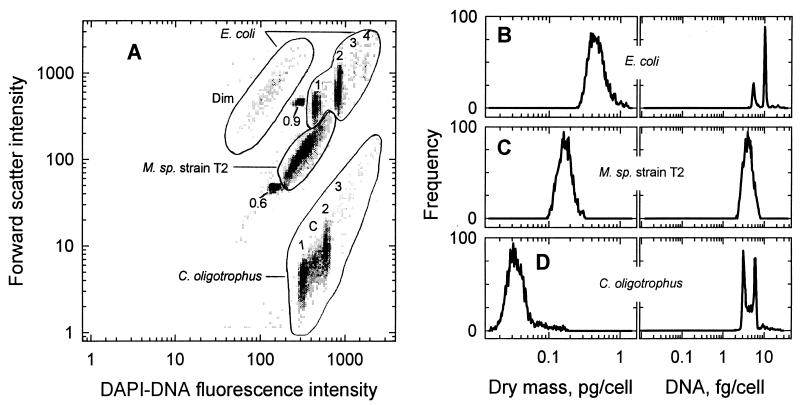
The forward light scatter intensity of bacteria analyzed by flow cytometry varied with their dry mass, in accordance with theory. A standard curve was formulated with Rayleigh-Gans theory to accommodate cell shape and alignment. It was calibrated with an extinction-culture isolate of the small marine organism Cycloclasticus oligotrophus, for which dry weight was determined by CHN analysis and 14C-acetate incorporation. Increased light scatter intensity due to formaldehyde accumulation in preserved cells was included in the standard curve. When differences in the refractive indices of culture media and interspecies differences in the effects of preservation were taken into account, there was agreement between cell mass obtained by flow cytometry for various bacterial species and cell mass computed from Coulter Counter volume and buoyant density. This agreement validated the standard curve and supported the assumption that cells were aligned in the flow stream. Several subpopulations were resolved in a mixture of three species analyzed according to forward light scatter and DNA-bound DAPI (4', 6-diamidino-2-phenylindole) fluorescence intensity. The total biomass of the mixture was 340 &mgr;g/liter. The lowest value for mean dry mass, 0.027 +/- 0.008 pg/cell, was for the subpopulation of C. oligotrophus containing cells with a single chromosome. Calculations from measurements of dry mass, Coulter Counter volume, and buoyant density revealed that the dry weight of the isolate was 14 to 18% of its wet weight, compared to 30% for Escherichia coli. The method is suitable for cells with 0.005 to about 1.2 pg of dry weight at concentrations of as low as 10(3) cells/ml and offers a unique capability for determining biomass distributions in mixed bacterial populations.


Figures

FIG. 1
FIG. 1
Dependence of forward light scatter intensity on particle characteristics. (A) Intensities calculated from Mie theory for three sizes of spheres as a function of m. Ordinate scales increase with particle size. (B) Intensities for latex microspheres of various sizes as predicted by Mie theory when m is 1.04 (—··—) or 1.19 (······) and by Rayleigh-Gans (37) theory (——). Data are measured intensities for microspheres with volumes and indicated standard deviations (error bars) computed according to diameters from electron microscopy reported by the supplier (•) and volumes determined with a Coulter Counter (○). The inset extends the particle size range. (C) Effect of axial ratio on forward light scatter intensity over a range of cell volumes as determined by Rayleigh-Gans theory. In/I1 compares the intensity of a particle with an axial ratio of n to that of a sphere of the same volume.
FIG. 2
FIG. 2
Standard curves for dry mass. Curves were computed for cells with an axial ratio of three and with linear (——) and random (·····) orientations in the flow stream (37) and were calibrated with the dry mass measurement for C. oligotrophus (◊). Data are from light scatter intensities of C. oligotrophus (• and ○), Marinobacter sp. strain T2 (▴ and ▵), and E. coli (■ and □), with dry weights computed from Coulter Counter volumes corrected for cell density on the basis of equations 1 and 3. Closed symbols are for data in Table 4; open symbols are for additional data. The upper inset shows data generated from Rayleigh-Gans theory (▿) and fitted curves and extends computations to larger particle sizes. The lower inset expands data from small organisms.
FIG. 3
FIG. 3
Physical properties of test organisms. (A) Buoyant densities of C. oligotrophus, Marinobacter sp. strain T2 (M. T2), and E. coli from their positions (arrows) in a 70:30 gradient of Percoll-seawater medium. Data are for standard density marker beads. (B) m of C. oligotrophus determined by the minimal-absorbance method (solid line). The broken line is the least squares fit to the data for an optical density of >0.06 and yields an m of 1.025. (C) Cell volume computed from dry mass by flow cytometry, buoyant density, and Xdry/Xwet (equation 3) with respect to Coulter Counter volume measured for the three species. The inset shows cell volumes of C. oligotrophus determined by flow cytometry compared with those determined by transmission (▾) and scanning (▿) electron microscopy (EM).
FIG. 4
FIG. 4
Cell mass and DNA content of subpopulations in a mixture of three species. (A) Bivariate histogram of forward light scatter versus DAPI-DNA fluorescence intensity for the mixture along with the 0.6- and 0.9-μm-diameter microspheres. Whole numbers give the number of chromosome copies contained by cells in various subpopulations. Dim indicates cells of E. coli showing very low fluorescence, and C indicates cells of C. oligotrophus undergoing chromosome replication. M., Marinobacter. (B, C, and D) Distributions of dry mass and DNA content for E. coli, Marinobacter sp. strain T2, and C. oligotrophus, respectively.

References

    1. Ackleson S G, Spinrad R W. Size and refractive index of individual marine particulates: a flow cytometric approach. Appl Optics. 1988;27:1270–1277. - PubMed
    1. Åkerlund T, Nordström K, Bernander R. Analysis of cell size and DNA content in exponentially growing and stationary-phase batch cultures of Escherichia coli. J Bacteriol. 1995;177:6791–6797. - PMC - PubMed
    1. Allman R, Hann A C, Phillips A P, Martin K L, Lloyd D. Growth of Azotobacter vinelandii with correlation of Coulter cell size, flow cytometric parameters and ultrastructure. Cytometry. 1990;11:822–831. - PubMed
    1. Baldwin W W, Kirkish M A, Koch A L. A change in a single gene of Salmonella typhimurium can dramatically change its buoyant density. J Bacteriol. 1994;176:5001–5004. - PMC - PubMed
    1. Baldwin W W, Myer R, Powell N, Anderson E, Koch A L. Buoyant density of Escherichia coli is determined solely by the osmolarity of the culture medium. Arch Microbiol. 1995;164:155–157. - PubMed

LinkOut - more resources