. 1998 Oct;112(4):377-89.
doi: 10.1085/jgp.112.4.377.

Protein rearrangements underlying slow inactivation of the Shaker K+ channel

Affiliations

Protein rearrangements underlying slow inactivation of the Shaker K+ channel

E Loots et al. J Gen Physiol. 1998 Oct.

Abstract

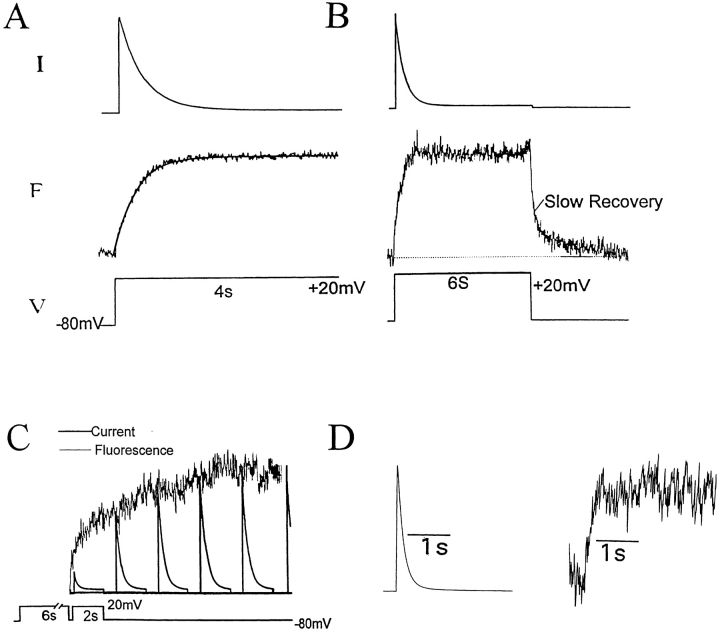
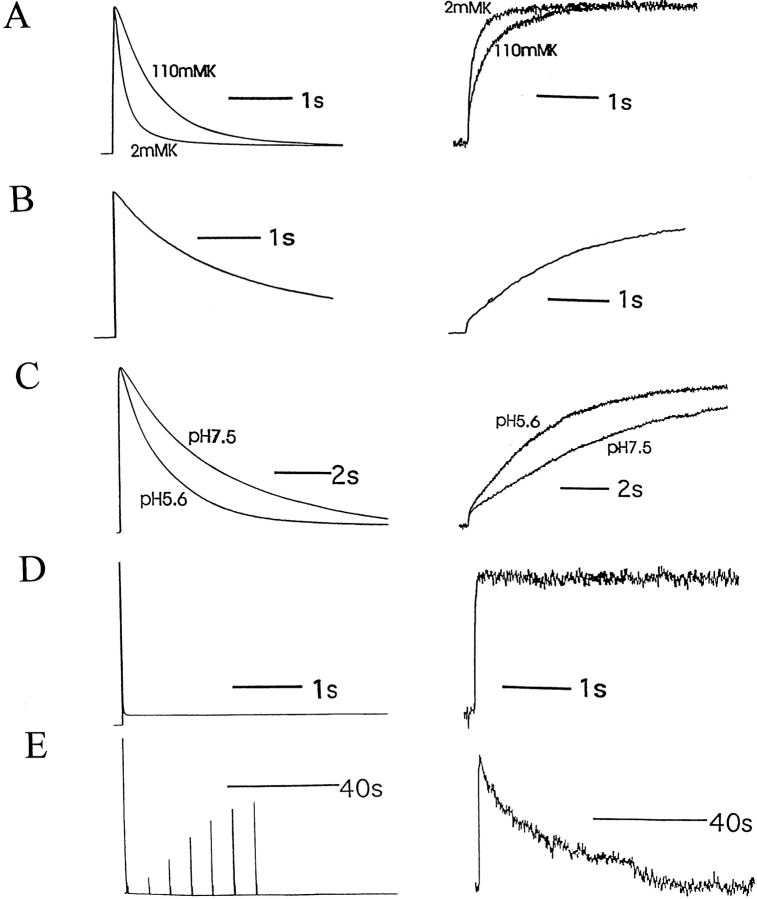
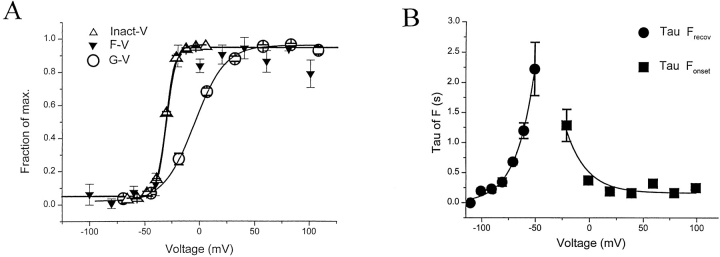
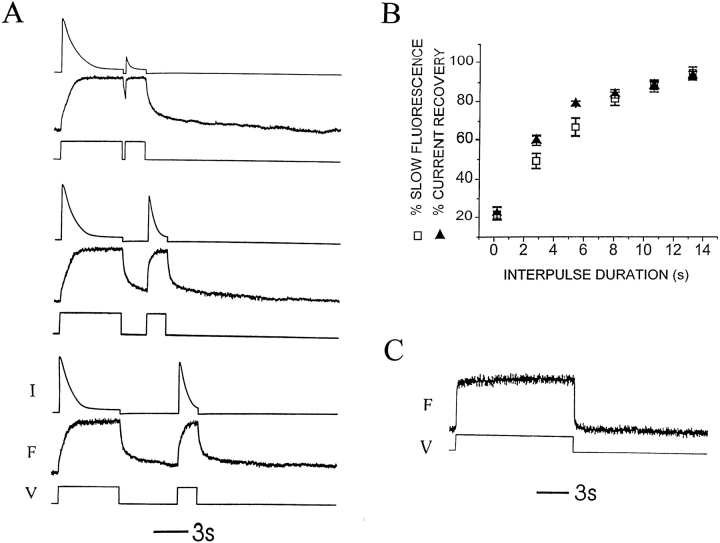
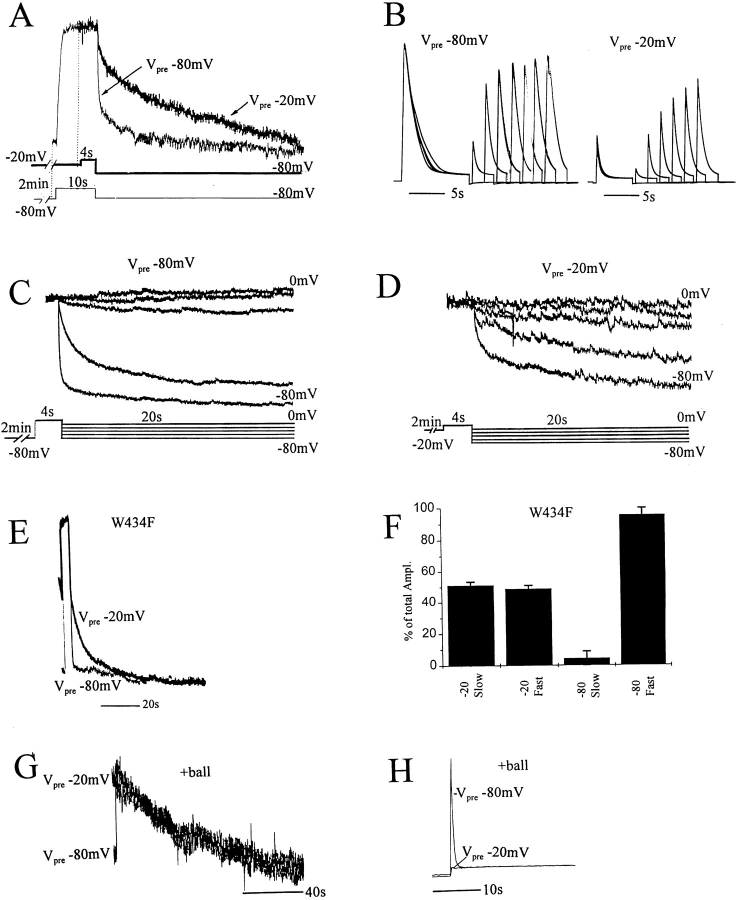
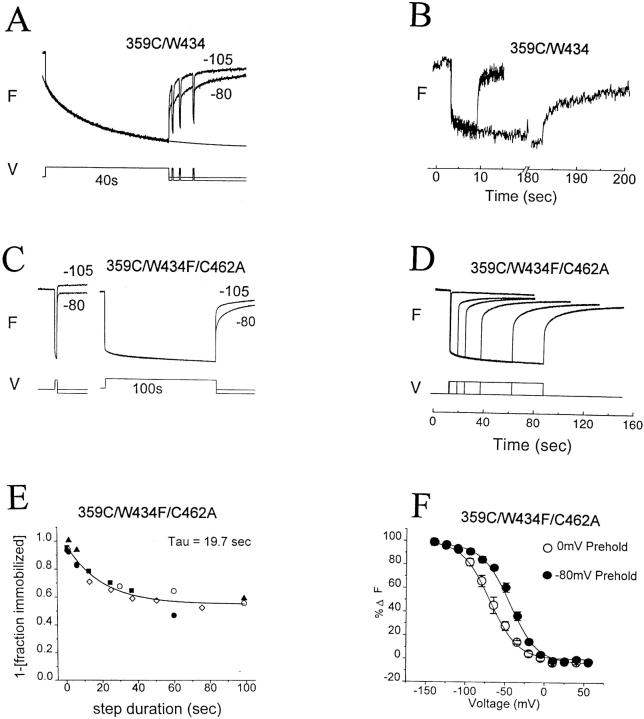
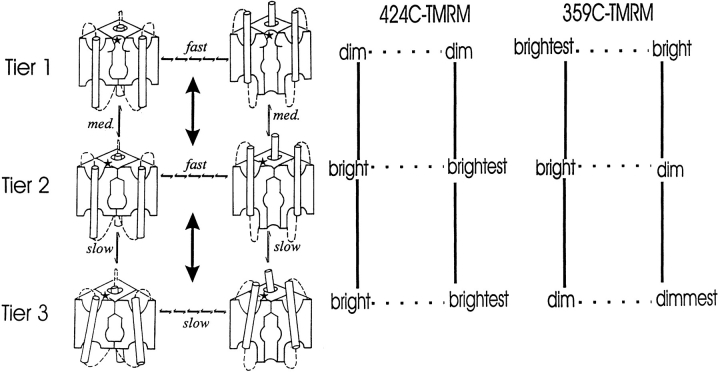
Voltage-dependent ion channels transduce changes in the membrane electric field into protein rearrangements that gate their transmembrane ion permeation pathways. While certain molecular elements of the voltage sensor and gates have been identified, little is known about either the nature of their conformational rearrangements or about how the voltage sensor is coupled to the gates. We used voltage clamp fluorometry to examine the voltage sensor (S4) and pore region (P-region) protein motions that underlie the slow inactivation of the Shaker K+ channel. Fluorescent probes in both the P-region and S4 changed emission intensity in parallel with the onset and recovery of slow inactivation, indicative of local protein rearrangements in this gating process. Two sequential rearrangements were observed, with channels first entering the P-type, and then the C-type inactivated state. These forms of inactivation appear to be mediated by a single gate, with P-type inactivation closing the gate and C-type inactivation stabilizing the gate's closed conformation. Such a stabilization was due, at least in part, to a slow rearrangement around S4 that stabilizes S4 in its activated transmembrane position. The fluorescence reports of S4 and P-region fluorophore are consistent with an increased interaction of the voltage sensor and inactivation gate upon gate closure, offering insight into how the voltage-sensing apparatus is coupled to a channel gate.


Figures

Figure 1
Figure 1
Correlation of slow inactivation of ionic current and fluorescence of 424C-TMRM channels. (A) Fluorescence (F ) increases during a voltage step (V ) with the kinetics of current (I ) inactivation (solid line superimposed on fluorescence trace is time course of current inactivation from a monoexponential fit). Tau for the fluorescence was 300 ± 22 (n = 7) and the Tau for the current decay was 289 ± 31 (n = 6). (B) Upon repolarization, fluorescence recovery consists of fast and slow components. (C ) The slow component of fluorescence recovery follows the kinetics of recovery of the ionic current. The slow component of fluorescence recovery (noisy trace) was taken from B, starting at point indicated, and inverted and superimposed on a series of currents evoked by identical test depolarizations (bottom) given at varying intervals after a 6-s depolarization (not shown). The Taus for the current recovery and fluorescence decay were 2,344 ± 212 and 2,363 ± 205 ms (n = 3), respectively. (D) Fluorescence follows current inactivation in channels predicted to have, at most, only one labelable subunit (1:10 cRNA coinjection ratio of W434/S424C:W434/S424), indicating that the change in fluorescence emission depends on gating-induced changes in TMRM microenvironment, rather than on TMRM–TMRM interaction between subunits. In all cases, depolarization was preceded by 2 min of rest at −80 mV.
Figure 2
Figure 2
424C-TMRM fluorescence (right) follows ionic current inactivation (left) under molecular and ionic conditions that alter inactivation rate. (A) Exchange of external solution from 2 to 110 mM K+ slowed both current inactivation and the rate of fluorescence increase of 424C-TMRM/ W434/C462A channels (τion-onset (110K) = 742 ± 54 ms, n = 6); τfluor-onset (110K) = 689 ± 28 ms, n = 6. (B) Channels with a cysteine restored at position 462 (424C-TMRM/W434/C462) were equally slow in current inactivation and fluorescence increase (τion-onset (C462) = 2,476 ± 345 ms; τfluor-onset (C462) = 2,412 ± 407 ms, n = 10). (C) Exchange of external solution from pH 7.5 to 5.6 accelerated both current inactivation and the rate of fluorescence increase of 424C-TMRM/W434/C462 channels. (D and E) Restoration of the NH2-terminal fast inactivation ball to 424C-TMRM/W434/C462A channels accelerated current inactivation and the rate of fluorescence increase (D) and slowed current and fluorescence recovery (E) compared with control (see Fig. 1). (τion-onset (+ball) = 14 ± 2 ms; τfluor-onset (+ball) = 45 ± 3 ms; n = 8.)
Figure 3
Figure 3
Voltage dependence of current inactivation and 424C-TMRM fluorescence. (A) Voltage dependencies of channel opening (G-V ), fluorescence (F-V ), and current inactivation (Inact-V ). The F–V relations were obtained from measurements of fluorescence 4 s after the start of a step to the indicated test potential (long enough for the fluorescence change to reach steady state at all test potentials). Inact-V relations were obtained from a measure of the fraction of the maximal decline in current evoked by a step to +20 mV, following a 4-s prepulse to the indicated test potential. The G-V was calculated from steady state, leak-subtracted currents assuming Ek = −100 mV. Measurements made in W434/424C-TMRM channels (n = 10). Fits are to single Boltzmann functions. (B) Voltage dependence of the time constants for Fonset (measured from 4-s depolarizations) and Frecov (measured from 20-s long tails to indicated potentials, after a 4-s depolarization to 0 mV). Rate of Fonset appears to be intrinsically voltage independent since it does not change over a wide range of positive potentials. Fits are to single exponentials.
Figure 4
Figure 4
P-type inactivation switches kinetics of 424C-TMRM Fonset from slow to fast. (A) After 3 min at negative voltage (Vhold = −80 mV), Fonset during a 6-s step to +20 mV of 424C-TMRM/ W434/C462A channels is composed of a small fast component and a large slow component. A second depolarization to +20 mV, after a variable interval at −80 mV, evokes an Fonset with a larger fractional contribution of the fast component. The relative amplitude of slow component increases with increasing recovery interval. Note that Frecov also has fast and slow components. Current (top), fluorescence (middle), and voltage (bottom) for three different intervals in the twin pulse experiment. (B) Recovery from inactivation of the ionic current has a similar dependence on interpulse interval, as does the recovery of the slow component of Fonset. The observations are consistent with the distribution of channels into two states: noninactivated (slow Fonset) and inactivated (fast Fonset), with the majority of channels being noninactivated after a long rest at −80 mV. Relative contribution of the two components of Fonset was determined from two exponential fits to the fluorescence increase. Current recovery was calculated as Ipeak (step 2)/Ipeak (step 1). Vhold = −80 mV, Vstep = +20 mV, rest between sets of twin pulses = 3 min. (C) Depolarization (to +20 mV) of 424C-TMRM/W434F channels, after 3 min at −80 mV, evokes fluorescence changes with only a fast component to the onset and recovery, consistent with the W434F mutation maintaining channels in the inactivated (fast fluorescent) state. This identifies the 424C-TMRM fast fluorescence conformation with the W434F P-type inactivated state and implies that the slow fluorescence change in response to depolarization of resting state of wild-type W434 channels is the entry into the P-type inactivated state.
Figure 5
Figure 5
C-type inactivation slows recovery of both 424C-TMRM fluorescence and ionic current. (A and B) Recovery slowed by prolonged predepolarization. After 2 min at either −80 mV (Vpre −80 mV) or −20 mV (Vpre −20 mV), the oocyte was depolarized to +20 mV, and then returned to Vhold = −80 mV. Longer depolarizations were used for Vpre −80 mV (10 s) than for Vpre −20 mV (4 s) to allow the slower increase in fluorescence and slower current inactivation of Vpre −80 mV to reach steady state. (Vpre −20 mV and Vpre −80 mV were done in succession for each oocyte.) (A) Frecov of 424C-TMRM/W434/C462A after a step to +20 mV was slowed by a 2-min prepolarization to −20 mV (Vpre −20 mV) compared with control (Vpre −80 mV). This was a consistent finding in 10 oocytes. (B) Recovery of ionic current from inactivation seen in twin pulses to +20 mV requires longer intervals after a 2-min prepolarization to −20 mV (Vpre −20 mV) compared with control (Vpre −80 mV). Interval between sets of twin pulses was 2 min at Vpre −80 mV or Vpre −20 mV, with a 2.5 s return to −80 mV before the step. Responses to twin pulses at varying intervals are superimposed. (C and D) Voltage dependence of Frecov of 424C-TMRM/W434/C462A after a 4-s depolarization to +20 mV is altered when the step is preceded by a 2-min prepolarization to either −80 (C) or −20 (D) mV. Responses are from a single oocyte, with D recorded first. Successive responses to identical steps returning to different tail potentials (from −80 to 0 mV, in 20-mV increments) are superimposed. Traces are normalized to the maximum observed fluorescence change for this oocyte. (E and F ) Frecov of 424C-TMRM/ W434F/C462A in response to a step to +20 mV is mainly fast after a 2-min prepolarization to −80 mV (Vpre −80 mV). 2-min prepolarization to −20 mV (Vpre −20 mV) converts approximately half of this fast Frecov to a slow recovery. Two exponential fits to Frecov in fluorescent traces as in E yield component amplitudes shown in F. Note that Frecov after prepolarization to −20 mV is faster in W434F (E) than in W434 (A). (G and H ) Fluorescence (G) and ionic current (H ) recovery of 424C-TMRM/W434/C462A channels with the NH2-terminal ball intact (same protocol as in A). (G) Frecov is as slow after prepolarization to −80 mV (Vpre −80 mV) as prepolarization to −20 mV (Vpre −20 mV). This rate is approximately equal to that of ball-deleted channels prepolarized to −20 mV (A), suggesting that the ball accelerates entry into the C-type inactivated state.
Figure 6
Figure 6
Fluorescence of 359C-TMRM reflects activation, and P- and C-type inactivation. (A and B) Fluorescence change of 359C-TMRM/C245/ W434/C462 in response to depolarization (after a 2-min rest at Vhold = −80 mV). (A) The fluorescence change (step to 0 mV) has both fast and slow components. (Note that the fast component of Fonset is approximately equal in amplitude to the fast component of Frecov when Vtail = Vhold = −80 mV). The slow component of Fonset follows the inactivation of the ionic current (time course of solid line is from fit to ionic current), suggesting that a rearrangement around 359 accompanies closure of the inactivation gate. Return to a more negative (−105 mV) tail potential than Vhold accelerates the slow recovery. Brief depolarizations during tails of −80 mV evoke fast Fonset similar to that of the first depolarization. (B) Long (3-min) depolarization (from Vhold = −80 mV to Vstep = +20 mV) reduces the amplitude of the fast component of Frecov and slows the slow component (compare with A). (C and D) Fluorescence change of 359C-TMRM/C245/W434F/C462A in response to depolarization (to 0 mV after a 2-min rest at Vhold = −80 mV). (C) Short depolarization yields mainly fast components of Fonset and Frecov. Long depolarization evokes a small slow component of Fonset and alters Frecov by reducing the amplitude of the fast component and further slowing the slow component. Responses are superimposed for tail potentials of −80 and −105 mV. (D) The degree of reduction in amplitude of the fast component of Frecov increases with increasing duration of depolarization, roughly in parallel to the slow decrease of fluorescence during the step. (E) Relation of reduction in amplitude (immobilization) of the fast component of Frecov to step duration, measured from traces such as D. Data from five oocytes (each oocyte = one symbol) combined and fit to a single exponential (solid line). (F ) Long (2-min) predepolarization (to 0 mV) shifts, in the negative direction, the voltage dependence of the fast fluorescence–voltage relation. Fluorescence was measured at the end of 200-ms steps to indicated potentials that are primarily from the fast component of fluorescence change. Steps were given at 4-s intervals to permit recovery from small amounts of inactivation induced by positive steps from Vhold = −80 mV, or to permit reentry into the inactivated state after small amounts of recovery during negative steps from Vhold = 0 mV. Data from five oocytes. Note that return to a more negative (−105 mV) tail potential than Vhold (−80 mV) makes the fast component larger in the recovery for both W434 (A) and W434F/C462A (C) because a larger fraction of S4s enter their resting conformation.
Figure 7
Figure 7
Gating model of slow inactivation. (left) The scheme depicts proposed conformations of S4, the internal activation gate, and the external inactivation gate in channels with the external inactivation gate open (Tier 1), or closed in the P-type (Tier 2) or C-type (Tier 3) inactivated conformations (*attachment site 424 in the NH2-terminal end of the P-region). The model is based on observations of the relative brightness of TMRM at attachment sites 424 in the P-region (middle) and 359 in S4 (right). P-type inactivation (Tier 12) and its recovery (Tier 21) are, respectively, the rearrangements that close and open the external gate. C-type inactivation (Tier 23) and its recovery (Tier 32) are, respectively, the rearrangements that stabilize and destabilize the closed conformation of the external gate. Depolarization drives channels to the right in all tiers so that they extrude their S4s, open their internal activation gates, and are favored to enter the next tier down. Hyperpolarization drives channels to the left, closes the activation gate, retracts the S4s, and drives channels to higher tiers. Gating in Tier 1 does not alter the fluorescence of 424C-TMRM (the small fast component of Fonset after rest at −80 mV is taken to represent a minority of channels in Tier 2 at the resting potential), but does produce a fluorescence change in 359C-TMRM. In Tiers 2 and 3, the external slow inactivation gate is closed and both 424C-TMRM and 359C-TMRM follow transmembrane movement of S4. Tier 3 has slower deactivation kinetics than Tier 2, due to stabilization of the S4 extruded conformation. This stabilization may involve a rearrangement around S4 (possibly in the P-region, not depicted), or, as depicted, a tilt in S4. The W434F mutation stabilizes the P-type inactivated closed conformation, concentrating channels in Tier 2 while still permitting excursions to Tier 3.

References

    1. Baker OS, Larsson HP, Mannuzzu LM, Isacoff EY. Three transmembrane conformations and sequence-dependent displacement of the S4 domain in Shaker K+channel gating. Neuron. 1998;20:1283–1294. - PubMed
    1. Baukrowitz T, Yellen G. Modulation of K+ current by frequency and external [K+]: a tale of two inactivation mechanisms. Neuron. 1995;15:951–960. - PubMed
    1. Baukrowitz T, Yellen G. Use-dependent blockers and exit rate of the last ion from the multi-ion pore of a K+channel. Science. 1996;271:653–656. - PubMed
    1. Bezanilla F, Perozo E, Papazian D, Stefani E. Molecular basis of gating charge immobilization in Shakerpotassium channels. Science. 1991;254:679–683. - PubMed
    1. Boland L, Jurman M, Yellen G. Cysteines in the ShakerK channel are not essential for channel activity or zinc modulation. Biophys J. 1994;66:694–699. - PMC - PubMed

Publication types

Substances