. 1998 Oct;112(4):433-46.
doi: 10.1085/jgp.112.4.433.

Permeation and gating of an inwardly rectifying potassium channel. Evidence for a variable energy well

Affiliations

Permeation and gating of an inwardly rectifying potassium channel. Evidence for a variable energy well

H Choe et al. J Gen Physiol. 1998 Oct.

Abstract

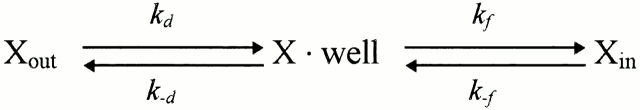
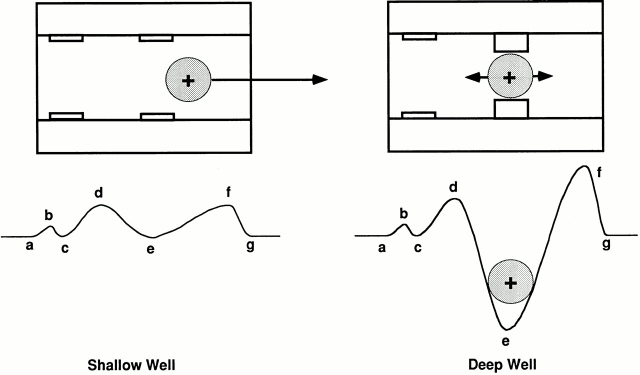
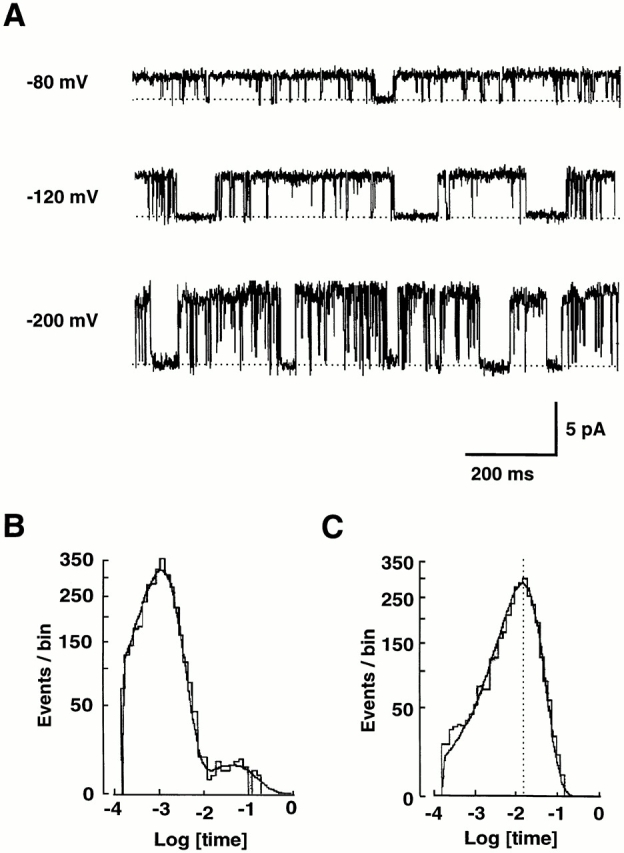
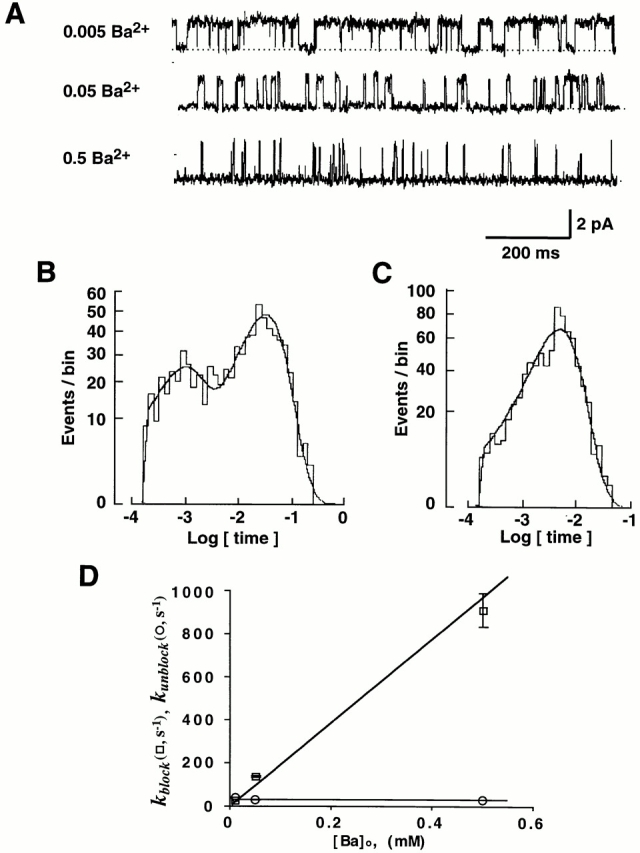
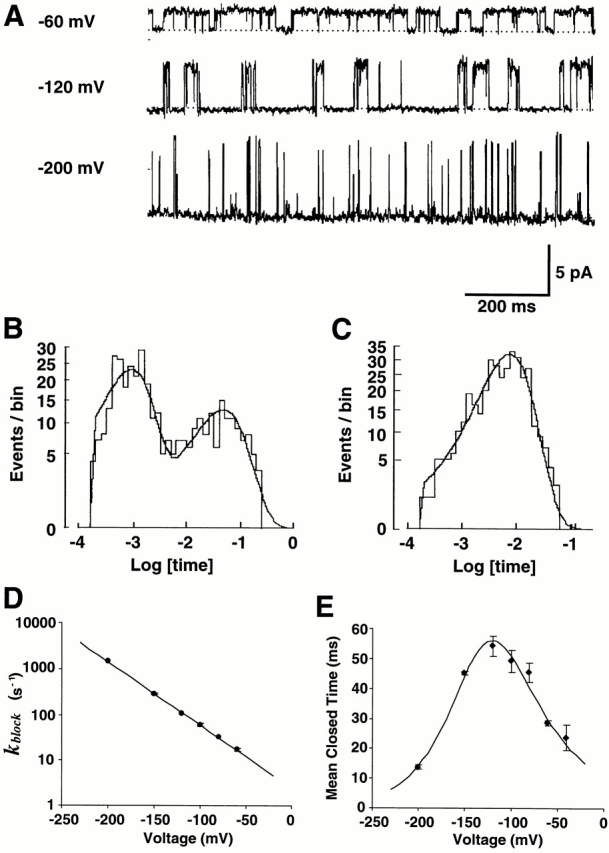
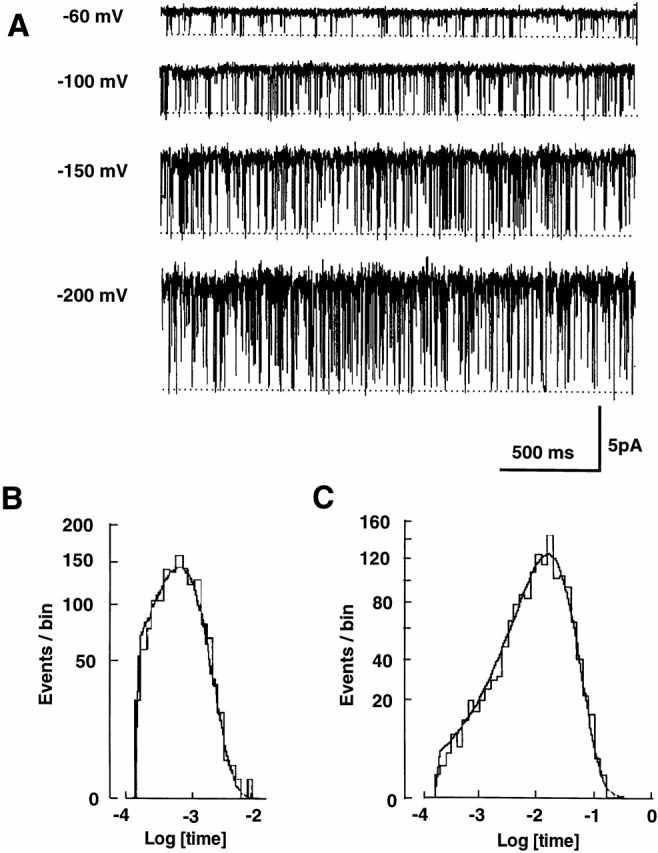
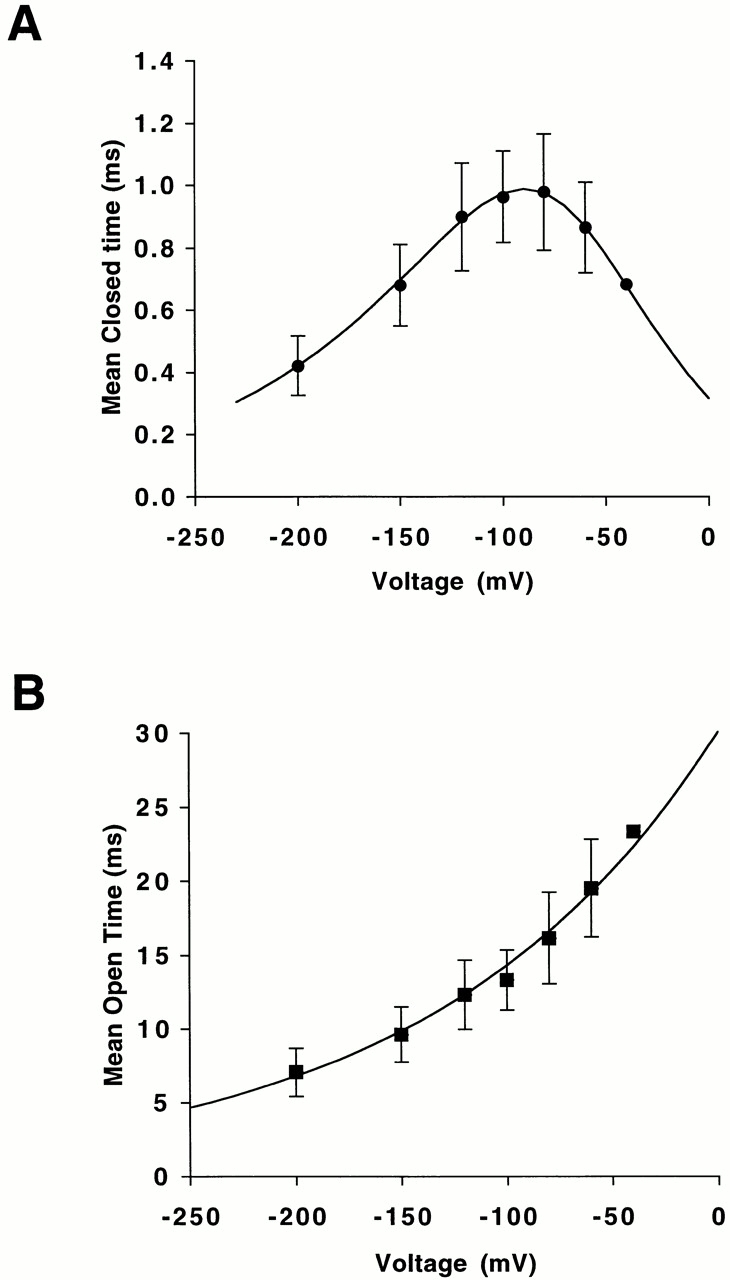
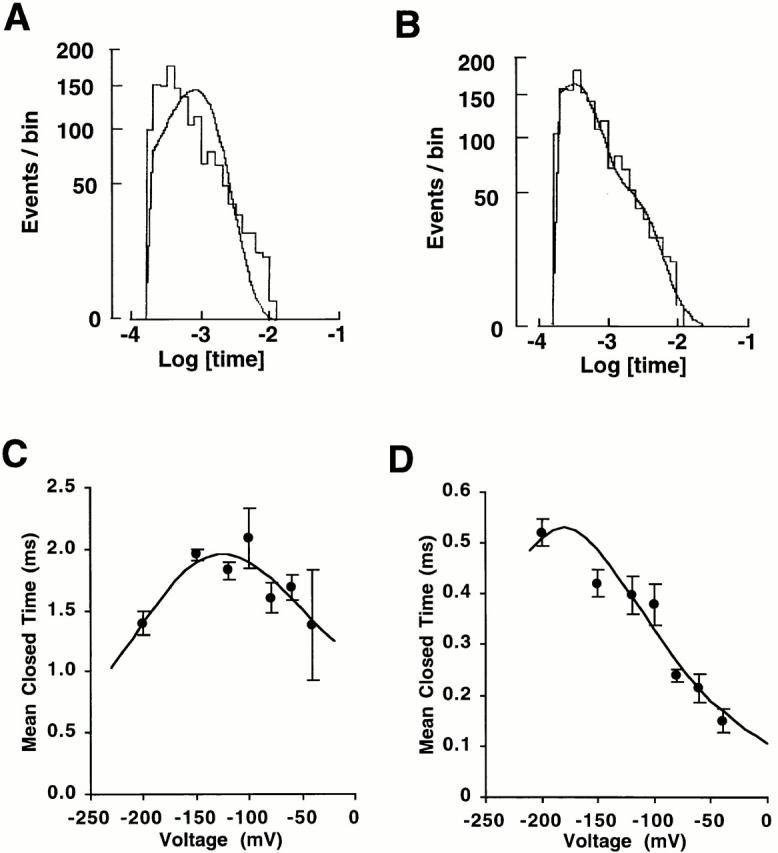
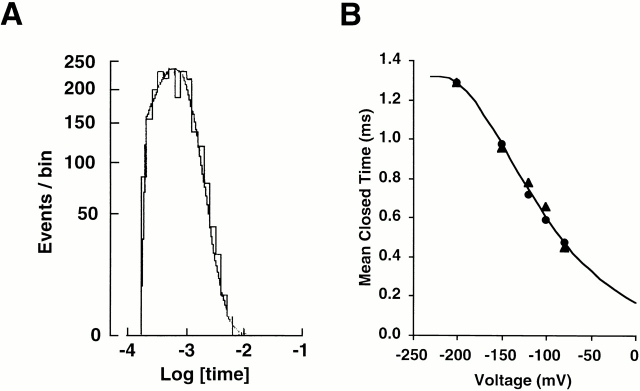
Permeation, gating, and their interrelationship in an inwardly rectifying potassium (K+) channel, ROMK2, were studied using heterologous expression in Xenopus oocytes. Patch-clamp recordings of single channels were obtained in the cell-attached mode. The gating kinetics of ROMK2 were well described by a model having one open and two closed states. One closed state was short lived (approximately 1 ms) and the other was longer lived (approximately 40 ms) and less frequent (approximately 1%). The long closed state was abolished by EDTA, suggesting that it was due to block by divalent cations. These closures exhibit a biphasic voltage dependence, implying that the divalent blockers can permeate the channel. The short closures had a similar biphasic voltage dependence, suggesting that they could be due to block by monovalent, permeating cations. The rate of entering the short closed state varied with the K+ concentration and was proportional to current amplitude, suggesting that permeating K+ ions may be related to the short closures. To explain the results, we propose a variable intrapore energy well model in which a shallow well may change into a deep one, resulting in a normally permeant K+ ion becoming a blocker of its own channel.


Figures

Scheme I
Scheme I
Figure 12
Figure 12
A variable intrapore energy well model. (A) Two energy wells, designated c and e, in the pore of ROMK2. Both are shallow such that most K+ ions pass through the channel easily (left). However, when the inner well (e) deepens, a permeating K+ ion is trapped (right). (B) Energy profiles for K+ trapped in the deep well at 0, −100, and −300 mV (top) under the condition of 110 K+ solution. The fractional distance refers to the fraction of the transmembrane electric field sensed, with the extracellular and intracellular boundaries set at 0 and 1, respectively. (C) Energy barriers as a function of voltage under the condition of 110 K+ solution. As the membrane potential becomes more negative, the heights of the outer (ΔU 2, solid line) and inner (ΔU 3, broken line) barrier increase and decrease, respectively. A trapped ion preferentially crosses the outer barrier between 0 and −110 mV and the inner barrier between −110 and −300 mV (dotted line).
Figure 13
Figure 13
Hypothetical mechanism for the variable energy well. The pore of ROMK2 has a binding site comprised of four identical elements that can move in a radial direction. The elements may move toward a cation occupying the binding site to coordinate and trap the ion, closing the channel.
Figure 1
Figure 1
ROMK2 has two closed and one open states. (A) Single-channel K+ currents in a cell-attached patch from a Xenopus oocyte expressing ROMK2. Pipette solution contained the control solution. High bath K+ (110 mM) depolarized oocytes, and the voltage at the left of each record is the negative of the applied pipette potential and is presumed to approximate the potential difference across the patch (oocyte relative to pipette). Upward deflections from the closed state (dashed line) correspond to inward K+ current. The long closures at −120 mV appear to be longer than those at −80 and −200 mV. (B) Histogram of closed times at −100 mV. The histogram is fit with two exponential distributions with time constants of 1.4 and 47 ms. 99% of closures are accounted for by the short time constant. (C) Histogram of open times at −100 mV. The histogram is fit with one exponential distribution with a time constant of 17 ms.
Figure 2
Figure 2
Voltage dependence of mean closed and open time. (A) Closed times. The smooth lines are fitted lines with Eq. 6. The best-fit values for the long closed state are ΔU 2 = 15 kBT, δ2 = −0.30, ΔU 3 = 20 kBT, and δ3 = 0.26 (top line). The best-fit values for the short closed state are ΔU 2 = 12 kBT, δ2 = −0.33, ΔU 3 = 15 kBT, and δ3 = 0.33 (bottom line). Data represent means ± SEM for five to eight experiments. (B) Open times. The line is fitted with Eq. 4. The best fit values were ΔU 1 = 3 kBT and δ1 = 0.24. The value of A was set to 0.90 based on the result of Fig. 10 C. Data represent means ± SEM for five to eight experiments.
Figure 10
Figure 10
Effect of K+ concentration on the gating of ROMK2. (A) Single channel K+ currents with 10, 110, and 500 K+ solutions in the pipette. V = −120 mV. (B) Mean open times with 10 (▪), 110 (•), and 500 (▴) K+ solutions in the pipette plotted as functions of voltage. The data were fit with Eq. 4. The best fit values were ΔU 1 = 3.4 kBT and δ1 = 0.20. The values of A for 500, 110, and 10 K+ were 1.37, 0.90, and 0.42, respectively. Data points represent 3 (500 K+), 3 (10 K+), and 5–13 (110 K+) experiments. (C) Mean closed times with 10 (▪), 110 (•), and 500 (▴) K+ in the pipette plotted as functions of voltage. The 110 K+ data contain data from experiments with 110 K+, 1 Cs+, 0.1 Cs+, 0.01 Cs+, 10 Na+, and 10 Li+ solution. The data were fit simultaneously with Eq. 6. The best fit values are ΔU 2 = 12 kBT, δ2 = −0.24, and δ3 = 0.42. The values of ΔU 3 are 14, 15, and 18 kBT for 500, 110, and 10 K+, respectively. Data points represent 3 (500 K+), 3 (10 K+), and 5–13 (110 K+) experiments.
Figure 3
Figure 3
Ba2+ increases the number of long closures. (A) Single-channel K+ currents with 0.5, 0.05, and 0.005 mM Ba2+ in the pipette. The voltage was −60 mV in each case. (B) Histogram of closed times with 0.05 mM Ba2+ at −60 mV. The line represents the best fit with two exponential distributions with time constants of 0.9 ms (31% of closures) and 31.5 ms (69% of closures). (C) Histogram of open times with 0.05 mM Ba2+ at −60 mV. The line represents the best fit with one exponential with a time constant of 5.4 ms. (D) Blocking rates, k block, and unblocking rates, k unblock, as a function of Ba2+ concentration at −60 mV. k block was calculated with Eq. 8. The line for the k block is the best fit with the function, k block = A · [Ba2+]o, where A is 1.94 · 106 s−1 M−1. k unblock was obtained from the inverse of long closed time. The line for the k unblock represents the mean value of 29 s−1. Data are from four, four, and six experiments with 0.5, 0.05, and 0.005 mM Ba2+, respectively.
Figure 4
Figure 4
Ba2+ shows biphasic voltage-dependent off rates. (A) Single-channel K+ currents with 0.005 mM Ba2+ solution in the pipette. There are more long closures compared with those with control solution as shown in Fig. 1 A. The durations of long closures at −120 mV appear to be longer than those at −60 and −200 mV. (B) Histogram of closed times with 0.005 mM Ba2+ at −100 mV. The line represents the best fit with two exponential distributions with time constants of 1.0 ms (63% of closures) and 49.8 ms (37% of closures). (C) Histogram of open times with 0.005 mM Ba2+ at −100 mV. The line represents the best fit with one exponential with a time constant of 8.5 ms. (D) Blocking rates of Ba2+ as a function of voltage. Eq. 3 was used to fit the data. The best-fit values were ΔU 1 = 6 kBT and δ1 = 0.40. Data represent means ± SEM for three to six experiments. (E) Mean dwell time of long closures as a function of voltage. The data were fit with Eq. 6 (solid line). The values of the best fit were ΔU 2 = 15 kBT, δ2 = −0.24, ΔU 3 = 21 kBT, and δ3 = 0.28.
Figure 5
Figure 5
EDTA eliminates long closures. (A) Single channel K+ currents with 5 mM EDTA in the 110 K+ solution. The long closures were rarely seen. (B) Closed-time histogram at −80 mV. The histogram was fit well with one exponential distribution with a time constant of 1.0 ms. (C) Open-time histogram at −80 mV. The histogram was fit well with one exponential distribution with a time constant of 17 ms.
Figure 6
Figure 6
Voltage dependence of mean closed and open time with EDTA. (A) Closed times. The lines are fit with Eq. 6. The best-fit values were ΔU 2 = 12 kBT, δ2 = −0.24, ΔU 3 = 15 kBT, and δ3 = 0.42. Data represent means ± SEM for three to six experiments except −40 mV (n = 1). (B) Open times. The line is obtained from Eq. 4. The best-fit values are ΔU 1 = 3.3 kBT and δ1 = 0.20. The value of A was set to 0.90 based on the result of Fig. 10 C. Data are from the same experiments as in A.
Figure 7
Figure 7
10 mM Rb+ + 110 mM K+ solution in the pipette. (A) Closed-time histogram at −100 mV. A single exponential did not adequately describe the histogram. (B) A good fit to the data in A was obtained with two exponential distributions with time constants of 0.3 ms (74%) and 1.9 ms (26%). (C) Voltage dependence of longer short closed times. The values of the best fit obtained with Eq. 6 were ΔU 2 = 13 kBT, δ2 = −0.10, ΔU 3 = 16 kBT, and δ3 = 0.18. Data from three experiments. (D) Voltage dependence of shorter short closed times. The values of the best fit obtained with Eq. 6 were ΔU 2 = 10 kBT, δ2 = −0.15, and ΔU 3 = 16 kBT. δ3 was set to be 0.2. Data from three experiments.
Figure 8
Figure 8
Effect of Rb+ only (110 Rb+) solution in the pipette. (A) Closed-time histogram at −100 mV. The histogram was well described by one exponential distribution with a time constant of 0.65 ms. (B) Voltage dependence of closed times. The values of the best fit obtained with Eq. 9 were ΔU 2 = 11 kBT, δ2 = −0.15, and ΔU 3 = 17 kBT. δ3 was set to be 0.2. Individual data from two experiments are shown.
Figure 9
Figure 9
The effect of Cs+ on the mean open time and single channel current. (A) Currents with 1 mM Cs+ solution in the pipette. (B) Voltage dependence of mean open time. Data from four to five experiments. (C) Voltage dependence of single channel current. The line is the best fit with Eq. 10 to the data from −20 to −120 mV. Best fit values were K i = 16.4 mM and δ = 0.60. Data from four to five experiments.
Figure 11
Figure 11
Rate of entering the short closed state as functions of voltage (A) and current amplitude (B). Symbols are 110 K+ (♦), 500 K+ (□), 10 K+ (▴), 1 Cs+ (○), 0.1 Cs+ (▪), 0.01 Cs+ (▵), 10 Na+ (×), and 10 Li+ (⋄). The straight line in B is a linear regression line with slope of 23 and y intercept of 17 (correlation coefficient = 0.985).

References

    1. Begenisich T, Danko M. Hydrogen ion block of the sodium pore in squid giant axons. J Gen Physiol. 1983;82:599–618. - PMC - PubMed
    1. Bennett WS, Jr, Steitz TA. Structure of a complex between yeast hexokinase A and glucose. II. Detailed comparisons of conformation and active site configuration with the native hexokinase B monomer and dimer. J Mol Biol. 1980;140:211–230. - PubMed
    1. Blatz AL, Magleby KL. Correcting single channel data for missed events. Biophys J. 1986;49:967–980. - PMC - PubMed
    1. Boim MA, Ho K, Shuck ME, Bienkowski MJ, Block JH, Slightom JL, Yang Y, Brenner BM, Hebert SC. ROMK inwardly rectifying ATP-sensitive K+channel. II. Cloning and distribution of alternative forms. Am J Physiol. 1995;268:F1132–F1140. - PubMed
    1. Chen D, Xu L, Tripathy A, Meissner G, Eisenberg B. Permeation through the calcium release channel of cardiac muscle. Biophys J. 1997;73:1337–1354. - PMC - PubMed

Publication types