. 1998 Oct 5;143(1):95-106.
doi: 10.1083/jcb.143.1.95.

An atypical PKC directly associates and colocalizes at the epithelial tight junction with ASIP, a mammalian homologue of Caenorhabditis elegans polarity protein PAR-3

Affiliations

An atypical PKC directly associates and colocalizes at the epithelial tight junction with ASIP, a mammalian homologue of Caenorhabditis elegans polarity protein PAR-3

Y Izumi et al. J Cell Biol. .

Abstract

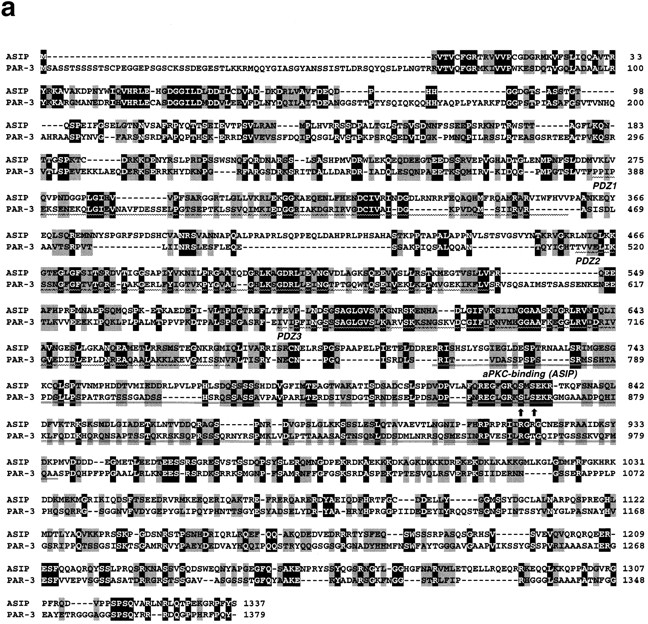
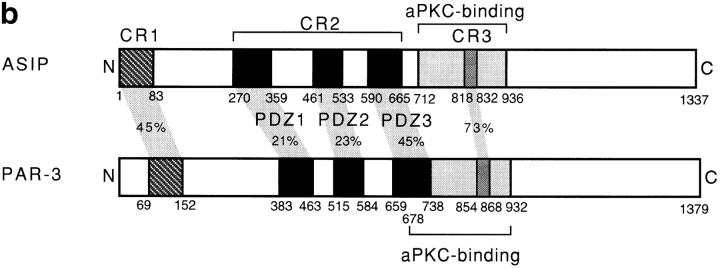
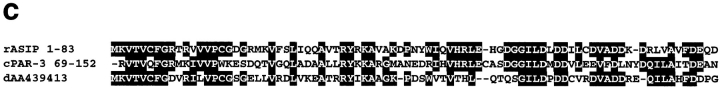
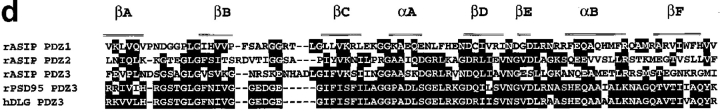
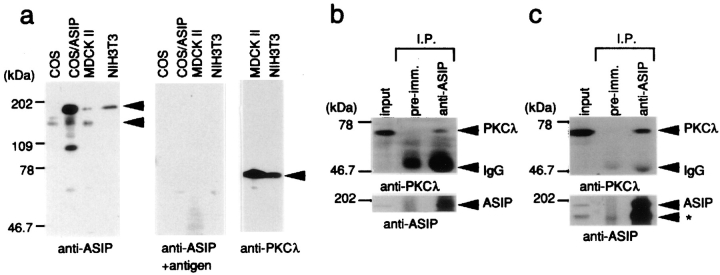
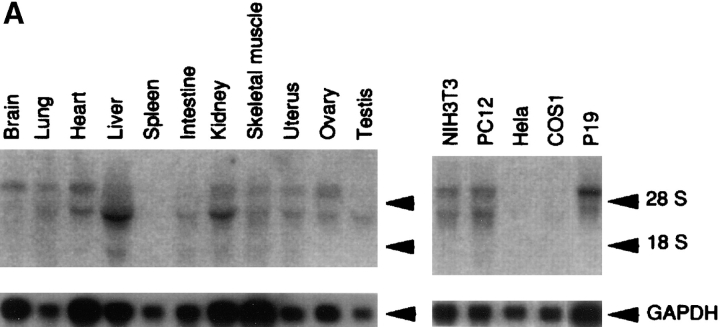
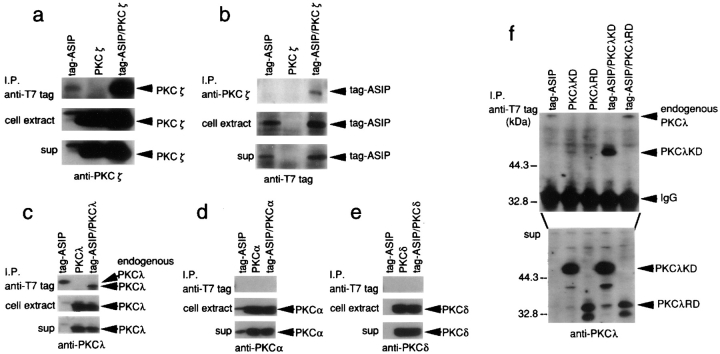
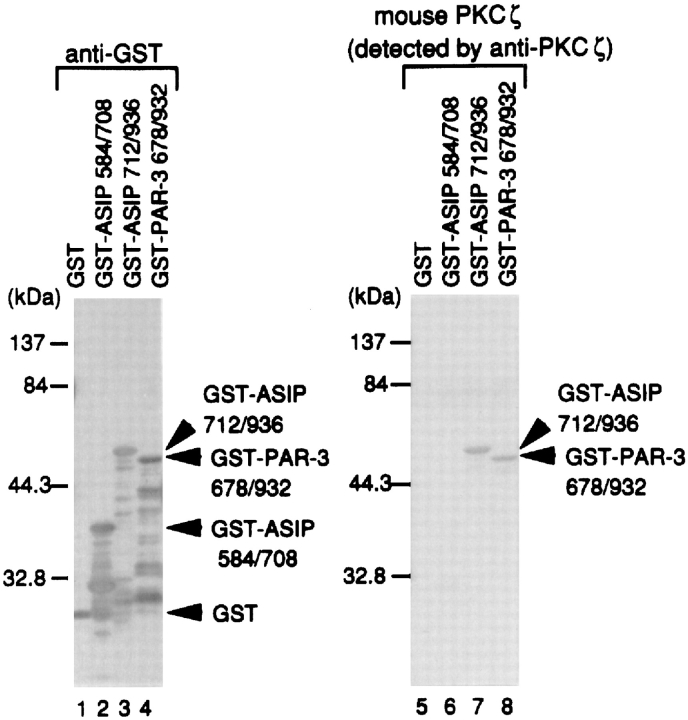
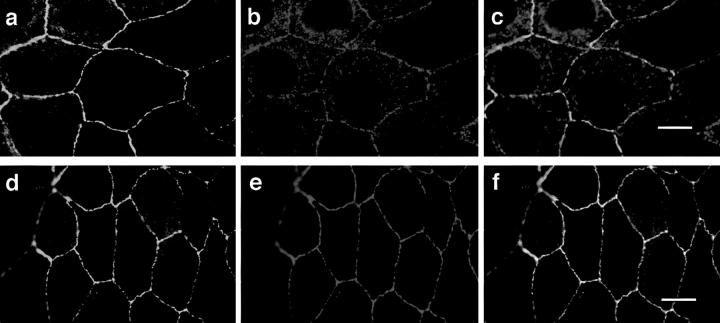
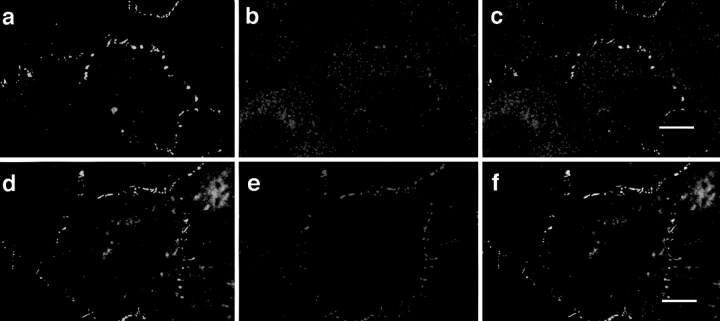
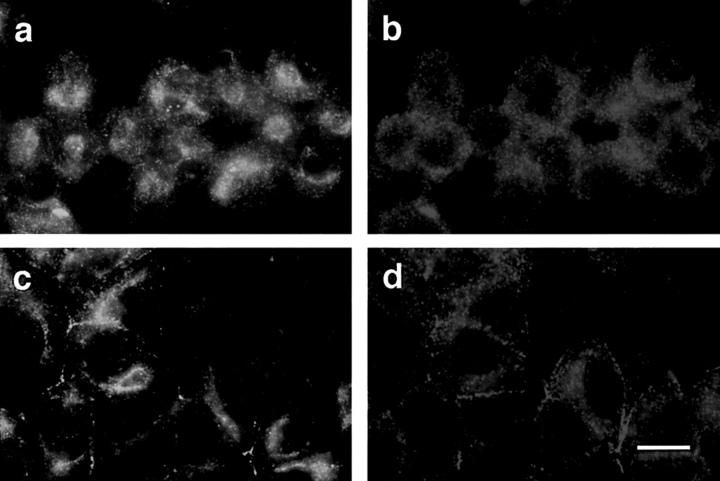
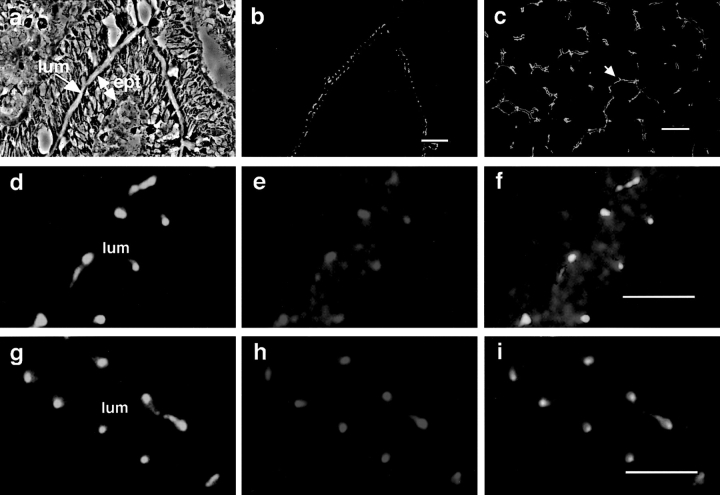
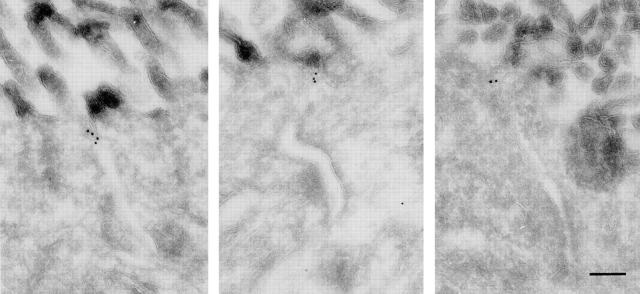
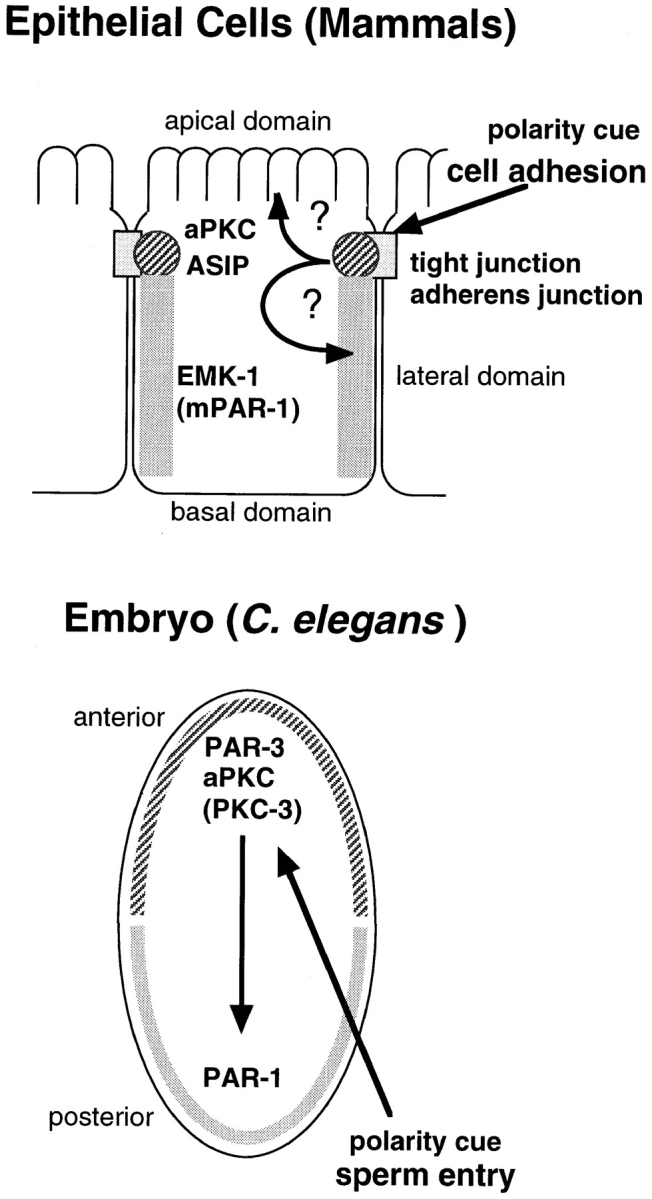
Cell polarity is fundamental to differentiation and function of most cells. Studies in mammalian epithelial cells have revealed that the establishment and maintenance of cell polarity depends upon cell adhesion, signaling networks, the cytoskeleton, and protein transport. Atypical protein kinase C (PKC) isotypes PKCzeta and PKClambda have been implicated in signaling through lipid metabolites including phosphatidylinositol 3-phosphates, but their physiological role remains elusive. In the present study we report the identification of a protein, ASIP (atypical PKC isotype-specific interacting protein), that binds to aPKCs, and show that it colocalizes with PKClambda to the cell junctional complex in cultured epithelial MDCKII cells and rat intestinal epithelia. In addition, immunoelectron microscopy revealed that ASIP localizes to tight junctions in intestinal epithelial cells. Furthermore, ASIP shows significant sequence similarity to Caenorhabditis elegans PAR-3. PAR-3 protein is localized to the anterior periphery of the one-cell embryo, and is required for the establishment of cell polarity in early embryos. ASIP and PAR-3 share three PDZ domains, and can both bind to aPKCs. Taken together, our results suggest a role for a protein complex containing ASIP and aPKC in the establishment and/or maintenance of epithelial cell polarity. The evolutionary conservation of the protein complex and its asymmetric distribution in polarized cells from worm embryo to mammalian-differentiated cells may mean that the complex functions generally in the organization of cellular asymmetry.


Figures

Figure 1
Figure 1
Sequence similarity between ASIP and PAR-3. (a) Amino acid sequence alignment of rat ASIP and C. elegans PAR-3. Alignment was done using the GeneStream align program (http: //genome.eerie.fr/bin/align-guess.cgl). Residues with black and shaded backgrounds indicate amino acid identity and similarity, respectively. PDZ domains (wavy underlining) and the aPKC-binding region (double underlining; see Fig. 5) are indicated. Arrows indicate potential PKC phosphorylation sites in the CR3. Dashes represent sequence gaps. (b) Schematic view of the ASIP and PAR-3 structures. Typical conserved regions—CR1, CR2, and CR3—are shown. The aPKC-binding region shown is that sufficient for a direct interaction with aPKC (see Fig. 5). (c) Amino acid sequence alignment of the NH2-terminal region of rat ASIP with C. elegans PAR-3 and Drosophila AA439413. Residues with a black background indicate amino acid identity. The amino acid sequence of Drosophila AA439413 is encoded by residues 137–401 of the nucleic acid sequence. (d) Amino acid sequence alignment of the PDZ domain of ASIP with the third PDZ domain of rat PSD95 and human DLG. Residues with a black background indicate amino acid identity. The six β sheets (βA–βF) and the two α helices (αA and αB) present in the structure of the third PDZ domain of rat PSD95 (Doyle et al., 1996) and human DLG (Cabral et al., 1996) are indicated in the upper alignment. r, rat; c, C. elegans; d, Drosophila; h, human.
Figure 1
Figure 1
Sequence similarity between ASIP and PAR-3. (a) Amino acid sequence alignment of rat ASIP and C. elegans PAR-3. Alignment was done using the GeneStream align program (http: //genome.eerie.fr/bin/align-guess.cgl). Residues with black and shaded backgrounds indicate amino acid identity and similarity, respectively. PDZ domains (wavy underlining) and the aPKC-binding region (double underlining; see Fig. 5) are indicated. Arrows indicate potential PKC phosphorylation sites in the CR3. Dashes represent sequence gaps. (b) Schematic view of the ASIP and PAR-3 structures. Typical conserved regions—CR1, CR2, and CR3—are shown. The aPKC-binding region shown is that sufficient for a direct interaction with aPKC (see Fig. 5). (c) Amino acid sequence alignment of the NH2-terminal region of rat ASIP with C. elegans PAR-3 and Drosophila AA439413. Residues with a black background indicate amino acid identity. The amino acid sequence of Drosophila AA439413 is encoded by residues 137–401 of the nucleic acid sequence. (d) Amino acid sequence alignment of the PDZ domain of ASIP with the third PDZ domain of rat PSD95 and human DLG. Residues with a black background indicate amino acid identity. The six β sheets (βA–βF) and the two α helices (αA and αB) present in the structure of the third PDZ domain of rat PSD95 (Doyle et al., 1996) and human DLG (Cabral et al., 1996) are indicated in the upper alignment. r, rat; c, C. elegans; d, Drosophila; h, human.
Figure 5
Figure 5
ASIP expression and association with aPKC in NIH3T3 and MDCKII cells. (a) Western blot analysis with anti-ASIP (C2) or anti-PKCλ (mAb) antibodies. Total extracts of the indicated cells were subjected to Western blot analysis. The central panel shows the results obtained using anti-ASIP (C2) antibody preabsorbed with antigen. Arrowheads show two specific ASIP bands (180 and 150 kD) (left) and a PKCλ band (right). (b and c) Association of ASIP and aPKC in NIH3T3 (b) and MDCKII (c) cells. Cell extracts were clarified by centrifugation (input) and immunoprecipitated with anti-ASIP (C2) antibody. The immunoprecipitates were probed with anti-PKCλ (mAb) antibody (top) or anti-ASIP (C2) antibody (bottom). Asterisk indicates the 150-kD ASIP band (c).
Figure 2
Figure 2
Expression of ASIP mRNA in mouse tissues and FISH mapping of ASIP on human chromosomes. (A) Total RNA (5 μg for brain; 7 μg for Hela; 10 μg for others) or poly(A)+ RNA (1.6 μg for p19) was analyzed using the original mouse cDNA isolate (clone I-1) of ASIP as a probe. The positions of the ribosomal RNAs are indicated. The same blot was reprobed with GAPDH cDNA (bottom). The natures of the two mRNAs (6 and 4 kb) remain to be clarified, although our cDNA clone (5.5 kb) corresponds to the longer mRNA. (B) FISH mapping of the ASIP probe (a) showing the FISH signals on the chromosome; and (b) showing the same mitotic figure stained with DAPI to identify chromosome 10.
Figure 2
Figure 2
Expression of ASIP mRNA in mouse tissues and FISH mapping of ASIP on human chromosomes. (A) Total RNA (5 μg for brain; 7 μg for Hela; 10 μg for others) or poly(A)+ RNA (1.6 μg for p19) was analyzed using the original mouse cDNA isolate (clone I-1) of ASIP as a probe. The positions of the ribosomal RNAs are indicated. The same blot was reprobed with GAPDH cDNA (bottom). The natures of the two mRNAs (6 and 4 kb) remain to be clarified, although our cDNA clone (5.5 kb) corresponds to the longer mRNA. (B) FISH mapping of the ASIP probe (a) showing the FISH signals on the chromosome; and (b) showing the same mitotic figure stained with DAPI to identify chromosome 10.
Figure 3
Figure 3
Specificity of the association between ASIP and aPKC. (a–e) The association of ASIP and PKC isotypes in COS cells. COS cells were transiently transfected with the expression vectors shown at the top. (a) Cell extracts were clarified by centrifugation (sup), and were immunoprecipitated with anti-T7 antibody. The immunoprecipitates were probed with anti-PKCζ (ζRb2) antibody. Overexpressed exogenous PKCζ (lane tag-ASIP/PKCζ) was coprecipitated with ASIP as well as endogenous PKCζ and PKCλ (lane tag-ASIP). The anti-PKCζ (ζRb2) antibody cross-reacts with PKCα as well as PKCλ. (b) The reverse experiment to a. Cell extracts were immunoprecipitated with anti-PKCζ (ζRb2) antibody. The immunoprecipitates were probed with anti-T7 tag antibody. Tag-ASIP is coprecipitated with PKCζ. (c–e) Cell extracts were immunoprecipitated with anti-T7 tag antibody followed by anti-PKCλ (mAb; c), PKCα (mAb; d), or PKCδ (mAb; e). PKCλ, but not PKCα or PKCδ, can interact with ASIP in COS cells. (f) The PKCλ-kinase domain (KD) coprecipitated with ASIP in COS cells. COS cells were transiently transfected with the expression vectors shown at the top, and were immunoprecipitated by anti-T7 tag antibody. The immunoprecipitates were probed with anti-PKCλ antibody (λ2) which recognizes both PKCλRD and PKCλKD.
Figure 4
Figure 4
Direct interaction between mouse PKCζ and rat ASIP or C. elegans PAR-3. The recombinant GST fusion proteins shown at the top were produced in E. coli. Purified proteins were subjected to SDS-PAGE and blotted onto PVDF membranes. The blots were then probed with anti-GST antibody (left) or overlaid with recombinant mouse PKCζ, followed by immunodetection with an anti-PKCζ (ζRb2) antibody and an alkaline phosphatase–conjugated secondary antibody (right).
Figure 6
Figure 6
Colocalization of ASIP with aPKC and ZO-1 at cell junctions in MDCKII cells. Confluent MDCKII cells were doubly stained with anti-ASIP (C2) antibody (a and d, green) and anti-PKCλ (mAb) antibody (b, red) or anti-ZO-1 (e, red) followed by FITC-conjugated anti-rabbit IgG and Cy3-conjugated anti-mouse IgG antibodies. The yellow and orange staining in c and f indicates the colocalization of ASIP and PKCλ or ZO-1. Bars (c and f), 10 μm.
Figure 7
Figure 7
Colocalization of ASIP with aPKC and ZO-1 at cell junctions in NIH3T3 cells. Confluent NIH3T3 cells were doubly stained with anti-ASIP (C2) antibody (a and d, green) and anti-PKCλ antibody (mAb) (b, red) or anti-ZO-1 (e, red) followed by FITC-conjugated anti-rabbit IgG and Cy3-conjugated anti-mouse IgG antibodies. The yellow and orange staining in c and f indicates the colocalization of ASIP and PKCλ or ZO-1. Bars (c and f), 10 μm.
Figure 8
Figure 8
Immunofluorescence localization of ASIP and aPKC in Ca2+ switch experiments with MDCKII cells. Subconfluent MDCKII cells were transferred to low Ca2+ medium (growth medium containing 4 mM EGTA) for 6 h (a and b), and were then transferred back to normal Ca2+ medium for 2 h (c and d). The cells were doubly stained with anti-ASIP (C2) antibody (a and c) and anti-PKCλ (mAb) antibody (b and d), followed by FITC-conjugated anti-rabbit IgG and Cy3-conjugated anti-mouse IgG antibodies. Bar (d), 10 μm.
Figure 9
Figure 9
Colocalization of ASIP with aPKC and ZO-1 at cell junctions in rat intestinal epithelium and hepatic bile capillaries. (a) Phase contrast images of frozen cryosections of rat small intestine. lum, lumen; ept, epithelium. (b and c) The localization of ASIP immunofluorescence in frozen sections of rat small intestine (b) and liver (c). b shows the same fields as a. The arrowhead in c shows a bile capillary. (d–i) Enlarged view of the intestinal epithelia. The samples were doubly stained with anti-ASIP (C2) antibody (d and g, green) and anti-PKCλ (mAb) antibody (e, red) or anti-ZO-1 (h, red) followed by FITC-conjugated anti-rabbit IgG and Cy3-conjugated anti-mouse IgG antibodies. The yellow and orange staining in f and i indicates colocalization of ASIP and PKCλ or ZO-1. Bars (b and c), 20 μm; bars (f and i), 5 μm.
Figure 10
Figure 10
Ultrastructural localization of ASIP in rat small intestine. Immunogold EM of the small intestinal epithelium. The labeling for ASIP is localized in the tight junction. The adherens junction, nonjunctional plasma membrane, and cytoplasm are not labeled. Bar, 200 nm.
Figure 11
Figure 11
Comparison of the polarized asymmetric distribution of the protein complex of aPKC and PAR-3/ASIP between the C. elegans one-cell embryo and differentiated mammalian epithelial cells. In the C. elegans one-cell embryo, PAR-3 localizes at the anterior periphery with aPKC and determines the distribution of PAR-1, whereas PAR-1 localizes at the posterior periphery in a reciprocal manner. In mammalian epithelial cells, ASIP and PKCλ colocalize at tight junctions, whereas EMK (m-PAR-1) localizes in the lateral domain.

References

    1. Akimoto K, Mizuno K, Osada S, Hirai S, Tanuma S, Suzuki K, Ohno S. A new member of the third class in the protein kinase C family, PKCλ, expressed dominantly in an undifferentiated mouse embryonal carcinoma cell line and also in many tissues and cells. J Biol Chem. 1994;269:12677–12683. - PubMed
    1. Akimoto K, Takahashi R, Moriya S, Nishioka N, Takayanagi J, Kimura K, Fukui Y, Osada S, Mizuno K, Hirai S, et al. EGF or PDGF receptors activate atypical PKCλ through phosphatidylinositol 3-kinase. EMBO (Eur Mol Biol Organ) J. 1996;15:788–798. - PMC - PubMed
    1. Balda MS, Gonzalez-Mariscal L, Matter K, Cereijido M, Anderson JM. Assembly of the tight junction: the role of diacylglycerol. J Cell Biol. 1993;123:293–302. - PMC - PubMed
    1. Balda MS, Matter K. Tight junctions. J Cell Sci. 1998;111:541–547. - PubMed
    1. Bandyopadhyay G, Standaert ML, Galloway L, Moscat J, Farese RV. Evidence for involvement of protein kinase C (PKC)-ζ and noninvolvement of diacylglycerol-sensitive PKCs in insulin-stimulated glucose transport in L6 myotubes. Endocrinology. 1997;138:4721–4731. - PubMed

Publication types

MeSH terms

Associated data