. 1998 Oct 5;143(1):171-81.
doi: 10.1083/jcb.143.1.171.

Neurofilament-dependent radial growth of motor axons and axonal organization of neurofilaments does not require the neurofilament heavy subunit (NF-H) or its phosphorylation

Affiliations

Neurofilament-dependent radial growth of motor axons and axonal organization of neurofilaments does not require the neurofilament heavy subunit (NF-H) or its phosphorylation

M V Rao et al. J Cell Biol. .

Abstract

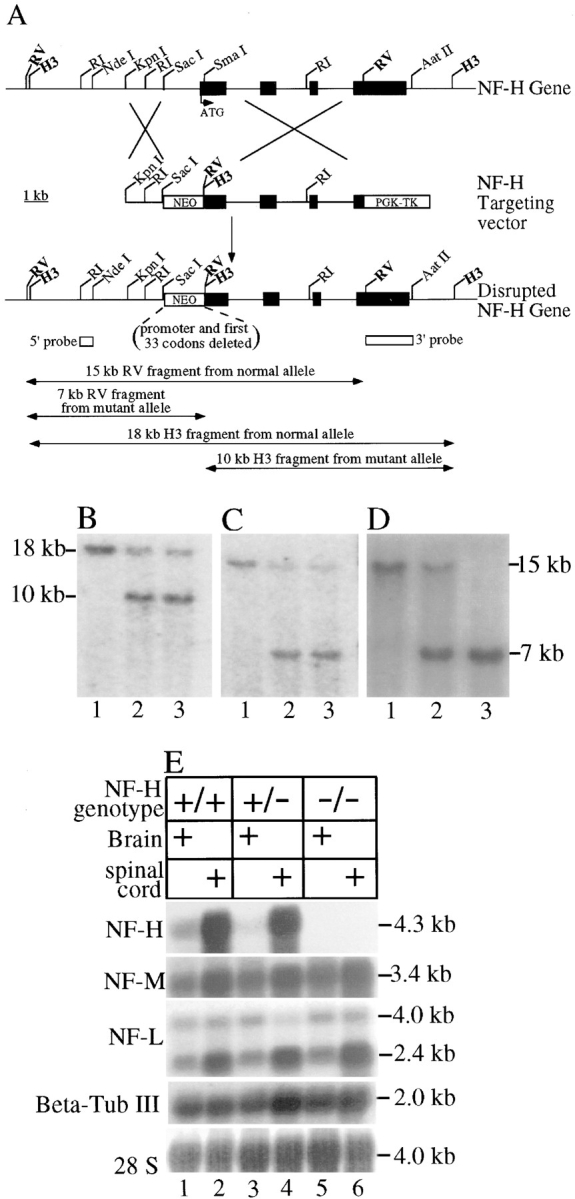
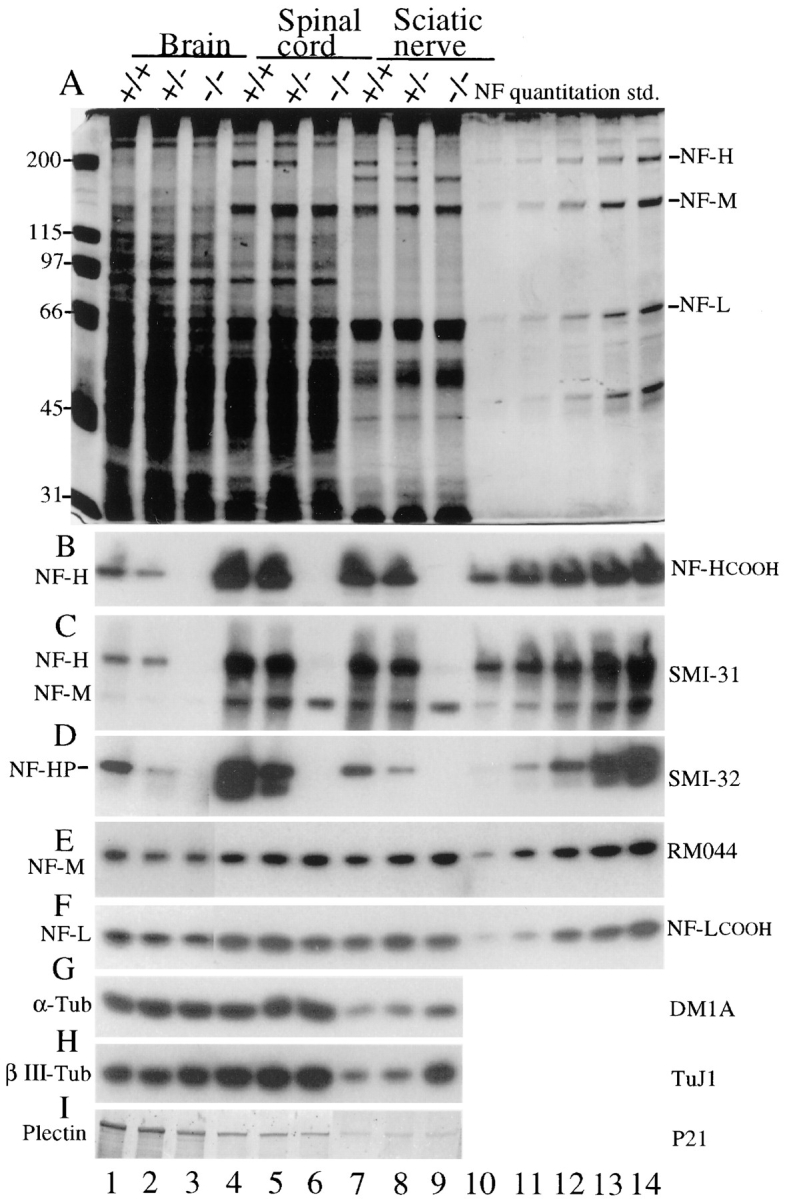
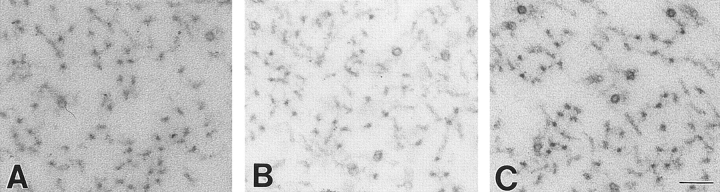
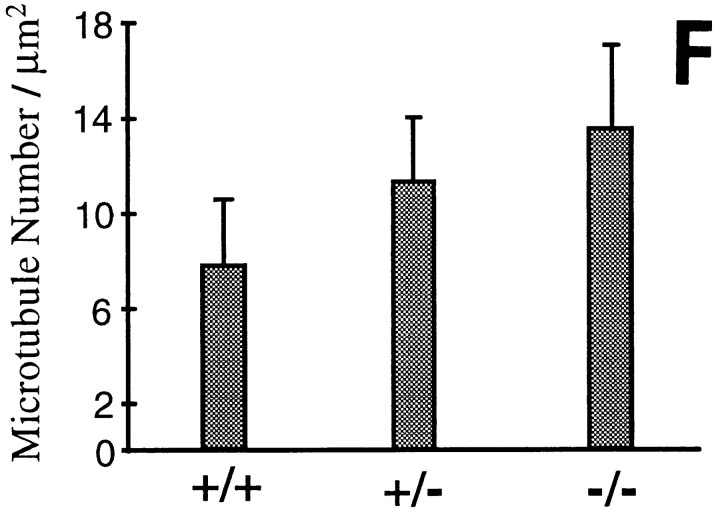
Neurofilaments are essential for establishment and maintenance of axonal diameter of large myelinated axons, a property that determines the velocity of electrical signal conduction. One prominent model for how neurofilaments specify axonal growth is that the 660-amino acid, heavily phosphorylated tail domain of neurofilament heavy subunit (NF-H) is responsible for neurofilament-dependent structuring of axoplasm through intra-axonal crossbridging between adjacent neurofilaments or to other axonal structures. To test such a role, homologous recombination was used to generate NF-H-null mice. In peripheral motor and sensory axons, absence of NF-H does not significantly affect the number of neurofilaments or axonal elongation or targeting, but it does affect the efficiency of survival of motor and sensory axons. Loss of NF-H caused only a slight reduction in nearest neighbor spacing of neurofilaments and did not affect neurofilament distribution in either large- or small-diameter motor axons. Since postnatal growth of motor axon caliber continues largely unabated in the absence of NF-H, neither interactions mediated by NF-H nor the extensive phosphorylation of it within myelinated axonal segments are essential features of this growth.


Figures

Figure 1
Figure 1
Disruption of the mouse NF-H gene by homologous recombination. (A) Strategy for disruption of the mouse NF-H gene. A targeting construct for disruption of the NF-H gene was constructed by inserting a 1.7-kb gene encoding resistance to neomycin in place of 1.6 kb NF-H putative promoter and the first 34 codons of the gene. The four NF-H exons are indicated by filled boxes interrupted by three introns. ATG denotes the NF-H translation initiation codon. Unique HindIII (H3) and EcoRV (RV) sites were introduced into the disrupted gene allele after homologous recombination. RI, EcoRI; WT, wild type; MT, mutant; PGK, phosphoglycerate kinase promoter; NEO, neomycin phosphotransferase gene; TK, thymidine kinase gene. (B–D) Screening of (B and C) ES and (D) mouse tail DNAs for targeted inactivation of the NF-H gene. (B) Genomic DNA blot of ES cell DNA after digestion with HindIII was probed with a segment 3′ to the targeted domain (the highlighted EcoRV-AatII fragment in A). The normal NF-H allele produces an 18-kb fragment; the targeted allele produces a 10-kb fragment. (C) Genomic DNA blot of ES cell DNA after digestion with EcoRV was probed with a 5′ probe (the EcoRI-NdeI fragment denoted in A). The normal allele produces a 15-kb fragment; the targeted allele produces a 7-kb fragment. (B and C) Lane 1, wild-type ES cell DNA; lanes 2 and 3, DNA from two targeted ES cells. (D) EcoRV-digested mouse tail DNA probed with the 5′ probe. DNAs are from a mouse with (lane 1) two wild-type alleles or (lane 2) heterozygous or (lane 3) homozygous for disruption of the NF-H gene. (E) NF-L, NF-M, NF-H, and βIII-tubulin mRNA levels in mice with zero, one, or two copies of a disrupted NF-H gene. 20 μg of total RNA isolated from 5-wk-old brains and spinal cords of control mice and mice heterozygous or homozygous for disruption of the NF-H gene were fractionated on 1% formaldehyde agarose gels, blotted on to nylon membranes, and probed with radiolabeled cDNA sequences for each subunit (see Materials and Methods). Lanes 1, 3, and 5, brain RNAs from wild-type, heterozygous, and homozygous mice. Lanes 2, 4, and 6, spinal cord RNAs from wild-type, heterozygous, and homozygous mice.
Figure 2
Figure 2
Levels of neurofilament subunits NF-L, NF-M, and NF-H in mice with zero, one, or two copies of a disrupted NF-H gene. (A) Total tissue extracts from 5-wk-old brain, spinal cord, and sciatic nerves were fractionated on 7% SDS–polyacrylamide gels and stained with (A) Coomassie blue or (B–I) electroblotted to nitrocellulose. (B) NF-H detected with a peptide antibody recognizing the extreme COOH terminus of NF-H (Xu et al., 1993); (C) phosphorylated NF-H and NF-M detected with monoclonal antibody SMI-31; (D) nonphosphorylated NF-H detected with monoclonal antibody SMI-32; (E) NF-M detected with monoclonal antibody RM 044 (Tu et al., 1995); (F) NF-L detected with a polyclonal peptide antibody recognizing the COOH terminus of NF-L (Xu et al., 1993); (G) α-tubulin detected with monoclonal antibody DM1A; (H) the neuron-specific class III, β-tubulin isotype with mAb TuJ1 (Lee et al., 1990); and (I) plectin detected with polyclonal antiserum P21 (Wiche and Baker, 1982). (Plectin migrates with a mobility of ∼500 kD in brain and spinal cord but at ∼160 kD in nerve samples using both this antibody and monoclonal antibody 10F6 [Foisner et al., 1991]; not shown.) Lanes 10–14, quantitation standards for the neurofilament subunits provided by a twofold dilution series of a neurofilament preparation. Molecular masses (kD) are indicated at left. (Lanes 1–3 of D–F represent four times longer exposures than lanes 4–14.)
Figure 3
Figure 3
Absence of NF-H does not markedly affect growth in motor axon caliber. (A) Cross sections of L5 motor (ventral root) and sensory (dorsal root) axons from wild type (+/+), NF-H heterozygous (+/−), and NF-H homozygous (−/−) mutant mice. Sections are from 4- and 9-wk-old mice as indicated. (B and C) Absence of NF-H yields a partial loss of motor and sensory axons in early postnatal life. Counts of small (<4 μm diameter; black bars) and large (≥4 μm diameter; crosshatched bars) axons in L5 (B) motor and (C) sensory root axons from 9-wk-old mice with zero, one, or two disrupted NF-H alleles. Counts are averages from three to four animals for each genotype and age. Bar, 10 μm.
Figure 4
Figure 4
Morphometry reveals that the absence of NF-H results in only a small reduction in radial growth and the distribution of calibers of motor axons. Axonal area was determined for all axons within L5 ventral roots using a computerized imaging package and was plotted as the frequency of appearance of diameters corresponding to circles of equivalent areas. Distributions from 4- (A–C) and 9-wk-old (D–F) mice. Arrows indicate the diameter(s) corresponding to the peak(s) of maximum frequency in wild-type animals. Points represent the averaged distributions of axon diameters from the entire roots of two mice for each genotype and age.
Figure 5
Figure 5
Morphometry reveals that absence of NF-H results in attenuation of radial growth of both small and large sensory axons. Axonal area was determined for all axons within the L5 dorsal roots using a computerized imaging package and plotted as the frequency of appearance of diameters corresponding to circles of equivalent areas. Distributions from (dashed curves) 4- and (solid curves) 9-wk-old mice from (A) wild-type mice or mice (B) heterozygous or (C) homozygous for the NF-H gene disruption. Arrows indicate the diameter corresponding to the peak of maximum frequency in both 4- and 9-wk wild-type animals. Points represent the averaged distributions of axon diameters from the entire roots of two mice for each genotype and age.
Figure 6
Figure 6
Absence of NF-H does not significantly affect nearest neighbor spacing of neurofilaments but does yield increased microtubule density. (A–C) Electron micrographs of axonal cross sections from 9-wk-old (A) wild-type, (B) NF-H heterozygous, and (C) NF-H homozygous mutant mice. (D) Distributions of nearest neighbor distances between neurofilaments in motor axons from 9-wk-old (squares) wild-type, (diamonds) NF-H heterozygous, and (circles) NF-H homozygous mice. Measurements (n > 3,600) were taken from 9 to 13 axons from each genotype. (E) Distributions of nearest neighbor distances between filaments in mice of various genotypes. Each dot represents the average nearest neighbor distance from a single axon. (F) Quantitation of axonal microtubule density in motor axons from (+/+) wild-type mice, (+/−) NF-H heterozygous and (−/−) NF-H homozygous mutant mice. Density was measured by counting all microtubules in a given cross-sectional area and dividing by that area. Counts are averages from four axons of each genotype. Bar, 0.1 μm.
Figure 6
Figure 6
Absence of NF-H does not significantly affect nearest neighbor spacing of neurofilaments but does yield increased microtubule density. (A–C) Electron micrographs of axonal cross sections from 9-wk-old (A) wild-type, (B) NF-H heterozygous, and (C) NF-H homozygous mutant mice. (D) Distributions of nearest neighbor distances between neurofilaments in motor axons from 9-wk-old (squares) wild-type, (diamonds) NF-H heterozygous, and (circles) NF-H homozygous mice. Measurements (n > 3,600) were taken from 9 to 13 axons from each genotype. (E) Distributions of nearest neighbor distances between filaments in mice of various genotypes. Each dot represents the average nearest neighbor distance from a single axon. (F) Quantitation of axonal microtubule density in motor axons from (+/+) wild-type mice, (+/−) NF-H heterozygous and (−/−) NF-H homozygous mutant mice. Density was measured by counting all microtubules in a given cross-sectional area and dividing by that area. Counts are averages from four axons of each genotype. Bar, 0.1 μm.
Figure 7
Figure 7
Model of neurofilament-dependent structuring of axoplasm. Axoplasm is organized into a volume-determining three-dimensional array by a series of linkages that span between adjacent neurofilaments (blue-gray) and between neurofilaments and microtubules (red) or cortical actin (blue) filaments. The NF-M tail (turquoise) sets nearest neighbor spacing of neurofilaments, possibly dependent on phosphorylation of its KSP repeats. (The interaction is drawn here between NF-M tails bound to adjacent neurofilaments, although the alternative of the tail directly contacting the adjacent filament core is equally plausible; see also Nakagawa et al. [1995].) NF-H (purple) normally also crossbridges neurofilaments to each other (Hirokawa et al., 1984), but this is not necessary for establishing nearest neighbor spacing. NF-H may also contribute to a three-dimensional array by crossbridging between neurofilaments and microtubules. Other interfilament linkages are provided by plectin (orange), which is capable of bridging between neurofilaments and cortical actin filaments (blue) and neurofilaments and microtubules (Wiche, 1989; Errante et al., 1994; Svitkina et al., 1996). Final structural stability is contributed by the BPAG1n/dystonin family of cross-linkers that in motor and sensory axons (Dowling et al., 1997; Dalpe et al., 1998) provide additional linkage between neurofilaments and actin filaments (Yang et al., 1996) that are tethered under the cortical membrane. In the absence of NF-H, cross-linking from NF-M, plectin, and BPAG1n/dystonin homologues continue to support a three-dimensional array necessary for acquisition and maintenance of normal axonal volume.

Comment in

References

    1. Andra K, Lassmann H, Bittner R, Shorny S, Fassler R, Propst F, Wiche G. Targeted inactivation of plectin reveals essential function in maintaining the integrity of skin, muscle, and heart cytoarchitecture. Genes Dev. 1997;11:3143–3156. - PMC - PubMed
    1. Arbuthnott ER, Boyd IA, Kalu KU. Ultrastructural dimensions of myelinated peripheral nerve fibres in the cat and their relation to conduction velocity. J Physiol. 1980;308:125–137. - PMC - PubMed
    1. Brown A, Bernier G, Mathieu M, Rossant J, Kothary R. The mouse dystonia musculorum gene is a neural isoform of bullous pemphigoid antigen 1. Nat Genet. 1995;10:301–306. - PubMed
    1. Carden MJ, Schlaepfer WW, Lee VM. The structure, biochemical properties, and immunogenicity of neurofilament peripheral regions are determined by phosphorylation state. J Biol Chem. 1985;260:9805–9817. - PubMed
    1. Ching GY, Liem RK. Assembly of type IV neuronal intermediate filaments in nonneuronal cells in the absence of preexisting cytoplasmic intermediate filaments. J Cell Biol. 1993;122:1323–1335. - PMC - PubMed

Publication types

MeSH terms