. 1998 Oct 5;143(1):195-205.
doi: 10.1083/jcb.143.1.195.

Requirement of heavy neurofilament subunit in the development of axons with large calibers

Affiliations

Requirement of heavy neurofilament subunit in the development of axons with large calibers

G A Elder et al. J Cell Biol. .

Abstract

Neurofilaments (NFs) are prominent components of large myelinated axons. Previous studies have suggested that NF number as well as the phosphorylation state of the COOH-terminal tail of the heavy neurofilament (NF-H) subunit are major determinants of axonal caliber. We created NF-H knockout mice to assess the contribution of NF-H to the development of axon size as well as its effect on the amounts of low and mid-sized NF subunits (NF-L and NF-M respectively). Surprisingly, we found that NF-L levels were reduced only slightly whereas NF-M and tubulin proteins were unchanged in NF-H-null mice. However, the calibers of both large and small diameter myelinated axons were diminished in NF-H-null mice despite the fact that these mice showed only a slight decrease in NF density and that filaments in the mutant were most frequently spaced at the same interfilament distance found in control. Significantly, large diameter axons failed to develop in both the central and peripheral nervous systems. These results demonstrate directly that unlike losing the NF-L or NF-M subunits, loss of NF-H has only a slight effect on NF number in axons. Yet NF-H plays a major role in the development of large diameter axons.


Figures

Figure 1
Figure 1
Targeted disruption of the mouse NF-H gene. (A) Targeting strategy for disruption of the mouse NF-H gene. The structure of the endogenous mouse NF-H (A) is shown in the top line. Open boxes, exons. A targeting vector designed to use positive and negative selection (Mansour et al., 1988) is shown in the center line. The PGK/neo gene was inserted in a sense orientation between NotI and XhoI sites (nucleotides −15 and +207 in Schneidman et al., 1988) in the first exon of mouse NF-H. The NF-H vector removes the initial ATG and the first 71 amino acids of the protein. It contains 2.1 kb of 5′ and 13.4 kb of 3′ homologous sequence and was linearized with KpnI. The overall targeting frequency was ∼1 in 200 clones. (B and C) Southern blots of DNA from ES cells and mice with disrupted NF-H alleles. NF-H ES cell clones were screened by PCR using primers (arrows in A) derived from flanking 5′ NF-H sequence (5′-ATGGGCAAGGAAAGAGTCAGGG-3′) and from the PGK promoter (5′-TGGATGTGGAATGTGTGCGAGG-3′). The 2.4-kb PCR product was detected by Southern blotting. Suspected targeted clones based on PCR screening were digested with KpnI, XbaI, or KpnI/XbaI and probed with the BamHI/SacI 1,300-bp fragment shown in A. Successful targeting generates a 2.9-kb fragment caused by the introduction of an XbaI site at the 5′ end of the PGK/neo resistance gene. In B, a Southern blot is shown of a targeted ES cell clone digested with KpnI (K), XbaI (X), or KpnI/XbaI (K+X) double digest and probed with the BamHI/ SacI fragment indicated above. Two clones show the expected wild-type pattern (+/+) whereas the targeted clone (+/−) gives an additional Xba band and a 2.9-kb Kpn/Xba band (arrow) consistent with homologous recombination. In C, a Southern blot of offspring from a heterozygous/heterozygous mating is shown. DNA was digested with BamHI and probed with the BamHI/ EcoRI fragment indicated in A. Wild-type (WT) and mutant (M) bands are indicated. Examples of wild-type (+/+), heterozygous (+/−) and null mutant animals (−/−) are indicated. (D) RNA analysis of mutant animals. RNase protection assays were performed with 50,000 counts per minute (CPM) of a murine β-actin probe and 250,000 CPM of an exon 3 murine NF-H probe. Positions of the 115-bp NF-H and 65-bp actin-protected fragments are indicated. Lanes were hybridized with 15 μg of tRNA (lane 1), 15 μg of total kidney RNA from a wild-type mouse (lane 2), or 15 μg total brain RNA from a homozygous null mutant (−/−, lane 3) and wild-type (+/+, lane 4) or heterozygous littermates (+/−, lane 5). (E) No detection of NF-H protein in NF-H–null mice. Western blotting was performed with RMO24 for detection of NFHP+++. No full-length or truncated NF-H protein could be detected in the spinal cord of NF-H −/−mice.
Figure 1
Figure 1
Targeted disruption of the mouse NF-H gene. (A) Targeting strategy for disruption of the mouse NF-H gene. The structure of the endogenous mouse NF-H (A) is shown in the top line. Open boxes, exons. A targeting vector designed to use positive and negative selection (Mansour et al., 1988) is shown in the center line. The PGK/neo gene was inserted in a sense orientation between NotI and XhoI sites (nucleotides −15 and +207 in Schneidman et al., 1988) in the first exon of mouse NF-H. The NF-H vector removes the initial ATG and the first 71 amino acids of the protein. It contains 2.1 kb of 5′ and 13.4 kb of 3′ homologous sequence and was linearized with KpnI. The overall targeting frequency was ∼1 in 200 clones. (B and C) Southern blots of DNA from ES cells and mice with disrupted NF-H alleles. NF-H ES cell clones were screened by PCR using primers (arrows in A) derived from flanking 5′ NF-H sequence (5′-ATGGGCAAGGAAAGAGTCAGGG-3′) and from the PGK promoter (5′-TGGATGTGGAATGTGTGCGAGG-3′). The 2.4-kb PCR product was detected by Southern blotting. Suspected targeted clones based on PCR screening were digested with KpnI, XbaI, or KpnI/XbaI and probed with the BamHI/SacI 1,300-bp fragment shown in A. Successful targeting generates a 2.9-kb fragment caused by the introduction of an XbaI site at the 5′ end of the PGK/neo resistance gene. In B, a Southern blot is shown of a targeted ES cell clone digested with KpnI (K), XbaI (X), or KpnI/XbaI (K+X) double digest and probed with the BamHI/ SacI fragment indicated above. Two clones show the expected wild-type pattern (+/+) whereas the targeted clone (+/−) gives an additional Xba band and a 2.9-kb Kpn/Xba band (arrow) consistent with homologous recombination. In C, a Southern blot of offspring from a heterozygous/heterozygous mating is shown. DNA was digested with BamHI and probed with the BamHI/ EcoRI fragment indicated in A. Wild-type (WT) and mutant (M) bands are indicated. Examples of wild-type (+/+), heterozygous (+/−) and null mutant animals (−/−) are indicated. (D) RNA analysis of mutant animals. RNase protection assays were performed with 50,000 counts per minute (CPM) of a murine β-actin probe and 250,000 CPM of an exon 3 murine NF-H probe. Positions of the 115-bp NF-H and 65-bp actin-protected fragments are indicated. Lanes were hybridized with 15 μg of tRNA (lane 1), 15 μg of total kidney RNA from a wild-type mouse (lane 2), or 15 μg total brain RNA from a homozygous null mutant (−/−, lane 3) and wild-type (+/+, lane 4) or heterozygous littermates (+/−, lane 5). (E) No detection of NF-H protein in NF-H–null mice. Western blotting was performed with RMO24 for detection of NFHP+++. No full-length or truncated NF-H protein could be detected in the spinal cord of NF-H −/−mice.
Figure 2
Figure 2
Quantitative Western blots of neocortex and spinal cord of NF-H heterozygous (+/−), NF-H null (−/−), and wild-type mice (+/+). Each sample was loaded in triplicate. The NF-H immunoreactivities are decreased in both neocortex and spinal cord of the heterozygous mice and are undetectable in the null mice. NFHP− is measured with RMdO9, a mAb against NF-H poorly or nonphosphorylated epitopes (Carden et al., 1987); NFHP+++ with RMO24, a mAb specific for highly phosphorylated epitopes, NF-M with RMO189 a mAb against the rod domain of NF-M; NF-L with a polyclonal rabbit anti-NF-L antiserum; TUB with a mAb specific for β−tubulin.
Figure 4
Figure 4
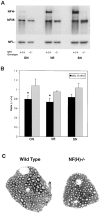
NF proteins in peripheral nerve and optic nerve and appearance of L5 ventral roots in NF-H–null mutant mice. (A and B) Western blots of sciatic nerves (SN), L5 ventral roots (VR), and optic nerves (ON) of 4-mo-old NF-H–null mutant (/−) versus control mice (+/+). Quantification of immunoreactive protein bands was performed as described in Materials and Methods. 16 μl of extracts from the second 2-mm segment of each respective nerve were loaded into individual lanes of a 7.5% polyacrylamide gel and separated by SDS-PAGE. Proteins were then electrophoretically transferred to nitrocellulose membranes for quantitative Western blot analysis. NF-H immunoreactivity was visualized with RMO24 (phosphorylated NF-H–specific antibody); NF-M with RMO189 (phosphorylation-independent NF-M antibody), and NF-L with a rabbit anti–NF-L polyclonal antisera. Quantification of the Western blots (B) showed that the levels of NF-L protein significantly decreased in the ventral roots and optic nerves but not in sciatic nerves of NF-H −/− mice. The levels of NF-M proteins in the NF-H −/− mice remained comparable to those of +/+ mice. *, P < 0.05. (C) L5 ventral roots in wild-type and NF-H–null mutant mice. Light microscopy of toluidine blue– stained L5 ventral roots from 4-mo-old wild-type and NF-H–null mice. Note the reduced size of the NF-H mutant (−/−) root as well as the absence in the mutant of axons with calibers comparable to the largest present in the control.
Figure 3
Figure 3
NF-L and NF-M RNA levels in NF-H–null mutant animals. (A and B) RNase protection assays to determine NF-L and NF-M RNA levels in the NF-H null mutant are shown. 5 μg of total brain RNA from a wild-type (lane 1, +/+) or NF-H–null mutant (lane 2, −/−) were hybridized with a murine β-actin probe and a mouse NF-L probe in A or a mouse NF-M probe in B. Protected fragments were separated as double-stranded RNA on 6% native polyacrylamide gels. Positions of the NF-L, NF-M, and β-actin bands are indicated. After normalization to the level of β-actin expression, neither NF-L nor NF-M RNA levels were significantly changed in the NF-H–null mutant.
Figure 5
Figure 5
Axon calibers in NF-H–null mutant animals. (A) Diameters of all myelinated axons were measured in L5 ventral roots of 4-mo-old animals (n = 3 wild type, n = 3 mutant). Data is presented on all axons greater than 1.5 μm in diameter. Note the marked reduction of axons greater than 5 μm in diameter in the mutant accompanied by an increase in smaller diameter fibers. (B) Axon diameters were measured in the sciatic nerve of a 2-mo-old wild-type and mutant animal. Quantitation was performed by sampling every fifth myelinated axon in the largest trunk of a proximal portion of the nerve. Data is presented for all axons greater than 2 μm in diameter (n = 374, wild type, 313 NF-H −/−). Note the shift to smaller diameter fibers in the null mutant. (C) Axon sizes were measured in a 1.9 × 105 μm2 area of the ventral medial portion of the third cervical segment. This region was chosen since comparable areas could be easily identified in different animals and because this region contains many large axons. Data is presented for all axons greater than 5 μm in diameter (n = 311 for wild type and 620 for NF-H −/−) from a 2-mo-old wild-type and NF-H −/− animal. Note the dramatic reduction in large diameter fibers accompanied by a shift to smaller diameter axons in the null mutant. (D) Axon sizes were determined in the optic nerves of 2-mo-old wild-type and NF-H–null mutant animals. Quantitation was performed on electron micrographs of optic nerve by measuring every myelinated axon in four randomly selected fields (n = 686 wild type, 741 NF-H −/−). Note the shift towards smaller diameter axons in the mutant.
Figure 6
Figure 6
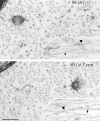
Fine structure of axons in mice with an NF-H–null mutation. (A and B) Axons of L5 ventral root are viewed in cross section and longitudinally (insets) from an NF-H–null mutant (A) or wild-type mouse (B). Axoplasm, including neurofilaments (arrows) and microtubules (triangles), appears normal in the NF-H–null mutant (A) as compared with control (B). Bar, 300 nm.
Figure 7
Figure 7
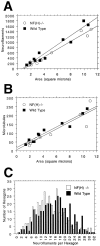
Neurofilament and microtubule content in NF-H–deficient animals. (A) NFs were counted in myelinated axons of L5 ventral root axons of 4-mo-old wild-type and control animals. The number of NFs in each axon was plotted against axonal size (area in square microns). Note that in myelinated axons of similar size the wild type has slightly more NFs than the NF-H–null mutant. (B) Microtubules were counted in the same axons as in A. No significant difference between mutant and control was found in the number of microtubules. (C) NF densities were determined using methods similar to those described by Price et al. (1988). A template of hexagons was applied over each electron micrograph and the number of NFs per hexagon counted in all hexagons, which fell completely within axonal borders. Hexagons were excluded only if vesicular organelles filled more than ∼10% of the hexagon. At least 300 hexagons (n = 351 wild type, 357 NF-H mutant) each equivalent to an area of 0.10 square microns were counted and a frequency distribution plot was generated showing the number of NFs per hexagon. Note the reduced density of NFs in the NF-H mutant.
Figure 8
Figure 8
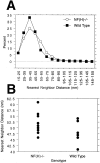
Nearest neighbor analysis of NF spacing in NF-H–deficient animals. (A) Interfilament spacing was analyzed in 10 mutant (range 1.88–11.08 square microns, average 5.29 ± 3.64 SD) and 10 wild-type (range 1.33–10.59, average 4.62 ± 3.33) axons from the L5 ventral root of 4-mo-old animals. The positions of all NFs in each axon cut in true cross section (n = 4,708 mutant and 4,965 wild type) were determined and nearest neighbor distances computed. Note that although the decreased NF density in the mutant results in an increased average interfilament distance, the modal distance is similar in both mutant and control. (B) Values for the individual axons measured in A are shown.

Comment in

References

    1. Balin BJ, Clark EA, Trojanowski JQ, Lee VM-Y. Neurofilament reassembly in vitro: biochemical, morphological and immuno-electron microscopic studies employing antibodies to defined epitopes. Brain Res. 1991;556:181–195. - PubMed
    1. Balin BJ, Lee VM-Y. Individual neurofilament subunits reassembled in vitro exhibit unique biochemical, morphological and immunological properties. Brain Res. 1991;556:196–208. - PubMed
    1. Berthold, C.-H. 1978. Morphology of normal peripheral axons. In Physiology and Pathobiology of Axons. S.G. Waxman, editor. Raven Press, New York. 3–63.
    1. Carden MJ, Trojanowski JQ, Schleapfer WW, Lee VM-Y. Two-stage expression of neurofilament polypeptides during rat neurogenesis with early establishment of adult phosphorylation. J Neurosci. 1987;7:3489–3504. - PMC - PubMed
    1. Carter J, Gragerov A, Konvicka K, Elder G, Weinstein H, Lazzarini RA. Neurofilament (NF) assembly; divergent characteristics of human and rodent NF-L subunits. J Biol Chem. 1998;273:5101–5108. - PubMed

Publication types

MeSH terms

Substances