. 1998 Oct 15;18(20):8175-85.
doi: 10.1523/JNEUROSCI.18-20-08175.1998.

Activity-dependent modulation of glutamate receptors by polyamines

Affiliations

Activity-dependent modulation of glutamate receptors by polyamines

D Bowie et al. J Neurosci. .

Abstract

The mechanisms by which polyamines block AMPA and kainate receptors are not well understood, but it has been generally assumed that they act as open-channel blockers. Consistent with this, voltage-jump relaxation analysis of GluR6 equilibrium responses to domoate could be well fit, assuming that spermine, spermidine, and philanthotoxin are weakly permeable open-channel blockers. Analysis of rate constants for binding and dissociation of polyamines indicated that the voltage dependence of block arose primarily from changes in koff rather than kon. Experiments with changes in Na concentration further indicate that the voltage dependence of polyamine block was governed by ion flux via open channels. However, responses to 1 msec applications of L-Glu revealed slow voltage-dependent rise-times, suggesting that polyamines additionally bind to closed states. A kinetic model, which included closed-channel block, reproduced these observations but required that polyamines accelerate channel closure either through an allosteric mechanism or by emptying the pore of permeant ions. Simulations with this model reveal that polyamine block confers novel activity-dependent regulation on calcium-permeable AMPA and kainate receptor responses.


Figures
Fig. 1.
Fig. 1.
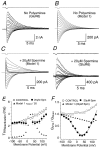
Time course of open-channel block by polyamines.A, GluR6(Q) responses recorded from an outside-out patch after voltage steps from −100 to +125 mV in 15 mV increments with 50 μm domoate and 100 μm internal PhTX.B, Similar experiment on another patch with 30 μm internal Spm. C, D,I–V relationship for the responses shown inA and B measured at peak (open circles) and 5 msec after depolarization (closed circles). E, In the absence of internal polyamines, GluR6(Q) responses to domoate did not show relaxations after voltage steps from −100 to +125 mV. Dashed linesin A, B, and E indicate zero current. F, G–V plot for seven experiments similar to that shown in E (mean ± SD) normalized to the conductance at −100 mV. The continuous line through the data points predicts the voltage dependence of domoate responses in the absence of polyamines and was generated using Equation 5, with mean values for G0(1.10 ± 0.01) and Vc (51.1 ± 0.10 mV) obtained from kinetic analysis of responses in the presence of Spm, Spd, and PhTX (n = 57 patches; see Table 1), as shown in Figure 2A.
Fig. 2.
Fig. 2.
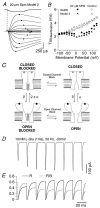
Fits of a sequential open-channel block model to polyamine responses. A, Current relaxations recorded with 50 μm domoate and 20 μm internal Spm after voltage steps from −100 to +95 mV in 15 mV increments.Lines through the data points are fit by a single binding site reaction scheme for a permeant blocker (Eq. 4).B, Rate of onset of block observed at different voltages with 20 μm Spm (n = 5; mean ± SD). Data points indicate the reciprocal of the time constant of single exponential fits to responses like those shown in A;solid lines through the data points are the sum of mean values for kon,koff, andkperm (n = 57 patches; see Table 1) estimated by fitting Equation 4 to responses like those shown in A. C, I–V plots recorded either in the absence of blocker (n = 7) or with 20 μm Spm (n = 5); in the latter case, responses were measured 100 μsec and 5 msec after the onset of depolarization. Lines through data points show the current predicted by Equation 4 using mean values from Table 1 at time 0, before the onset of block, at 100 μsec after depolarization and at equilibrium (t = ∞). D, Relaxations observed with different Spm concentrations (5, 10, and 30 μm) after voltage steps from −100 to +35 mV. Responses are from different patches normalized to the amplitude of the fully unblocked response at −100 mV; the rate of onset of block (solid line) was fit by a single exponential.E, Rate of onset of block at +35 mV for different concentrations of Spm reveals a linear relationship, consistent with an open-channel-blocking scheme. The solid line was fit by linear regression; the slope yields an estimate forkon at +35 mV of 7.4 × 10⁷ mol−1sec−1, and the intercept was 132 sec−1. Both values are in good agreement with predictions of 6.9 × 10⁷mol−1 sec−1 and 83 sec−1, respectively, calculated from values in Table 1. F, Relaxations after voltage steps from +40 mV to potentials ranging from −100 to +110 mV with 30 μminternal Spm. Simulations (smooth line) using mean values for the rate constants for Spm block (Table 1) accurately predict the time course of the relaxations, except at −85 and −100 mV, for which the reaction scheme predicts slightly faster reequilibration than observed experimentally (arrow).
Fig. 3.
Fig. 3.
Sequential block fails to predict the kinetics of responses to Glu. A, Membrane currents evoked by 1 msec applications of 10 mm Glu at various holding potentials (−100 to +125 mV, 15 mV increments) in the absence of internal polyamines; lines fit through the data points are single exponential functions. Top trace shows the junction current (1 msec) recorded with an open patch electrode at the end of the experiment. B, Simulation of GluR6(Q) responses by Model 1 with the time course of agonist application adjusted to give exchange rates similar to those achieved in experiments (top trace). C, Simulation of GluR6(Q) responses by Model 1 but with 20 μm internal Spm; note that at potentials producing strong block, the outward currents decay biexponentially. D, Experimentally recorded membrane currents evoked by 1 msec applications of 10 mm Glu in the presence of 20 μm internal Spm. Responses to Glu decayed with first order kinetics at all voltages; lines fit through the data points are single exponential functions.E, Deactivation time constants as a function of voltage for control responses (open circles) (n = 7; mean ± SEM) and with 20 μm Spm (filled circles) (n = 5; mean ± SEM). Deactivation was accelerated by Spm at membrane potentials more positive than −50 mV. The line fit through control responses indicates ane-fold decrease in the time constant of deactivation per 303 mV depolarization; filled triangles indicate the time constant of the slow component of deactivation (y-axis scale is 120 of measured values) estimated from double exponential fits to the simulated responses shown in C. F, G–V plots for peak Glu responses observed in the presence (n = 11 patches) and absence (n = 8 patches) of 20 μm Spm. Lines through the data points for 20 μm Spm show fits based on Equation 8, corrected for the weak outward rectification of Glu responses observed in the absence of polyamines (Vc = 56 mV; Eq. 5).Filled triangles indicate peak conductance values determined from measurement of simulated responses with the same programs used for analysis of experimental data.
Fig. 4.
Fig. 4.
GluR6 activation kinetics are slowed in the presence of Spm. A, Control responses evoked by 50 msec applications of 10 mm Glu at −100 and +50 mV and the open tip junction current for this experiment (top trace). The 10–90% rise times of the Glu responses (240 and 300 μsec) were similar at −100 and +50 mV. B, In the presence of 20 μm Spm, responses to 10 mm Glu exhibited much slower and voltage-dependent 10–90% rise times of 420 and 940 μsec at −100 and +50 mV, respectively. The responses shown are an average of 11 trials and are scaled to match the amplitude of the control responses shown in A (dotted lines). Scale bar: 175 pA at −100; 44 pA at +50 mV.Arrows indicate the time of the peak response, which at +50 mV was estimated by fitting a seventh order polynomial to the rising and falling phases (solid line); inA and B, dashed linesindicate zero current. C, In the absence of Spm, 10–90% rise times for control responses to Glu were voltage-insensitive for both symmetrical 150 mm Na (open circles) and symmetrical 405 mm Na (data not shown). With 20 μm Spm, rise times showed biphasic voltage dependence for 150 mm Na (filled circles) with weaker voltage dependence for 405 mm Na (filled diamonds).D, G–V plots for peak Glu responses in symmetrical 150 mm Na (filled circles) and symmetrical 405 mm Na (open circles). Fits of G–V plots with a single binding site reaction scheme (Eq. 4) reveals that Spm affinity is fourfold higher in 150 mm Na than in 405 mm Na.G–V plots were corrected for the weak outward rectification observed in the absence of polyamines (Fig.3F).
Fig. 5.
Fig. 5.
Voltage jumps reveal transitions between open and closed blocked states. A, Depolarizing steps to +50 mV were applied before or during the rising and falling phase (time increment, 500 μsec) of responses evoked by 50 msec applications of 10 mm Glu at −100 mV. When the depolarizing step preceded the application of Glu, the response at +50 mV showed strong block. In contrast, the envelope of the instantaneous currents evoked by depolarizing steps during the response to Glu matched well the amplitude of the response predicted for fully unblocked channels (open circles); this was estimated by averaging responses at −100 mV and correcting for the change in driving force and the weak outward rectification observed in the absence of polyamines (Fig. 3F). Note that the instantaneous currents evoked by steps from −100 to +50 mV at first overshoot the response observed when Glu was applied at +50 mV but then decay with double-exponential kinetics faster than the response at −100 mV, as expected for onset of open-channel block (Fig. 3C).B, Same experimental paradigm as in A but in the absence of polyamines. Note that the amplitude of the response recorded when the depolarizing step to +50 mV preceded the application of Glu matched well both the envelope of the instantaneous currents recorded on depolarization from −100 to +50 mV, as well as the amplitude and time course of the response at −100 mV scaled for the change in driving force (open circles).C, Responses to 10 mm Glu (50 msec duration) at +50 and −100 mV were recorded immediately after steps to prepulse potentials between −100 to +50 mV (15 mV increments, 200 msec duration); the amplitude of individual responses did not vary with prepulse potential. Solid lines show the average of the responses at −100 and +50 mV. In A–C, open tip junction potentials indicate the time of application of Glu.D, Similar analysis of results from four and eight patches, as indicated, confirm that the prepulse potential did not affect the amplitude of responses to Glu.
Fig. 6.
Fig. 6.
Modulation of responses to Glu by a bimodal blocking scheme. A, Simulation of responses to 1 msec applications of 10 mm Glu, as shown in Figure3D but with Model 2. Consistent with experimental observations (Fig. 4), the peak response shows strong rectification, and the rise times show a bell-shaped voltage dependence; the time of occurrence of the peak response is indicated by filled circles. B, Simulation of the voltage dependence of deactivation of responses to 1 msec applications of Glu (filled triangles) agrees well with experimental observations (filled circles) when the rate of channel closure is increased twofold for Spm-blocked channels.C, Schematic diagram for Model 2 indicating cycling between open and closed blocked states. D,E, Simulations showing facilitation of responses to 50 Hz trains of 1 msec applications of 10 mm Glu with 20 μm Spm using rate constants adjusted to produce control responses like those for GluR-D (Lomeli et al., 1994).Traces in E show occupancy of the closed (R) and closed blocked (RB) states of Model 2 during facilitation of responses to l-Glu; note the progressive decrease in occupancy of closed blocked states during successive responses to Glu.
None
None

References

    1. Bähring R, Mayer ML. An analysis of philanthotoxin block for recombinant rat GluR6(Q) glutamate receptor channels. J Physiol (Lond) 1998;509:635–650. - PMC - PubMed
    1. Bähring R, Bowie D, Benveniste M, Mayer ML. Permeation and block of rat GluR6 glutamate receptor channels by internal and external polyamines. J Physiol (Lond) 1997;502:575–589. - PMC - PubMed
    1. Baukrowitz T, Yellen G. Use-dependent blockers and exit rate of the last ion from the multi-ion pore of a K+-channel. Science. 1996;271:653–656. - PubMed
    1. Blanpied TA, Boeckman FA, Aizenman E, Johnson JW. Trapping channel block of NMDA-activated responses by amantadine and memantine. J Neurophysiol. 1997;77:309–323. - PubMed
    1. Bowie D, Mayer ML. Inward rectification of both AMPA and kainate subtype glutamate receptors generated by polyamine-mediated ion channel block. Neuron. 1995;15:453–462. - PubMed

MeSH terms

LinkOut - more resources