. 1998 Oct;118(2):573-80.
doi: 10.1104/pp.118.2.573.

Does a low nitrogen supply necessarily lead to acclimation of photosynthesis to elevated CO2?

Affiliations
Free PMC article

Does a low nitrogen supply necessarily lead to acclimation of photosynthesis to elevated CO2?

PK Farage et al. Plant Physiol. 1998 Oct.
Free PMC article

Abstract

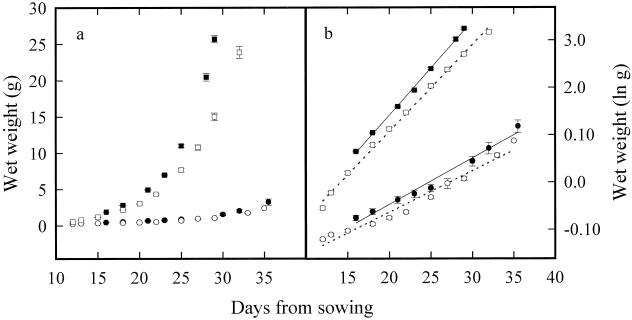
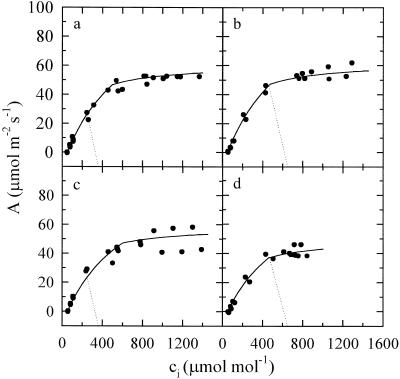
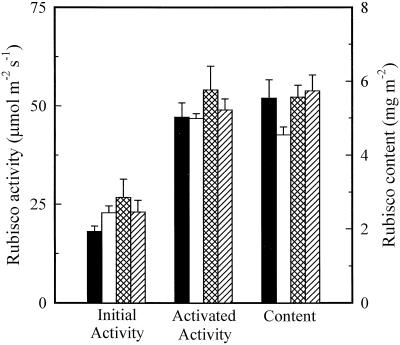
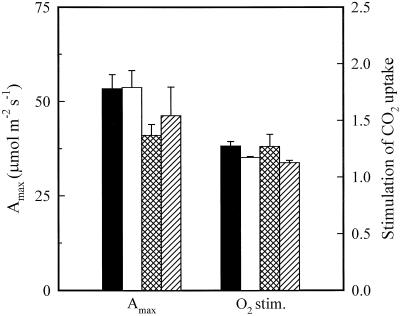
Long-term exposure of plants to elevated partial pressures of CO2 (pCO2) often depresses photosynthetic capacity. The mechanistic basis for this photosynthetic acclimation may involve accumulation of carbohydrate and may be promoted by nutrient limitation. However, our current knowledge is inadequate for making reliable predictions concerning the onset and extent of acclimation. Many studies have sought to investigate the effects of N supply but the methodologies used generally do not allow separation of the direct effects of limited N availability from those caused by a N dilution effect due to accelerated growth at elevated pCO2. To dissociate these interactions, wheat (Triticum aestivum L.) was grown hydroponically and N was added in direct proportion to plant growth. Photosynthesis did not acclimate to elevated pCO2 even when growth was restricted by a low-N relative addition rate. Ribulose-1, 5-bisphosphate carboxylase/oxygenase activity and quantity were maintained, there was no evidence for triose phosphate limitation of photosynthesis, and tissue N content remained within the range recorded for healthy wheat plants. In contrast, wheat grown in sand culture with N supplied at a fixed concentration suffered photosynthetic acclimation at elevated pCO2 in a low-N treatment. This was accompanied by a significant reduction in the quantity of active ribulose-1, 5-bisphosphate carboxylase/oxygenase and leaf N content.


Figures

Figure 1
Figure 1
The effects of pCO2 and N supply on the increase in total wet weight (a) and ln wet weight (b) of wheat. Plants were grown hydroponically with day/night temperatures of 20°C/15°C and a photosynthetically active photon flux density at leaf height of approximately 750 μmol m−2 s−1. Treatments were: ▪, 650 μmol mol−1 CO2, free access to N; □, 360 μmol mol−1 CO2, free access to N; •, 650 μmol mol−1 CO2, RAR of 0.07 mol N mol−1 N d−1; and ○, 360 μmol mol−1 CO2, RAR of 0.07 mol N mol−1 N d−1. Vertical bars represent se; n = 10.
Figure 2
Figure 2
Rates of Asat and Vc,max of the sixth leaf at ligule emergence of wheat grown hydroponically (hy), and the Vc,max of the sixth leaf at ligule emergence of wheat grown in sand culture (sd). Measurements were made with a leaf temperature of 23°C with a photosynthetically active photon flux density of 1400 μmol m−2 s−1 and pO2 of 210 mmol mol−1. The Asat was measured at 360 μmol mol−1 CO2, and Vc,max was obtained from the initial slope of the CO2 response curve. Treatments consisted of the following: Hydroponics: ▪, 650 μmol mol−1 CO2, free access to N; □, 360 μmol mol−1 CO2, free access to N; ▩, 650 μmol mol−1 CO2, N RAR of 0.07 mol N mol−1 N d−1; ▨, 360 μmol mol−1 CO2, N RAR of 0.07 mol N mol−1 N d−1. Sand culture: ▪, 650 μmol mol−1 CO2, 10 mmol nitrate; □, 360 μmol mol−1 CO2, 10 mmol nitrate; ▩, 650 μmol mol−1 CO2, 4.5 mmol nitrate; ▨, 360 μmol mol−1 CO2, 4.5 mmol nitrate. Vertical bars represent se; n = 4.
Figure 3
Figure 3
CO2-response curves for the sixth leaf at ligule emergence of wheat grown hydroponically with free access to N or with a RAR of 0.07 mol N mol−1 N d−1 in atmospheres of 360 or 650 μmol mol−1 CO2. Symbols are data points from two representative leaves used in the calculation of Vc,max and Amax, whereas the curves are fitted by a maximum likelihood regression using the equations of Farquhar et al. (1980) to all of the leaves measured. The supply functions are indicated by dotted lines. a, 360 μmol mol−1 CO2, free access to N; b, 650 μmol mol−1 CO2, free access to N; c, 360 μmol mol−1 CO2, RAR of 0.07 mol N mol−1 N d−1; and d, 650 μmol mol−1 CO2; RAR of 0.07 mol N mol−1 N d−1. Measurement conditions are described in Figure 2.
Figure 4
Figure 4
Vc,max of Rubisco measured in vitro together with the concentration of Rubisco protein. Activities are for the initial activity upon extraction and for the Vc,max following incubation with CO2 and Mg2+. Legend for bars is in Figure 2; vertical bars represent se; n = 4.
Figure 5
Figure 5
The rate of CO2 uptake at light and CO2 saturation (Amax) and the relative stimulation (stim.) of CO2 uptake by inhibition of photorespiration following a reduction in pO2 to 21 mmol mol−1. Measurement conditions for leaf gas exchange and legends for bars are described in Figure 2; the [CO2] was 650 μmol mol−1. Vertical bars represent se; n = 4.

References

    1. Arp WJ. Effects of source sink relations on photosynthetic acclimation to elevated CO2. Plant Cell Environ. 1991;14:869–875.
    1. Arp WJ, Drake BG. Increased photosynthetic capacity of Scirpus olneyi after 4 years of exposure to elevated CO2. Plant Cell Environ. 1991;14:1003–1006.
    1. Bowes G. Growth at elevated CO2: photosynthetic responses mediated through Rubisco. Plant Cell Environ. 1991;14:795–806.
    1. Coleman JS, McConnaughay KDM, Bazzaz FA. Elevated CO2 and plant nitrogen use: is reduced tissue nitrogen concentration size-dependent? Oecologia. 1993;93:195–200. - PubMed
    1. Drake BG, Gonzaléz-Meler MA, Long SP. More efficient plants: a consequence of rising atmospheric CO2? Annu Rev Plant Physiol Plant Mol. 1997;48:609–639. - PubMed

LinkOut - more resources