. 1998 Oct 13;95(21):12438-43.
doi: 10.1073/pnas.95.21.12438.

Orientation-dependent and sequence-specific expansions of CTG/CAG trinucleotide repeats in Saccharomyces cerevisiae

Affiliations

Orientation-dependent and sequence-specific expansions of CTG/CAG trinucleotide repeats in Saccharomyces cerevisiae

J J Miret et al. Proc Natl Acad Sci U S A. .

Abstract

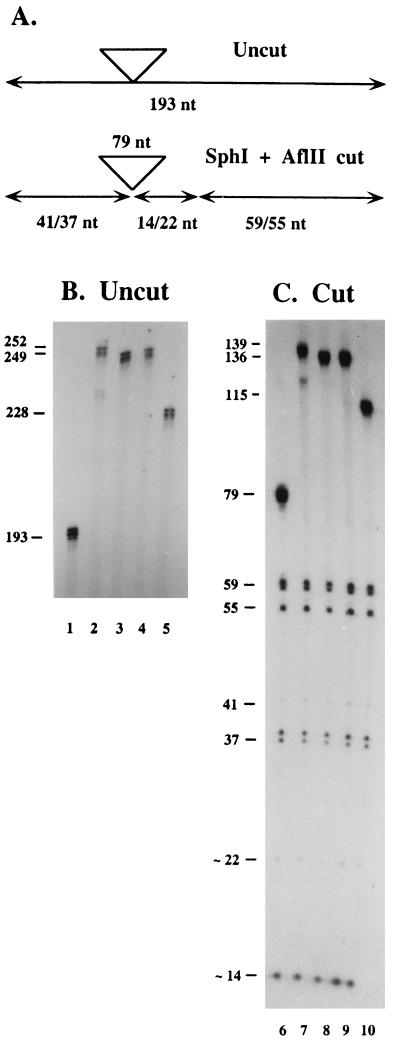
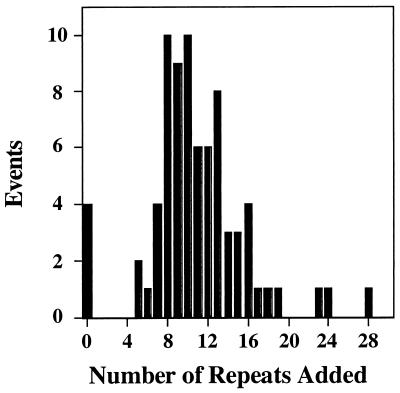
A quantitative and selective genetic assay was developed to monitor expansions of trinucleotide repeats (TNRs) in yeast. A promoter containing 25 repeats allows expression of a URA3 reporter gene and yields sensitivity to the drug 5-fluoroorotic acid. Expansion of the TNR to 30 or more repeats turns off URA3 and provides drug resistance. When integrated at either of two chromosomal loci, expansion rates were 1 x 10(-5) to 4 x 10(-5) per generation if CTG repeats were replicated on the lagging daughter strand. PCR analysis indicated that 5-28 additional repeats were present in 95% of the expanded alleles. No significant changes in CTG expansion rates occurred in strains deficient in the mismatch repair gene MSH2 or the recombination gene RAD52. The frequent nature of CTG expansions suggests that the threshold number for this repeat is below 25 in this system. In contrast, expansions of the complementary repeat CAG occurred at 500- to 1,000-fold lower rates, similar to a randomized (C,A,G) control sequence. When the reporter plasmid was inverted within the chromosome, switching the leading and lagging strands of replication, frequent expansions were observed only when CTG repeats resided on the lagging daughter strand. Among the rare CAG expansions, the largest gain in tract size was 38 repeats. The control repeats CTA and TAG showed no detectable rate of expansions. The orientation-dependence and sequence-specificity data support the model that expansions of CTG and CAG tracts result from aberrant DNA replication via hairpin-containing Okazaki fragments.


Figures

Figure 1
Figure 1
Hairpin model for TNR expansions. The figure shows the possible behavior of CAG and CTG tracts in our experiments, assuming that (CTG)25 repeats form stable hairpins in vivo more readily than (CAG)25. In AD, chromosomal DNA replication proceeds from left to right and the lagging strand synthesis is on top. The direction of the URA3 reporter (sense strand, 5′ → 3′) is indicated by the open arrow. In A, CTG sequences on the lagging daughter strand are predicted to form hairpins occasionally. Incorporation of the hairpin into the replicated product and failure to repair this structure ultimately would lead to an expanded allele. B shows an orientation effect, in which CAG sequences occupy the lagging daughter strand. If CAG sequences form less-stable hairpins than CTG, the CAG configuration will exhibit fewer expansions. In C and D, the entire reporter has been inverted to the opposite direction (depicted by the open arrow and the notations 3ARU GTC and 3ARU GAC, respectively). Inversion of the reporter is predicted to affect expansions because the sequences present on the lagging daughter strand will be altered. Inversion of the sequences in A (genetically unstable) results in the situation in D, which should yield fewer expansions. Similarly, inversion of the reporter from B (low rate of expansions) will yield the C scenario and should increase the rate of expansions.
Figure 2
Figure 2
A genetic assay to monitor TNR expansions in yeast. The regulatory region controlling expression of the reporter gene URA3 is shown. The important features include: the TATA box; the 25-repeat triplet, marked with an inverted triangle, where N = A or T; an out-of-frame ATG initiator codon; the preferred transcription initiation site I (CCACA sequence); and the start of the URA3 structural gene. Upper diagram illustrates the starting construct, with anticipated transcription (right-angle arrow) initiating within 55–125 bp (square brackets) from TATA. Initiation at I results in functional expression of URA3 and sensitivity to 5FOA. If the TNR expands to ≥30 repeats (Lower diagram), the window of allowed transcription no longer includes I. Transcription initiating upstream of I will include the out-of-frame ATG, resulting in translational incompetence (indicated by X) and resistance to 5FOA.
Figure 3
Figure 3
PCR analysis of CTG expansions. PCR products were generated from individual colonies harboring the (CTG)25 tract at the URA3 locus. A shows the predicted sizes of PCR products. Undigested product should yield a 193-nt product. Digestion with SphI and AflII generates several discrete fragments: 41 and 37 nt from the 5′ flanking region, 79 nt for a repeat of 25 trinucleotides, and 14, 22, 118, and 122 nt from the 3′ flanking region. All size estimates allow for the 4-nt overhanging ends generated by the restriction enzymes. B and C show sequencing gels with the uncut and cut PCR products, respectively. Sizes were deduced from a sequencing ladder (not shown). Lanes 1 and 6 are uncut and cut products from a starting (5FOAS) colony. Lanes 2 and 7, 3 and 8, 4 and 9, and 5 and 10 show products from individual 5FOAR colonies. The doublet products at 59 and 37 nt in C presumably reflect a 1-nt “stuttering” during amplification, as these fragments constitute the 3′ end of their respective strands. The faint intensities of the 41- and 22-nt products are a result of the availability of only a single C residue for radioactive labeling.
Figure 4
Figure 4
Distribution of expansion sizes. A summary histogram shows the change in PCR product size for 76 independent genetic events from wild-type cells harboring the (CTG)25 tract at the URA3 locus. Expansion sizes were estimated by comparing matched 5FOAS and 5FOAR product sizes (see Materials and Methods). Seventy-two of the samples exhibited size increases of +5 to +28 repeats, with a median value of +10.5. The remaining four samples showed no increase in product size.

References

    1. Paulson H L, Fischbeck K H. Annu Rev Neurosci. 1996;19:79–107. - PubMed
    1. Wells R D. J Biol Chem. 1996;271:2875–2878. - PubMed
    1. Kramer P R, Pearson C E, Sinden R R. Hum Genet. 1996;98:151–157. - PubMed
    1. Goellner G M, Tester D, Thibodeau S, Almqvist E, Goldberg Y P, Hayden M R, McMurray C T. Am J Hum Genet. 1997;60:879–890. - PMC - PubMed
    1. McMurray C T. Chromosoma. 1995;104:2–13. - PubMed

Publication types