. 1998 Oct 13;95(21):12663-70.
doi: 10.1073/pnas.95.21.12663.

Experience-dependent corticofugal adjustment of midbrain frequency map in bat auditory system

Affiliations

Experience-dependent corticofugal adjustment of midbrain frequency map in bat auditory system

E Gao et al. Proc Natl Acad Sci U S A. .

Abstract

Recent studies of corticofugal modulation of auditory information processing indicate that cortical neurons mediate both a highly focused positive feedback to subcortical neurons "matched" in tuning to a particular acoustic parameter and a widespread lateral inhibition to "unmatched" subcortical neurons. This cortical function for the adjustment and improvement of subcortical information processing is called egocentric selection. Egocentric selection enhances the neural representation of frequently occurring signals in the central auditory system. For our present studies performed with the big brown bat (Eptesicus fuscus), we hypothesized that egocentric selection adjusts the frequency map of the inferior colliculus (IC) according to auditory experience based on associative learning. To test this hypothesis, we delivered acoustic stimuli paired with electric leg stimulation to the bat, because such paired stimuli allowed the animal to learn that the acoustic stimulus was behaviorally important and to make behavioral and neural adjustments based on the acquired importance of the acoustic stimulus. We found that acoustic stimulation alone evokes a change in the frequency map of the IC; that this change in the IC becomes greater when the acoustic stimulation is made behaviorally relevant by pairing it with electrical stimulation; that the collicular change is mediated by the corticofugal system; and that the IC itself can sustain the change evoked by the corticofugal system for some time. Our data support the hypothesis.


Figures

Figure 1
Figure 1
Shift in the BFs of neurons in the IC evoked by acoustic stimuli (AS) or AS paired with electric stimuli (ES). A and B show the left IC (frontal section) and the left cerebral cortex (dorsolateral surface view), respectively. The numbers and lines in A indicate iso-BF contour lines. The arrows in A indicate dorsoventral electrode penetrations. AI, primary auditory cortex; CBL, cerebellum; LL, lateral lemniscus; m.c.a., middle cerebral artery; PAG: periaqueductal gray; SC, superior colliculus. A and B are based on Dear et al. (15) and Casseday and Covey (13), respectively. (C) The amount of shift in BF as a function of the difference between the BFs of collicular neurons and the frequency of AS. ASr, delivered repetitively for 30 min. ASt, delivered as a 1.0-s train. ESa, focal electric stimulation of the AI. Each symbol and vertical bar indicate a mean and a SD, respectively. ASt alone evoked no BF shift, so that the data points are plotted only for 1–8 kHz differences between IC BF and AS frequency. N, the numbers of BF-depth curves used for averaging. The frequency of ASt ranged from 21 to 55 kHz (25.33 ± 7.84 kHz, n = 15). The short and long dashed curves were obtained by Yan and Suga (11).
Figure 2
Figure 2
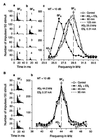
Changes or lack of changes in the responses and frequency-response curves of two single collicular neurons evoked by ASt + ESl. The responses and frequency-response curves were obtained with tone bursts fixed at 10 dB above the minimum threshold of a given neuron. (A) The frequency of ASt was 25.0 kHz, and the BF of the neuron was 29.5 kHz. (B) The frequency of ASt was 44.0 kHz, which was the same as the BF of the neuron. The data obtained before, immediately after, and 90 and 125 min (A) or 45 and 95 min (B) after ASt + ESl are represented by open circles, filled circles, filled triangles and dashed lines, respectively. BFc and BFs are indicated by arrows. The PST histograms in A a and b show the changes in response at the BFc and BFs evoked by ASt + ESl. The PST histograms in Ba show no change in response at the BFc, which was not shifted by ASt + ESl. In these PST histograms, 1–4, respectively, correspond to the four conditions for the frequency-response curves: control, ASt + ESl, 90 or 45 min after and 125 or 95 min after ASt + ESl.
Figure 3
Figure 3
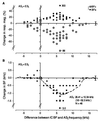
Changes in response magnitude (A) and BF (B) of 46 single collicular neurons as a function of difference in their BFs and the ASt frequency. (A) Almost all open circles show reduced responses to a tone burst at the original BF in the control condition (BFc), and all filled circles show increased responses to a tone burst at the BF shifted by ASt + ESl (BFs). (B) The filled circles indicate that almost all neurons with a BF higher than the ASt frequency shifted their BFs downward toward the ASt frequency. The dashed curve in B shows the BF shift observed in the multi-unit mapping experiments shown in Fig. 1C. The triangles indicate the data obtained from neurons whose BFs were the same as the ASt frequency. The vertical lines on the right indicate ± one SD for variations in response magnitude or BF in the control condition.
Figure 4
Figure 4
Mean time courses of changes in response magnitude (•) and BF (○) observed in collicular neurons. (A and B) The effect of 0.4 μg of muscimol applied to the AI and the effect of ASt + ESl on 8 and 15 collicular neurons, respectively. Muscimol evoked a reduction of response, but not a BF shift. ASt + ESl evoked a reduction in both response and BF. A response magnitude was measured at the BF in the control or shifted condition shown by ○ in the lower graph. (C) Muscimol first was applied to the AI, and then, during AI inactivation, ASt + ESl were delivered to the bat. These stimuli failed to evoke changes in the IC. (D) ASt + ESl were delivered to the bat, and, after the changes in the IC were evoked by these stimuli, muscimol was applied to the AI. The BF shift evoked by ASt + ESl stayed unaffected. The arrows indicate the time when muscimol or ASt + ESl was delivered. (C and D) Eight collicular neurons were studied. Each filled or opened circle and vertical bar indicates a mean and a SD, respectively.
Figure 5
Figure 5
Effects of cortical inactivation on auditory responses and frequency-response curves of four collicular neurons. (A) The effects of 0.4 μg of muscimol applied to the AI on a single collicular neuron. (B) Muscimol was applied to the AI immediately before ASt + ESl. That is, ASt + ESl were delivered to the bat during the AI inactivation. (C) Muscimol was applied to the AI immediately after the collicular changes were evoked by ASt + ESl. (D) Muscimol was applied to the SI immediately before ASt+ ESl. That is, ASt+ ESl were delivered to the bat during the SI inactivation. The frequency-response curves and PST histograms were obtained with tone bursts fixed at 10 dB above the minimum threshold of a given neuron. The PST histograms show the change or lack of change in the response magnitude at the BFc or BFs condition. 1–4, respectively, correspond to the four conditions in which the frequency-response curves were obtained (see Fig. 2 legend).

Similar articles

Cited by

References

    1. Diamond D M, Weinberger N M. Brain Res. 1986;372:357–360. - PubMed
    1. Bakin J S, Weiberger N M. Brain Res. 1990;536:271–286. - PubMed
    1. Weinberger N M, Javid R, Lepan B. Proc Natl Acad Sci USA. 1993;90:2394–2398. - PMC - PubMed
    1. Edeline J M, Weinberger N M. Behav Neurosci. 1991;105:154–175. - PubMed
    1. Edeline J M, Weinberger N M. Behav Neurosci. 1991;5:618–639. - PubMed

Publication types

LinkOut - more resources