. 1998 Nov;18(11):6165-77.
doi: 10.1128/MCB.18.11.6165.

Position-dependent methylation and transcriptional silencing of transgenes in inverted T-DNA repeats: implications for posttranscriptional silencing of homologous host genes in plants

Affiliations

Position-dependent methylation and transcriptional silencing of transgenes in inverted T-DNA repeats: implications for posttranscriptional silencing of homologous host genes in plants

M Stam et al. Mol Cell Biol. 1998 Nov.

Abstract

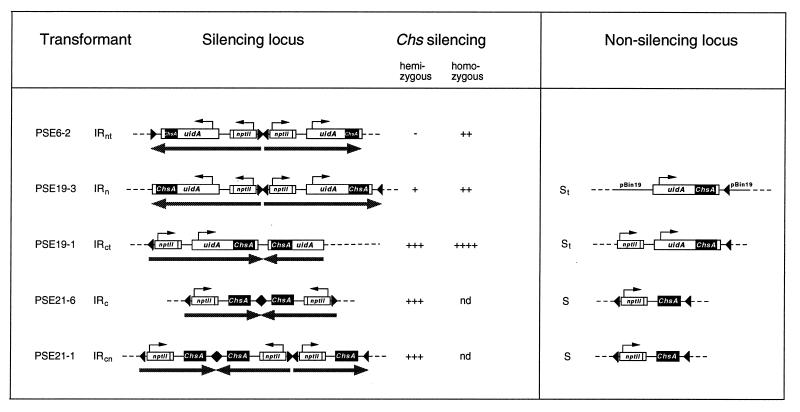
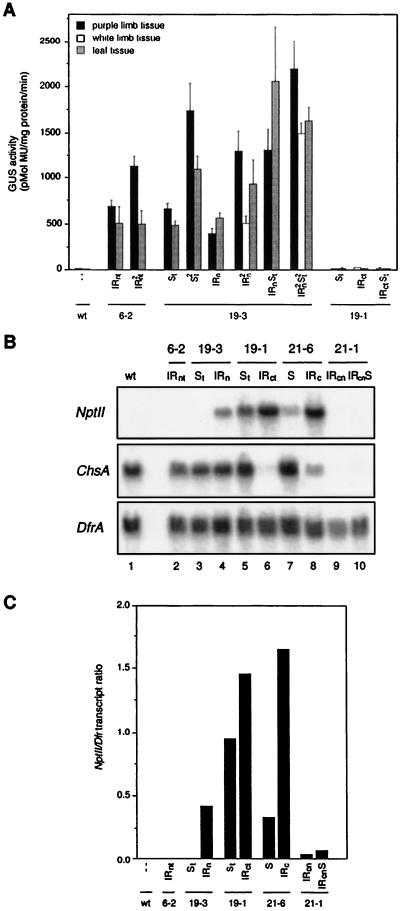
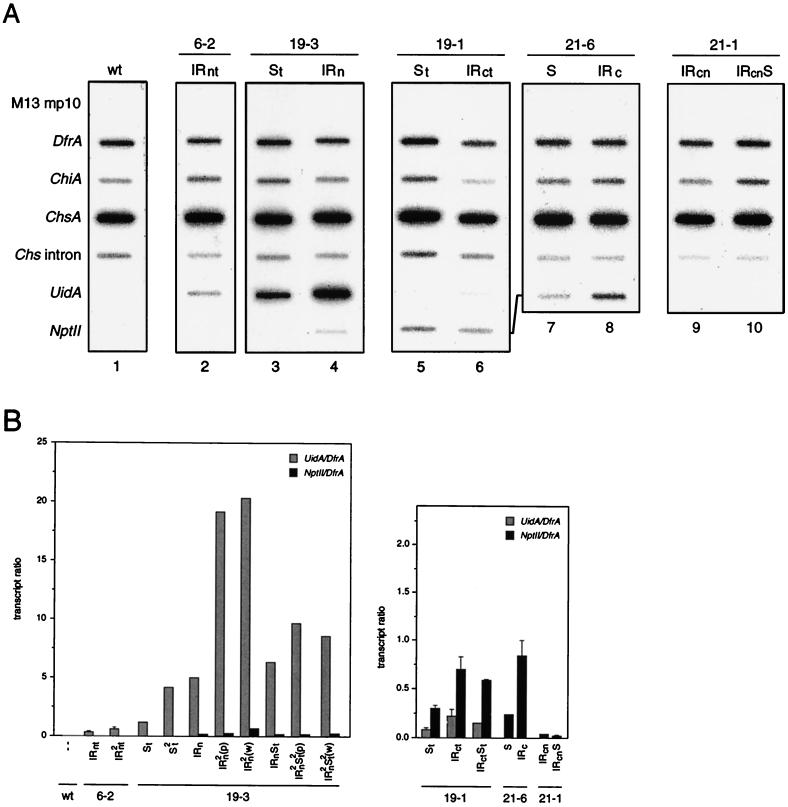
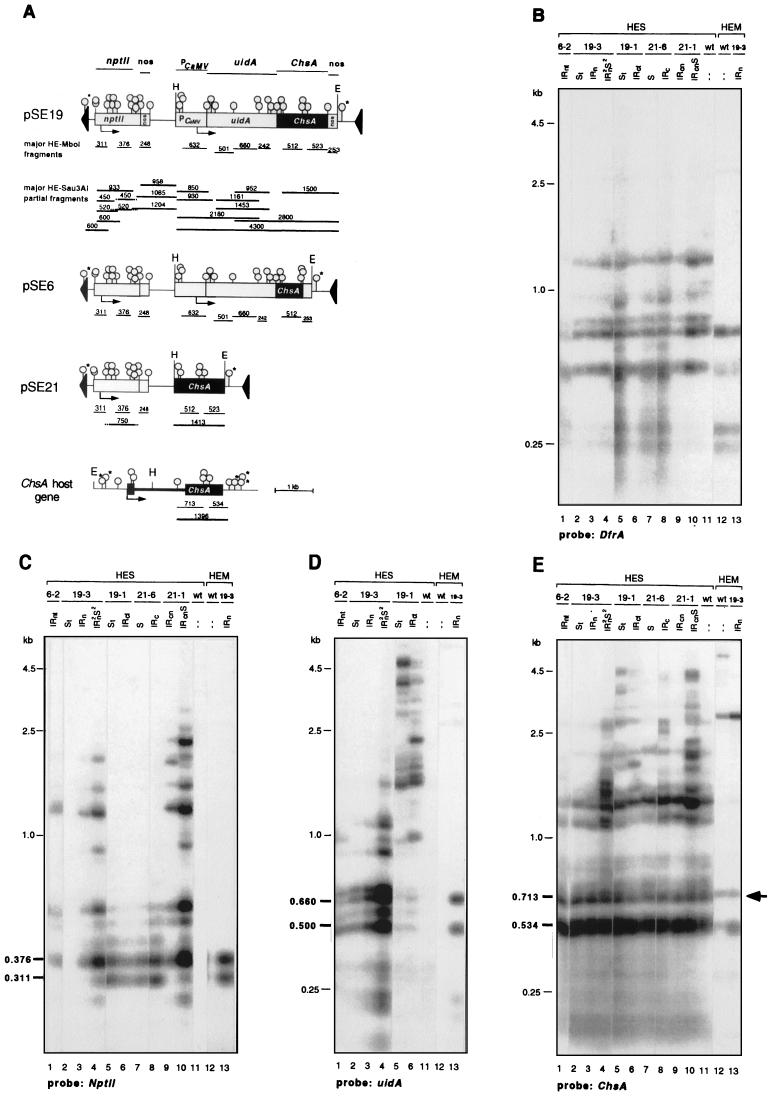
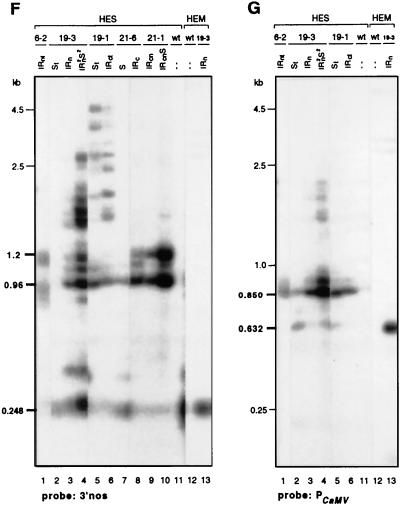
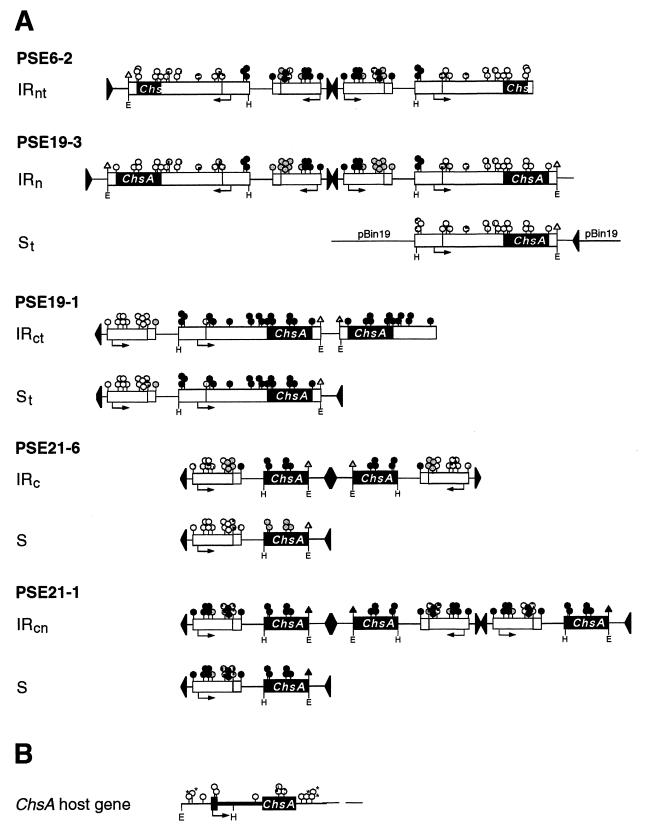
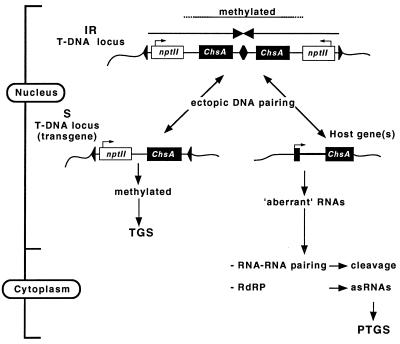
Posttranscriptional silencing of chalcone synthase (Chs) genes in petunia transformants occurs by introducing T-DNAs that contain a promoter-driven or promoterless Chs transgene. With the constructs we used, silencing occurs only by T-DNA loci which are composed of two or more T-DNA copies that are arranged as inverted repeats (IRs). Since we are interested in the mechanism by which these IR loci induce silencing, we have analyzed different IR loci and nonsilencing single-copy (S) T-DNA loci with respect to the expression and methylation of the transgenes residing in these loci. We show that in an IR locus, the transgenes located proximal to the IR center are much more highly methylated than are the distal genes. A strong silencing locus composed of three inverted T-DNAs bearing promoterless Chs transgenes was methylated across the entire locus. The host Chs genes in untransformed plants were moderately methylated, and no change in methylation was detected when the genes were silenced. Run-on transcription assays showed that promoter-driven transgenes located proximal to the center of a particular IR are transcriptionally more repressed than are the distal genes of the same IR locus. Transcription of the promoterless Chs transgenes could not be detected. In the primary transformant, some of the IR loci were detected together with an unlinked S locus. We observed that the methylation and expression characteristics of the transgenes of these S loci were comparable to those of the partner IR loci, suggesting that there has been cross talk between the two types of loci. Despite the similar features, S loci are unable to induce silencing, indicating that the palindromic arrangement of the Chs transgenes in the IR loci is critical for silencing. Since transcriptionally silenced transgenes in IRs can trigger posttranscriptional silencing of the host genes, our data are most consistent with a model of silencing in which the transgenes physically interact with the homologous host gene(s). The interaction may alter epigenetic features other than methylation, thereby impairing the regular production of mRNA.


Figures

FIG. 1
FIG. 1
Overview of the Chs silencing and nonsilencing T-DNA loci examined in this study. The Chs transformants and the identification of Chs silencing IR loci and the nonsilencing S loci present in these plants have been described previously (63, 69). All T-DNA constructs used in this study contained the neomycin phosphotransferase selectable marker gene (nptII) driven by the nopaline synthase promoter (Nos). The T-DNAs of the PSE6 and PSE19 transformants contained a CaMV-35S promoter-driven chimeric gene composed of the uidA coding region fused to the 5′ half (PSE6) or the full-length (PSE19) ChsA cDNA. The T-DNA of the PSE21 transformants contains the full-length ChsA cDNA. The small arrows in the maps indicate the transcription start sites of the Nos promoter and CaMV-35S promoter. These transgenes are flanked by the 3′nos polyadenylation region, which is indicated by a small open box. The arrowheads flanking the nptII and (uidA-)ChsA transgenes indicate the right and left border of the T-DNAs, respectively. The arrows below the maps of the silencing loci depict the palindromic arrangement of the integrated T-DNAs. The dashed lines indicate flanking plant DNA. Chs silencing by the IR loci in homozygous plants is stronger than in hemizygous plants, as indicated to the right of the physical maps (−, no silencing; +, most corolla limbs contain ≤5% white tissue; ++, about 5 to 50% white tissue; +++, about 50 to 95% white tissue; ++++, >95% white tissue; nd, not determined). pBin19, cointegrated pBin19 vector DNA.
FIG. 2
FIG. 2
Expression of transgenes residing in the S and IR loci. (A) The expression of the uidA-ChsA transgenes in progeny plants of the transformants PSE6-2, PSE19-3, and PSE19-1 was examined by measuring GUS activities. For each genotype, the activities were measured in four different leaves and corolla limbs derived from one to five different plants. If possible, the activities in purple and white corolla sectors were measured separately. This was not possible with the transformants PSE6-2 (IR2nt), PSE19-3 (IRn), and PSE19-3 (IRnSt) because the white sectors were relatively small. GUS activity is expressed as the mean and standard error of the mean (SEM). wt, wild type. (B) Northern blot hybridizations showing expression of the nptII transgenes (top), the ChsA host genes (middle), and the DfrA host genes (bottom), which served as an internal control. The RNAs were isolated from corolla limbs taken from plants that were hemizygous for the T-DNA loci indicated at the top. (C) The intensities of the nptII and DfrA bands in panel B were quantified with a PhosphorImager, and the ratios of nptII to DfrA transcript levels were calculated. −−, no T-DNA present. For further details, see the text.
FIG. 3
FIG. 3
Transcriptional activity of transgenes as determined by nuclear run-on assays. (A) Representative examples of nascent RNA hybridizations. Corolla nuclei were obtained from the transformants listed at the top. These plants were hemizygous for the T-DNA loci indicated. Nuclei from untransformed V26 (wild type [wt]) were used as control. The slot blot filters contained gene and strand-specific single-stranded M13 DNAs that were able to hybridize to the RNAs indicated at the left. DfrA and ChiA served as internal controls, and the ChsA intron signal indicates the transcription level of the endogenous Chs genes. M13mp10 was the vector in which the gene sequences were cloned. In addition to the hybridizations shown here, several others were performed with material from transformants carrying the same or other T-DNA loci, as depicted below the bar diagrams. (B) The signals obtained with the uidA, nptII, and DfrA M13 DNAs were quantified with a PhosphorImager, and the ratios of the uidA to DfrA transcripts (grey bars) and nptII to DfrA transcripts (black bars) were calculated. The values are expressed as the mean and SEM when n > 1 (n ranged from 2 to 5).
FIG. 4
FIG. 4
Methylation of T-DNA loci. The extent and level of DNA methylation was determined by digesting genomic DNA from corollas with the methylation-sensitive restriction enzyme Sau3AI. (A) Maps of the T-DNA constructs pSE19, pSE6, pSE21, and the endogenous ChsA host gene. The open circles mark the positions of the Sau3AI and MboI sites, and the EcoRI (E) and HindIII (H) sites are indicated. The probes used for the Southern blot hybridizations are shown at the top. The most prominent restriction fragments after a complete digestion by HindIII-EcoRI-MboI (HE-MboI) are indicated by thin lines beneath the maps. Partially cleaved fragments after digestion with HindIII-EcoRI-Sau3AI (HE-Sau3AI) are indicated by the thick lines. Partial fragments from the pSE6 and PSE21 constructs can be deduced from those indicated below pSE19. The GATC sites indicated by an asterisk (○∗) could not be analyzed because they were out of the reach of the probes. (B to G) Southern blot hybridizations of the transformants indicated at the top of the panels. The T-DNA loci that these transformants contain are also indicated. The blots were hybridized with a DfrA probe (B), nptII probe (C), uidA probe (D), ChsA probe (E), 3′nos probe (F), and PCaMV probe (G). Of the HEM digests, only the data obtained with the untransformed V26 line (wild type [wt]) and the transformant PSE19-3 (IRn) are shown; other transformants carrying the same sequences gave the same results (data not shown). PstI-digested phage lambda DNA was used as the size marker. The sizes in bold type refer to fragments mentioned in the text. The arrow in panel E indicates the position of the 713-bp fragment, which is unique for the endogenous ChsA gene. The intensity of this band is about the same in all lanes, relative to the internal DfrA control, irrespective whether the gene was silenced.
FIG. 4
FIG. 4
Methylation of T-DNA loci. The extent and level of DNA methylation was determined by digesting genomic DNA from corollas with the methylation-sensitive restriction enzyme Sau3AI. (A) Maps of the T-DNA constructs pSE19, pSE6, pSE21, and the endogenous ChsA host gene. The open circles mark the positions of the Sau3AI and MboI sites, and the EcoRI (E) and HindIII (H) sites are indicated. The probes used for the Southern blot hybridizations are shown at the top. The most prominent restriction fragments after a complete digestion by HindIII-EcoRI-MboI (HE-MboI) are indicated by thin lines beneath the maps. Partially cleaved fragments after digestion with HindIII-EcoRI-Sau3AI (HE-Sau3AI) are indicated by the thick lines. Partial fragments from the pSE6 and PSE21 constructs can be deduced from those indicated below pSE19. The GATC sites indicated by an asterisk (○∗) could not be analyzed because they were out of the reach of the probes. (B to G) Southern blot hybridizations of the transformants indicated at the top of the panels. The T-DNA loci that these transformants contain are also indicated. The blots were hybridized with a DfrA probe (B), nptII probe (C), uidA probe (D), ChsA probe (E), 3′nos probe (F), and PCaMV probe (G). Of the HEM digests, only the data obtained with the untransformed V26 line (wild type [wt]) and the transformant PSE19-3 (IRn) are shown; other transformants carrying the same sequences gave the same results (data not shown). PstI-digested phage lambda DNA was used as the size marker. The sizes in bold type refer to fragments mentioned in the text. The arrow in panel E indicates the position of the 713-bp fragment, which is unique for the endogenous ChsA gene. The intensity of this band is about the same in all lanes, relative to the internal DfrA control, irrespective whether the gene was silenced.
FIG. 5
FIG. 5
(A) Methylation pattern of the various T-DNA loci, where the black boxes indicate the positions of the ChsA sequences. (B) Endogenous ChsA gene, which contains a single intron indicated by the thick line separating the two exons. By using the Southern blot data in Fig. 4, the methylation status of the Sau3AI sites (open and solid circles) and EcoRI sites (E, triangles) was determined. The following criteria were used: the size of the hybridizing partially cleaved fragments; the intensity of the bands, which was quantified with a PhosphorImager; and whether the same fragment was detected by neighboring probes. Sau3AI sites that were not methylated or were barely methylated are indicated by open circles; sites indicated by solid circles are hypermethylated; sites indicated by partially filled circles are moderately methylated; and shaded circles denote sites that are moderately to severely methylated. This classification is also used to indicate the methylation status of the EcoRI sites indicated by the triangles. H, HindIII; E, EcoRI. For details about the maps, see the text and the legends to Fig. 1 and 4.
FIG. 6
FIG. 6
Proposed model for events that are initiated by an IR T-DNA locus and that lead to the posttranscriptional silencing of the host Chs genes or the transcriptional silencing of genes in a monomeric T-DNA locus (S). When two T-DNAs integrate into the genome as an IR, the sequences proximal to the center are preferentially methylated. If the transgene contains a promoter, this methylation is associated with TGS. A single-copy T-DNA locus (S) is methylated by the IR, and the pattern of methylation will be very similar to that of the IR. This may occur via ectopic DNA-DNA pairing between identical sequences of the IR and the S loci (left). An IR locus may also interact by DNA-DNA pairing with the homologous host gene(s) (right). This interaction does not lead to a dramatic change in DNA methylation but may cause a change in chromatin, which impedes regular transcription of the gene or RNA processing to some degree. In this way, “aberrant” or “unfinished” RNAs are produced, which either may be used as templates for the RNA-dependent RNA polymerase (17, 34) by which antisense RNAs are produced or may initiate a cycle of RNA-RNA pairing events by which they act as a kind of catalytic RNA (41). Both pathways result in the degradation of homologous transcripts and silence the genes posttranscriptionally.

Similar articles

Cited by

References

    1. Assaad F F, Tucker K L, Signer E R. Epigenetic repeat-induced gene silencing (RIGS) in Arabidopsis. Plant Mol Biol. 1993;22:1067–1085. - PubMed
    1. Barlow D P. Gametic imprinting in mammals. Science. 1995;270:1610–1613. - PubMed
    1. Barry C, Faugeron G, Rossignol J L. Methylation induced premeiotically in Ascobolus: coextension with DNA repeat lengths and effect on transcript elongation. Proc Natl Acad Sci USA. 1993;90:4557–4561. - PMC - PubMed
    1. Baulcombe D C, English J J. Ectopic pairing of homologous DNA and post-transcriptional silencing in transgenic plants. Curr Opin Biotechnol. 1996;7:173–180.
    1. Bender J, Fink G R. Epigenetic control of an endogenous gene family is revealed by a novel blue fluorescent mutant of Arabidopsis. Cell. 1995;83:725–734. - PubMed

Publication types

MeSH terms

LinkOut - more resources