. 1998 Nov;18(11):6482-92.
doi: 10.1128/MCB.18.11.6482.

Retinoic acid receptor gamma1 (RARgamma1) levels control RARbeta2 expression in SK-N-BE2(c) neuroblastoma cells and regulate a differentiation-apoptosis switch

Affiliations

Retinoic acid receptor gamma1 (RARgamma1) levels control RARbeta2 expression in SK-N-BE2(c) neuroblastoma cells and regulate a differentiation-apoptosis switch

N Ferrari et al. Mol Cell Biol. 1998 Nov.

Abstract

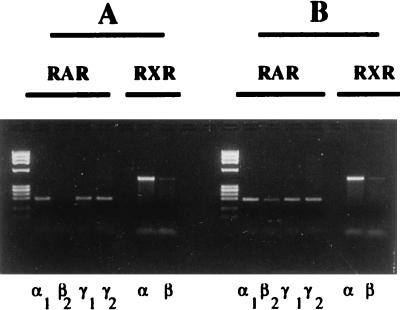
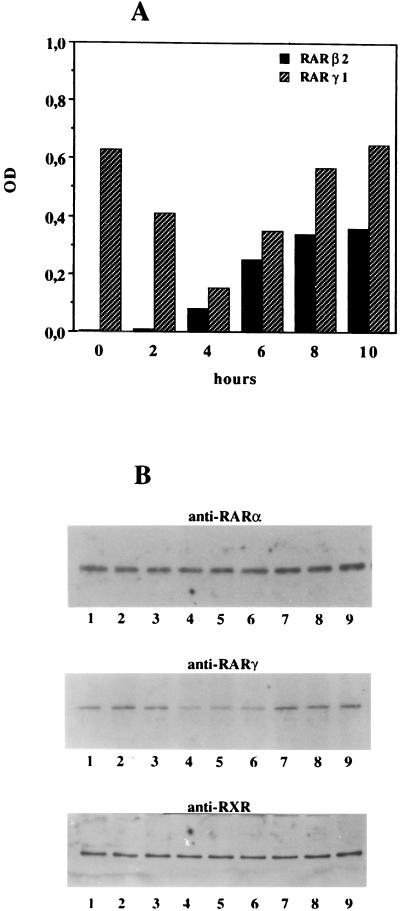
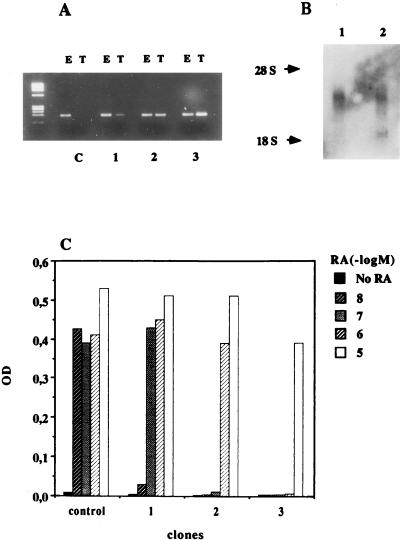
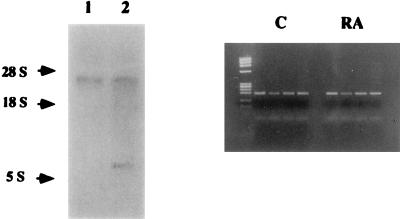
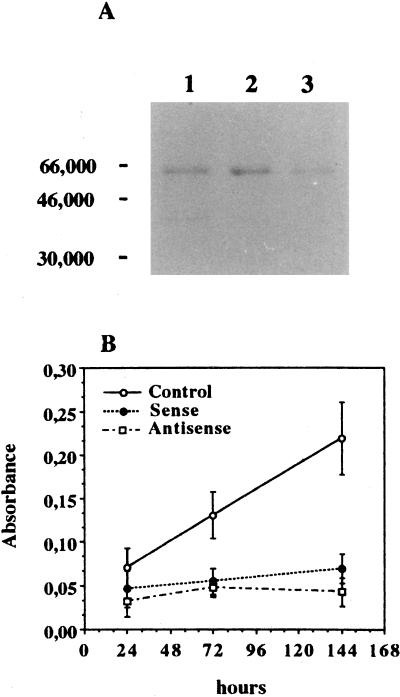
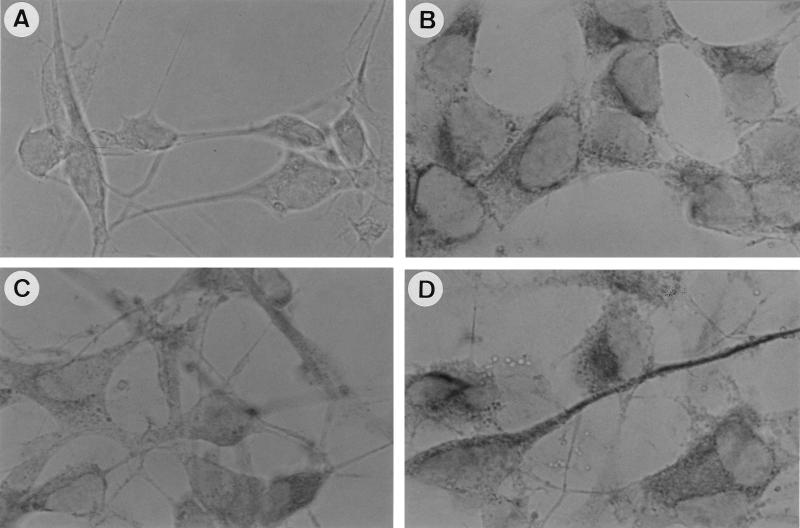
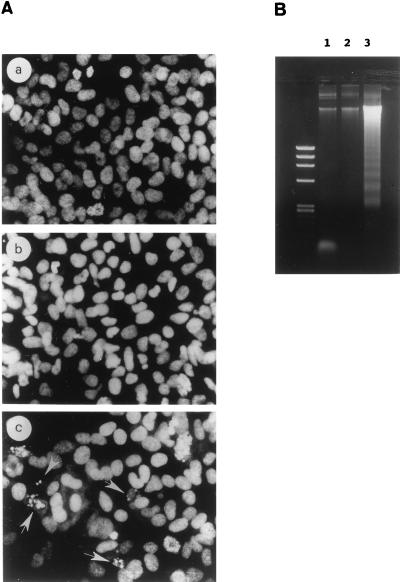
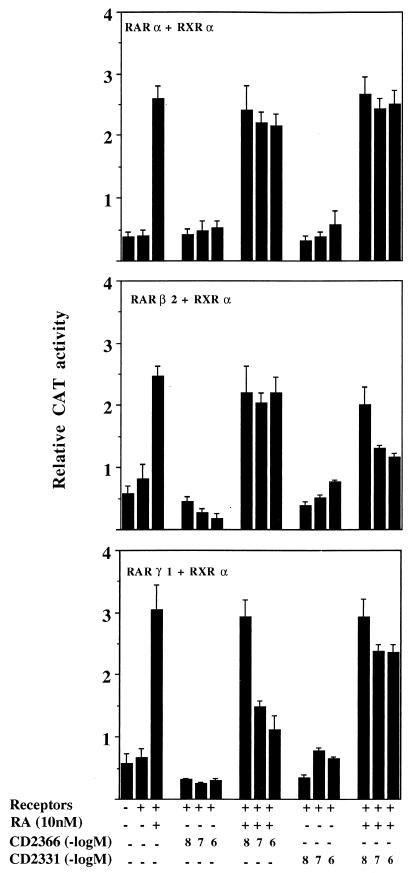
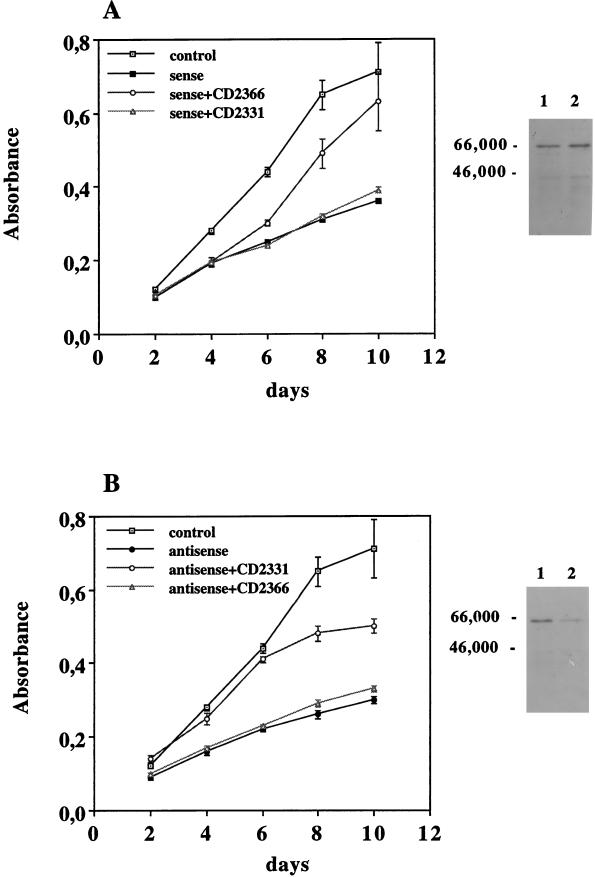
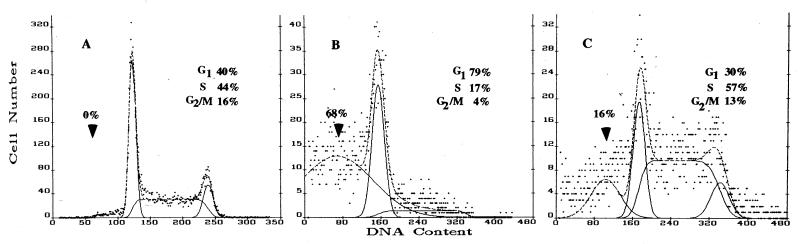
Vitamin A and its derivatives (retinoids) have profound effects on the proliferation and differentiation of many cell types and are involved in a diverse array of developmental and physiological regulatory processes, including those responsible for the development of the mature nervous system. Retinoid signals are mediated by retinoic acid (RA) receptors (RARs) and retinoid X receptors (RXRs), which show distinct spatio-temporal patterns of expression during development and in adult tissues. We have used SK-N-BE2(c) neuroblastoma cells to study the effects of reciprocal regulation of expression of various RARs. We show that in these cells RARgamma1 acts as a repressor of RARbeta2 transcription in the absence of an agonist. In the presence of RA, the expression of RARgamma1 is reduced and that of RARbeta2 is induced. Overexpression of RARgamma1 neutralizes the effects of RA on RARbeta induction. Expression of an RARgamma1-specific antisense construct leads to the constitutive expression of RARbeta2. Although both overexpression of RARgamma1 and its reduction of expression can result in inhibition of cell proliferation, they induce different morphological changes. Reduction of RARgamma1 (and induction of RARbeta) leads to increased apoptosis, whereas RARgamma1 overexpression leads to differentiation in the absence of apoptosis. Thus, RARgamma1 appears to control a differentiation-apoptosis switch in SK-N-BE2(c) neuroblastoma cells.


Figures

FIG. 1
FIG. 1
Analysis of RAR and RXR expression in the NB cell line SK-N-BE2(c). One microgram of total cellular RNA was analyzed by RT-PCR with a nested reaction protocol for RAR or RXR subtypes and isoforms as described in Materials and Methods. (A) Control cell cells; (B) cells treated for 24 h with 10 nM RA. The left lane in each panel contains molecular size markers (φX174 RFDNA/HaeIII fragments [GIBCO]).
FIG. 2
FIG. 2
Time course of RA-regulated expression of RARβ2 and RARγ1. (A) SK-N-BE2(c) cells were plated at 106 cells per 25-cm2 tissue culture flask, and after an overnight incubation at 37°C, RA was added (time zero) to a final concentration of 10 nM. At various times after RA addition, total RNA was isolated and 1 μg was analyzed by RT-PCR for RAR or RXR expression as described in the text. Values for RAR and RXR mRNAs were normalized to that for β-actin mRNA used as internal standard for each RNA sample. The degree of amplification was quantitated by scanning densitometry and plotted as a ratio of RAR to β-actin or RXR to β-actin. Only data relative to RARβ2 and RARγ1 are reported, since no modulations were observed for the remaining RARs and RXRs. Five independent experiments with very similar results were conducted. OD, optical density. (B) Ten micrograms of DNA-binding proteins obtained from control cells and cells exposed to 10 nM RA was electrophoresed on SDS-polyacrylamide gels, transferred to PVDF membranes, and probed with antibodies against RARα, RARγ, or RXR. Lanes 1, control cells; lanes 2, cells exposed to RA for 90 min; lanes 3 to lane 9, treated cells collected every 30 min. Prestained molecular size standards were used to identify bands of the correct molecular weight.
FIG. 3
FIG. 3
RARγ1 represses RARβ2 gene induction in a dose-dependent manner. (A) RT-PCR determination of RNA transcripts of endogenous (lanes E) and transfected (lanes T) RARγ1 in three selected clones compared to mock-transfected SK-N-BE2(c) cells (lanes C). The levels of transfected RARγ1 RNA expressed relative to the amount of endogenous RNA, which was taken as 1, were 0.5, 1, and 2 in clones 1, 2, and 3, respectively. (B) Expression of endogenous and transfected RARγ1 determined by Northern blot analysis with total RNA (20 μg) to evaluate their correct sizes. (C) Cells from clones 1, 2, and 3 were treated for 24 h in the presence of increasing RA concentrations or solvent alone. RNA was extracted, and RT-PCR was used to estimate the relative amounts of RARβ2 gene transcripts. RNA transcripts of the β-actin gene were used to normalize the RT-PCR assays. Densitometric scanning of the gel clearly shows that a correlation exists between total RARγ1 levels and the cell response to RA, evaluated as RARβ2 gene induction. OD, optical density.
FIG. 4
FIG. 4
Analysis of RAR transcripts in RARγ1 antisense transgene-transfected cells. (Left panel) Total RNAs (20 μg) from control (lane 1) and antisense transgene-transfected (lane 2) cells were analyzed by Northern blot hybridization to the BamHI insert of RARγ1 cDNA. Two bands of the correct size (3.3 and 0.167 kb, respectively) can be visualized in transfected cells. (Right panel) RT-PCR for RAR expression in transfected cells grown in regular medium (C) or in the presence of 10 nM RA for 24 h. From left to right are RARα1, -β21, and -γ2. Note that RARβ2 mRNA is present independent of RA addition. The left lane contains molecular size markers (φX174 RFDNA/HaeIII fragments [GIBCO]).
FIG. 5
FIG. 5
Morphological evaluation of transfected SK-N-BE2(c) cells compared to mock-transfected cells. (a) control cells; (b) cells cultured for 4 days in the presence of 10 μM RA; (c) RARγ1 sense transgene-transfected cells; (d) RARγ1 antisense transgene-transfected cells.
FIG. 6
FIG. 6
Inhibition of cell growth in stable transfected SK-N-BE2(c) cells. (A) Ten micrograms of DNA-binding proteins obtained from mock-transfected SK-N-BE2(c) cells (lane 1), RARγ1 sense transgene-transfected cells (lane 2), and RARγ1 antisense transgene-transfected cells (lane 3) was electrophoresed on an SDS-polyacrylamide gel, transferred to a PVDF membrane, and probed with anti-RARγ antibodies. Numbers on the left are molecular weights in thousands. (B) Recently thawed cells were kept in regular FCS-containing medium for 3 days and then seeded at 1,000 cells per well. Cell growth was evaluated every 48 h. The results were expressed as the A550 of MTT-derived formazan developed by sense and antisense RARγ1 cDNA-transfected cells compared to cells transfected with the empty vector. All data shown are representative of three independent experiments conducted in triplicate. Error bars indicate standard deviations.
FIG. 7
FIG. 7
Morphological differentiation of sense transgene-transfected SK-N-BE2(c) cells. Effects of RA (10 μM) and RARγ1 overexpression on cytoskeletal proteins were assessed by immunostaining analysis with the 2H3 monoclonal antibody against 165-kDa neurofilaments. (B) Control cells; (C) RA-treated cells; (D) RARγ1-overexpressing cells. As a negative control, RARγ1-overexpressing cells were reacted with anti-CD4 antibodies (A).
FIG. 8
FIG. 8
Apoptosis in RARγ1 antisense transgene-transfected SK-N-BE2(c) cells. (A) Morphological analysis of propidium iodide-stained nuclei from control cells (a) compared to RARγ1-overexpressing cells (b) and RARγ1 antisense transgene-transfected cells (c). Nuclei with typical morphological features of apoptosis are indicated (arrows). (B) Agarose gel electrophoresis of DNA from mock-transfected SK-N-BE2(c) cells (lane 1), RARγ1-overexpressing cells (lane 2), and RARγ1 antisense transgene-transfected cells (lane 3). Identical numbers of cells from each sample were lysed. DNA was isolated and electrophoresed on a 1.2% agarose gel. The left lane contains molecular size markers (φX174 RFDNA/HaeIII fragments [GIBCO]).
FIG. 9
FIG. 9
Antagonistic effects of the synthetic retinoids CD2331 and CD2366 on RA-induced activation of TREpal-tk-CAT and inhibition of specific receptor subtypes. CV-1 cells were transiently transfected with 100 ng of TREpal-tk-CAT reporter together with RARα and RXRα expression plasmids (top panel), RARβ2 and RXRα (middle panel), or RARγ1 and RXRα (bottom panel). Transfected cells were treated with 10 nM RA, with the indicated concentrations of CD2366 and CD2331, or with the combination of RA and antagonists. CAT activity was assayed after 24 h as described in Materials and Methods. The activation obtained in the presence of 10 nM RA alone represents the maximum value. The data shown represent the means from two experiments carried out in duplicate, and the error bars represent standard deviations. The standard errors of the mean values were between 0.02 and 0.5.
FIG. 10
FIG. 10
Effect of CD2331 and CD2366 antagonists on SK-N-BE2(c) cell proliferation when transfected with RARγ1 sense and antisense transgenes. Recently thawed cells were kept for 3 days in FCS-containing regular medium and then seeded at 1,000 cells/well in the presence of 1 μM antagonists. Cell growth was evaluated every 48 h by the MTT assay. Three independent experiments were conducted, with very similar results. The data shown represent the means of 10 points from a single experiment. Error bars represent standard deviations. Note that CD2366 can antagonize only RARγ1, while CD2331 is specific for RARβ2. Panels on the right show the relative amount of RARγ1 in transfected cells. Ten micrograms of DNA-binding proteins was electrophoresed on SDS-polyacrylamide gels, transferred to PVDF membranes, and probed with antibodies against RARγ1. Lanes 1, empty vector-transfected cells; lanes 2, RARγ1 sense (A) and RARγ1 antisense (B) transgene-transfected cells. Numbers on the left are molecular weights in thousands.
FIG. 11
FIG. 11
Effect of CD2331 on RARγ1 antisense transgene-transfected cell cycle. Floating and adherent mock-transfected SK-N-BE2(c) cells (A), antisense transgene-transfected cells (B), and antisense transgene-transfected cells cultured for 4 days in the presence of 1 μM CD2331 (C) were analyzed by flow cytometry. Arrowheads point to apoptotic cells.

Similar articles

Cited by

References

    1. Abemayor E, Chang B, Sidell N. Effects of retinoic acid on the in vivo growth of human neuroblastoma cells. Cancer Lett. 1990;55:1–5. - PubMed
    1. Abemayor E, Sidell N. Human neuroblastoma cell lines as models for the in vitro study of neoplastic and neuronal cell differentiation. Environ Health Perspect. 1989;80:3–15. - PMC - PubMed
    1. Alles A J, Sulik K K. Retinoic acid-induced spina bifida: evidence for a pathogenetic mechanism. Development. 1990;108:73–81. - PubMed
    1. Andrews N C, Faller D V. A rapid micropreparation technique for extraction of DNA-binding proteins from limiting numbers of mammalian cells. Nucleic Acids Res. 1991;19:2499. - PMC - PubMed
    1. Biedler J L, Helson L, Spengler B A. Morphology and growth, tumorigenicity, and cytogenetics of human neuroblastoma cells in continuous culture. Cancer Res. 1973;33:2643–2652. - PubMed

Publication types

MeSH terms

LinkOut - more resources