. 1998 Oct;153(4):1157-68.
doi: 10.1016/S0002-9440(10)65660-X.

Effects of growth factors and basement membrane proteins on the phenotype of U-373 MG glioblastoma cells as determined by the expression of intermediate filament proteins

Affiliations

Effects of growth factors and basement membrane proteins on the phenotype of U-373 MG glioblastoma cells as determined by the expression of intermediate filament proteins

S Sultana et al. Am J Pathol. 1998 Oct.

Abstract

Various growth factors and basement membrane proteins have been implicated in the pathobiology of astrocytomas. The goal of this study was to determine the relative contribution of these two factors in modulating the phenotype of U-373 MG glioblastoma cells as determined by the expression of the intermediate filament proteins glial fibrillary acidic protein, vimentin, and nestin. For these determinations, cells plated in serum-free medium were treated either with growth factors binding to tyrosine kinase receptors including transforming growth factor-alpha, epidermal growth factor, platelet-derived growth factor-AA, basic fibroblast growth factor, and insulin-like growth factor-1 or with basement membrane proteins including collagen IV, laminin, and fibronectin. The changes in the expression levels of intermediate filament proteins in response to these treatments were analyzed by quantitation of immunoblots. The results demonstrate that collagen IV and growth factors binding to tyrosine kinase receptors decrease the glial fibrillary acidic protein content of U-373 MG cells. Growth factors binding to tyrosine kinase receptors also decrease the vimentin content of these cells but do not affect their nestin content. On the other hand, basement membrane proteins decrease the nestin content of U-373 MG cells but do not affect their vimentin content. The significance of these results with respect to the role played by different factors in modulating the phenotype of neoplastic astrocytes during tumor progression is discussed.


Figures
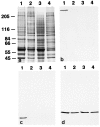
Figure 1.
Figure 1.
a: Coomassie Blue-stained SDS-polyacrylamide gel loaded with whole cell extracts of U-373 MG (lane 1), U-87 MG (lane 2), U-118 MG (lane 3 ), and Hs 683 (lane 4) cells. Molecular mass are indicated in kilodaltons at the left of the gel. b-d: Blots of gels similar to a incubated with the following primary antibodies: anti-nestin (b), anti-GFAP (c), and anti-vimentin (d). Note that U373-MG is the only cell line to co-express GFAP and nestin.
Figure 2.
Figure 2.
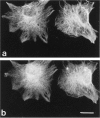
Double immunofluorescent staining of U-373 MG glioblastoma cells with vimentin (a) and nestin (b) antibodies. Nestin antibodies stain a filamentous network similar to that stained by anti-vimentin. Scale bar = 10 μm.
Figure 3.
Figure 3.
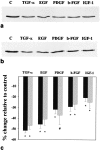
Effect of growth factors on GFAP protein levels in U-373 MG cells. a: Blot corresponding to a gel loaded with equal amounts of proteins; b: blot corresponding to a gel loaded with equal number of cells. In a and b, the lane labeled C shows the result for the control sample, and subsequent lanes show the results for cells treated with different growth factors as indicated above each lane. c: Histogram showing the changes in GFAP protein levels in growth factor treated cells relative to control cells. Values are calculated from seven different experiments and are expressed as means ± SEM. Black bars represent values determined by comparing blots obtained from gels loaded with equal amounts of proteins, and gray bars represent values determined by comparing blots obtained from gels loaded with equal number of cells. Changes that are statistically different from control are indicated by * (P ≤ 0.001) or # (P = 0.005).
Figure 4.
Figure 4.
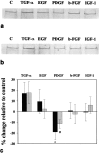
Effect of growth factors on vimentin protein levels in U-373 MG cells. a: Blot corresponding to a gel loaded with equal amounts of proteins; b: blot corresponding to a gel loaded with equal number of cells. In a and b, the lane labeled C shows the result for the control sample, and subsequent lanes show the results for cells treated with different growth factors as indicated above each lane. c: Histogram showing the changes in vimentin protein levels in growth factor treated cells relative to control cells. Values are calculated from seven different experiments and are expressed as means ± SEM. Black bars represent values determined by comparing blots obtained from gels loaded with equal amounts of proteins, and gray bars represent values determined by comparing blots obtained from gels loaded with equal number of cells. Changes that are statistically different from control are indicated by * (P ≤ 0.001), # (P ≤ 0.005) or ## (P = 0.013).
Figure 5.
Figure 5.
Effect of growth factors on nestin protein levels in U-373 MG cells. a: Blot corresponding to a gel loaded with equal amounts of proteins; b: blot corresponding to a gel loaded with equal number of cells. In a and b, the lane labeled C shows the result for the control sample and subsequent lanes show the results for cells treated with different growth factors as indicated above each lane. c: Histogram showing the changes in nestin protein levels in growth factor treated cells relative to control cells. Values are calculated from seven different experiments and are expressed as means ± SEM. Black bars represent values determined by comparing blots obtained from gels loaded with equal amounts of proteins, and gray bars represent values determined by comparing blots obtained from gels loaded with equal number of cells. Changes that are statistically different from control are indicated by * (P = 0.022) or # (P = 0.015).
Figure 6.
Figure 6.
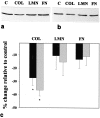
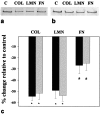
Effect of BM proteins on GFAP protein levels in U-373 MG cells. a: Blot corresponding to a gel loaded with equal amounts of proteins; b: blot corresponding to a gel loaded with equal number of cells. In a and b, the lane labeled C shows the result for the control sample, and subsequent lanes show the results for cells plated on collagen IV (COL), laminin (LMN), or fibronectin (FN). c: Histogram showing the changes in GFAP protein levels in cells plated on BM proteins relative to control cells. Values are calculated from seven different experiments and are expressed as means ± SEM. Black bars represent values determined by comparing blots obtained from gels loaded with equal amounts of proteins, and gray bars represent values determined by comparing blots obtained from gels loaded with equal number of cells. Changes that are statistically different from control are indicated by * (P ≤ 0.001).
Figure 7.
Figure 7.
Effect of BM proteins on vimentin protein levels in U-373 MG cells. a: Blot corresponding to a gel loaded with equal amounts of proteins; b: blot corresponding to a gel loaded with equal number of cells. In a and b, the lane labeled C shows the result for the control sample, and subsequent lanes show the results for cells plated on collagen IV (COL), laminin (LMN), or fibronectin (FN). c: Histogram showing the changes in vimentin protein levels in cells plated on BM proteins relative to control cells. Values are calculated from seven different experiments and are expressed as means ± SEM. Black bars represent values determined by comparing blots obtained from gels loaded with equal amounts of proteins, and gray bars represent values determined by comparing blots obtained from gels loaded with equal number of cells. Changes are not statistically different from control.
Figure 8.
Figure 8.
Effect of BM proteins on nestin protein levels in U-373 MG cells. a: Blot corresponding to a gel loaded with equal amounts of proteins, b: blot corresponding to a gel loaded with equal number of cells. In a and b, the lane labeled C shows the result for the control sample, and subsequent lanes show the results for cells plated on collagen IV (COL), laminin (LMN), or fibronectin (FN). c: Histogram showing the changes in nestin protein levels in cells plated on BM proteins relative to control cells. Values are calculated from seven different experiments and are expressed as means ± SEM. Black bars represent values determined by comparing blots obtained from gels loaded with equal amounts of proteins, and gray bars represent values determined by comparing blots obtained from gels loaded with equal number of cells. Changes that are statistically different from control are indicated by * (P ≤ 0.001) or # (0.001<P ≤ 0.005).

Similar articles

Cited by

References

    1. Maruno M, Kovach JS, Kelly PJ, Yanagihara T: Transforming growth factor-α, epidermal growth factor receptor, and proliferating potential of benign and malignant gliomas. J Neurosurg 1991, 75:97-102 - PubMed
    1. Samuels V, Barrett JM, Bockman S, Pantazis CG, Allen MB: Immunocytochemical study of transforming growth factor expression in benign and malignant gliomas. Am J Pathol 1989, 134:895-902 - PMC - PubMed
    1. Van der Valk P, Lindeman J, Kamphorst W: Growth factor profiles of human gliomas. Do non-tumour cells contribute to tumour growth in glioma? Ann Oncol 1997, 8:1023-1029 - PubMed
    1. Fleming TP, Saxena A, Clark WC, Robertson JT, Oldfield EH, Aaronson SA, Ali IU: Amplification and/or overexpression of platelet derived growth factor receptors and epidermal growth factor receptors in human glial tumors. Cancer Res 1992, 52:4550-4553 - PubMed
    1. Hermanson M, Funa K, Hartman M, Claesson Welsh L, Heldin CH, Westermark B, Nister M: Platelet-derived growth factor and its receptors in human glioma tissue: expression of messenger RNA and protein suggests the presence of autocrine and paracrine loops. Cancer Res 1992, 52:3213-3219 - PubMed

Publication types

MeSH terms

Substances