Comparative Study
. 1998 Oct 19;188(8):1473-84.
doi: 10.1084/jem.188.8.1473.

Antigen-dependent and -independent Ca2+ responses triggered in T cells by dendritic cells compared with B cells

Affiliations
Comparative Study

Antigen-dependent and -independent Ca2+ responses triggered in T cells by dendritic cells compared with B cells

J Delon et al. J Exp Med. .

Abstract

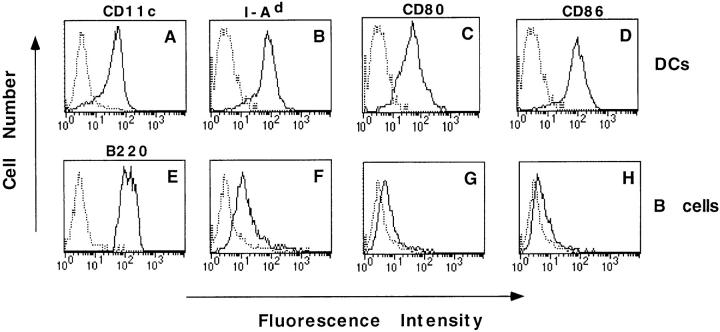
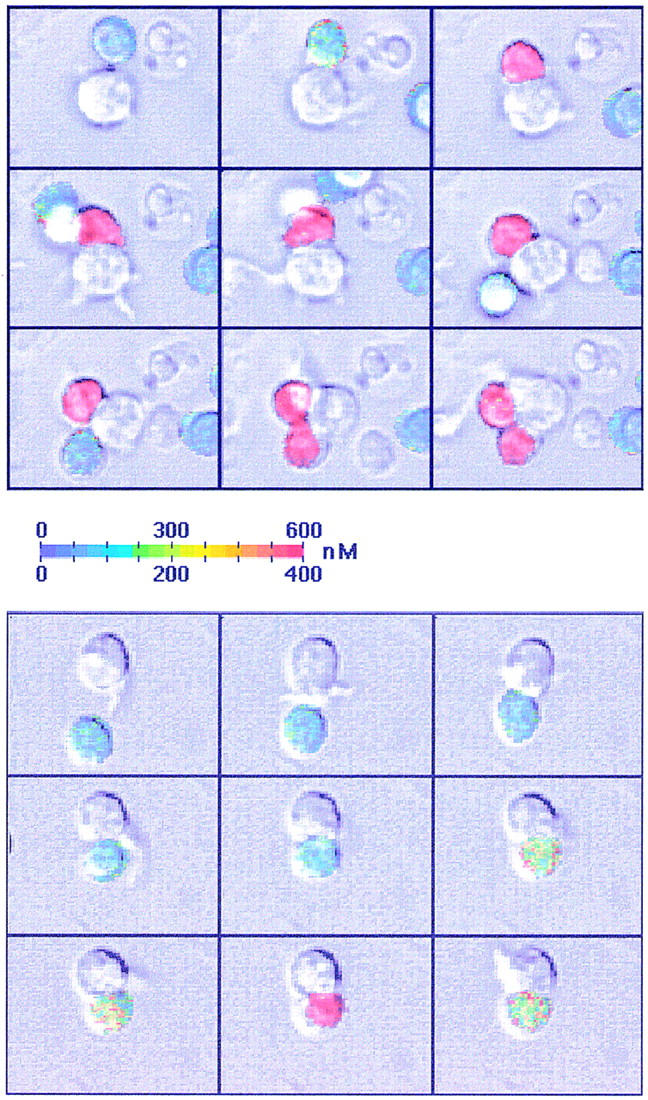
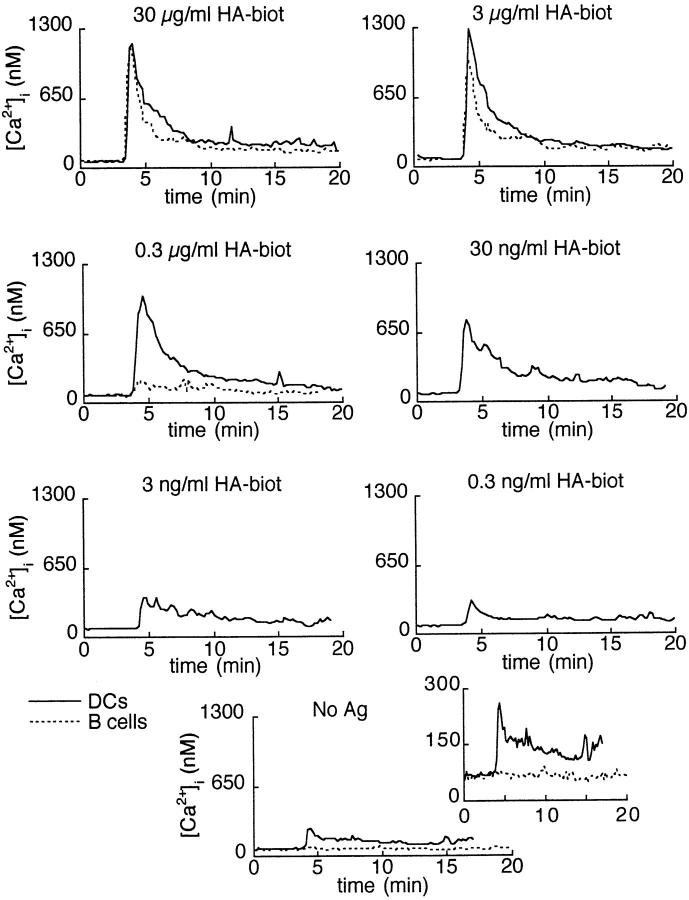
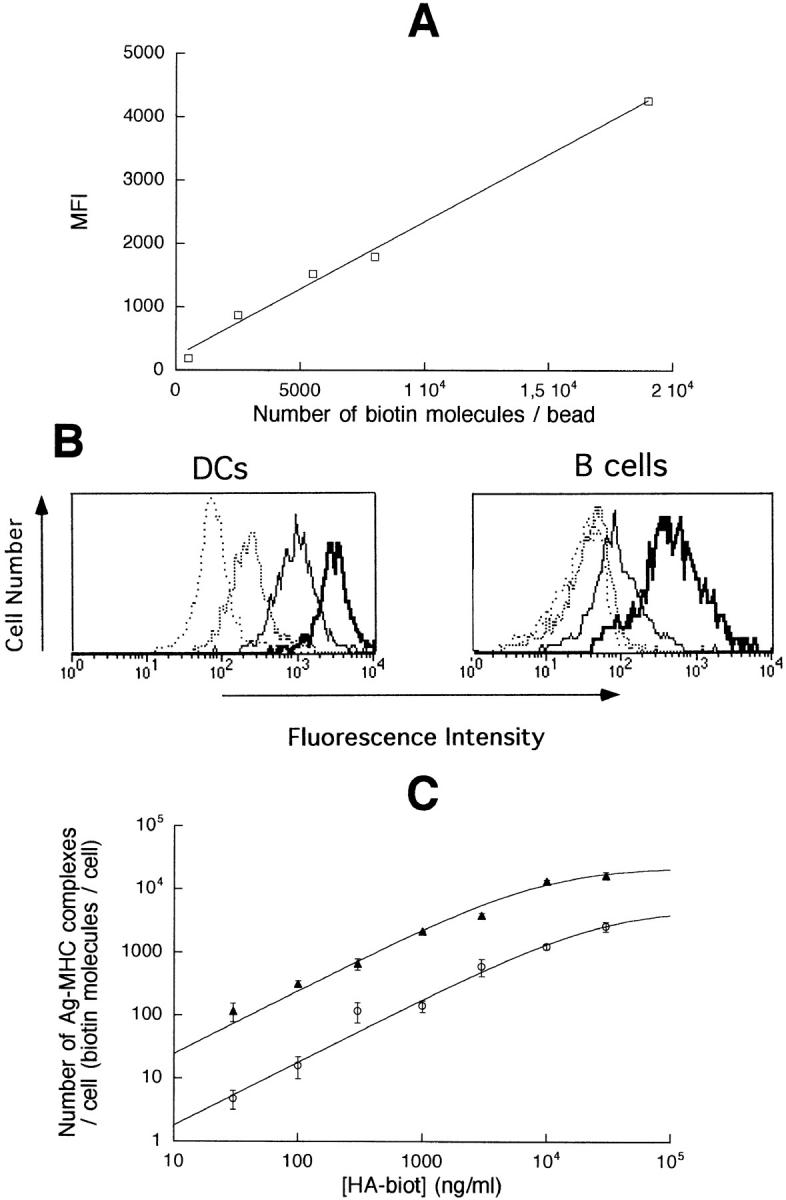
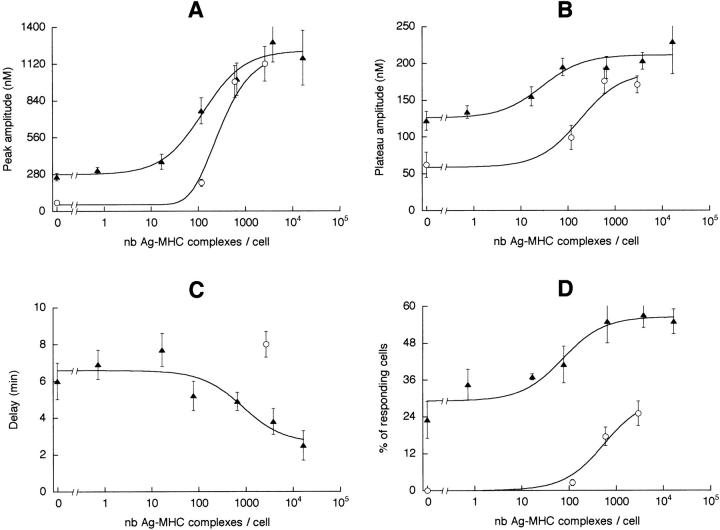
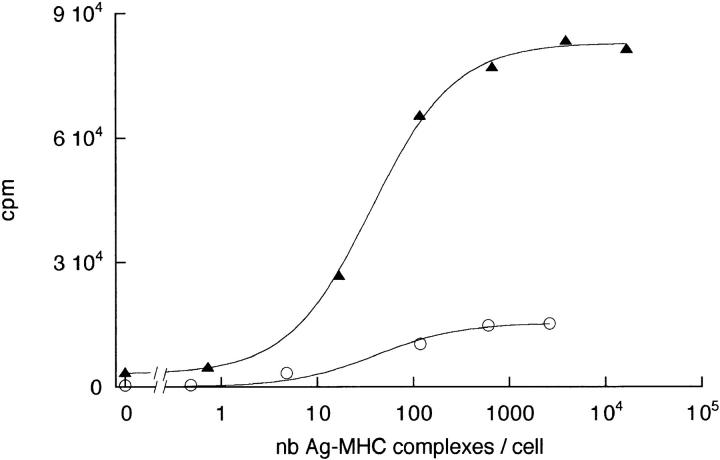
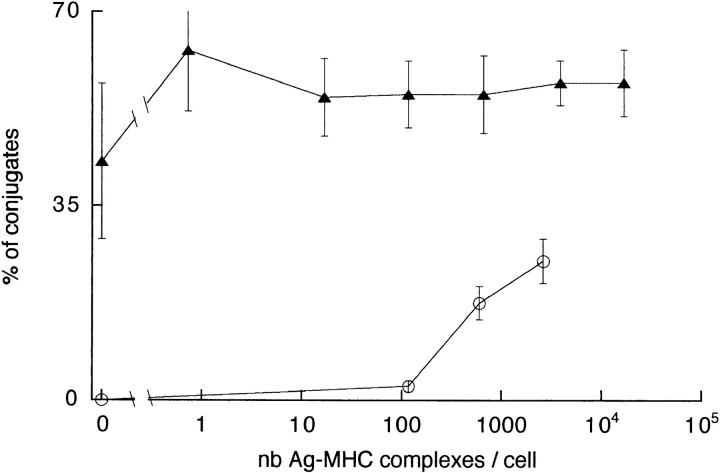
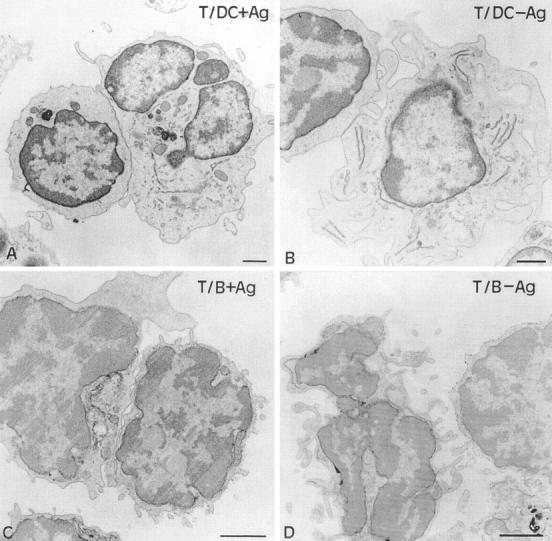
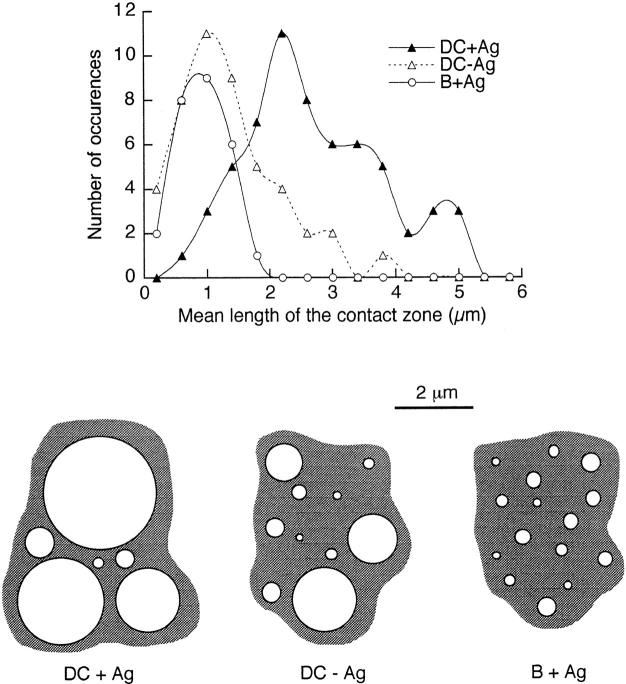
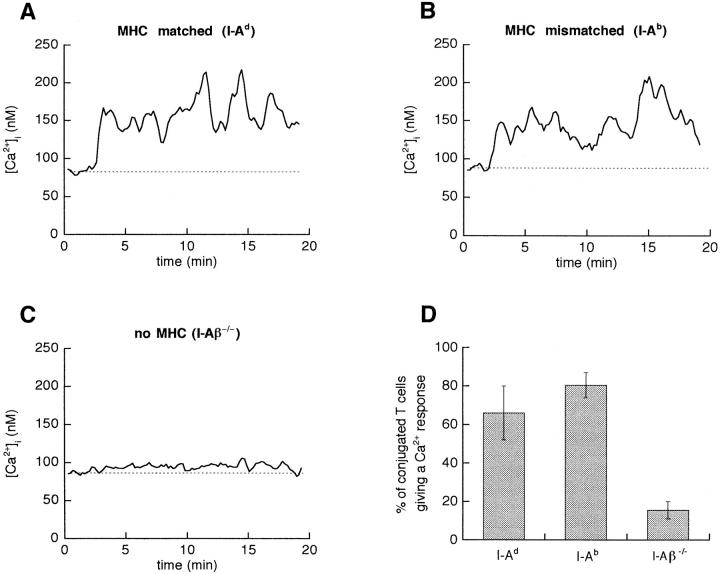
Dendritic cells (DCs) are much more potent antigen (Ag)-presenting cells than resting B cells for the activation of naive T cells. The mechanisms underlying this difference have been analyzed under conditions where ex vivo DCs or B cells presented known numbers of specific Ag-major histocompatibility complex (MHC) complexes to naive CD4(+) T cells from T cell antigen receptor (TCR) transgenic mice. Several hundred Ag-MHC complexes presented by B cells were necessary to elicit the formation of a few T-B conjugates with small contact zones, and the resulting individual T cell Ca2+ responses were all-or-none. In contrast, Ag-specific T cell Ca2+ responses can be triggered by DCs bearing an average of 30 Ag-MHC complexes per cell. Formation of T-DC conjugates is Ag-independent, but in the presence of the Ag, the surface of the contact zone increases and so does the amplitude of the T cell Ca2+ responses. These results suggest that Ag is better recognized by T cells on DCs essentially because T-DC adhesion precedes Ag recognition, whereas T-B adhesion requires Ag recognition. Surprisingly, we also recorded small Ca2+ responses in T cells interacting with unpulsed DCs. Using DCs purified from MHC class II knockout mice, we provide evidence that this signal is mostly due to MHC-TCR interactions. Such an Ag-independent, MHC-triggered calcium response could be a survival signal that DCs but not B cells are able to deliver to naive T cells.


Figures

Figure 1
Figure 1
Surface phenotype of DCs (A–D) and B cells (E–H). Purified syngenic APCs were analyzed for surface expression of CD11c (A), B220 (E), I-Ad (B and F), CD80 (C and G), and CD86 (D and H). Solid line, Specifically labeled APCs. Broken line, Staining with a control mAb.
Figure 2
Figure 2
DC-induced T cell Ca2+ responses. Transmitted light images were superimposed on the color-coded Ca2+ images. Top, The DCs have been pulsed with 0.3 μg/ml HA-biot; two naive T cells were successively activated by the same DC. Bottom, Response of a T cell in the absence of Ag. Interval between two images: 47 s (top) and 93 s (bottom). The [Ca2+]i scale is 0–600 nM (top) or 0–400 nM (bottom).
Figure 3
Figure 3
Average T cell Ca2+ responses triggered by different concentrations of peptide presented by DCs (solid line) or B cells (broken line). 4–49 individual Ca2+ responses from 3–4 independent experiments were included in these results.
Figure 4
Figure 4
Quantification of the number of Ag molecules present on both APC types. (A) MFI of calibration beads bearing different numbers of biotin molecules. (B) Staining of APCs pulsed with 30 μg/ml HA (negative control, spaced broken line), 0.3 μg/ml HA-biot (broken line), 3 μg/ml HA-biot (solid line), and 30 μg/ml HA-biot (heavy solid line). (C) Number of biotin molecules on B cells (open circles) or DCs (  filled triangles) pulsed with different concentrations of HA-biot. Data are derived from five independent experiments.
Figure 5
Figure 5
Characteristics of the T cell Ca2+ responses triggered by different numbers of specific peptide–MHC complexes present on DCs (  filled triangles) or B cells (open circles). (A) Amplitude of the peak. (B) Amplitude of the plateau measured 10 min after the peak. (C) Delay. For B cells, given the large dispersion of the delays, data obtained with Ag concentrations of 3 and 30 μg/ml have been pooled in order to average a sufficient number of measurements. (D) Percentage of responding T cells. nb, Number.
Figure 6
Figure 6
T cell proliferation in response to B cells (open circles) or DCs (  filled triangles) presenting different numbers (nb) of peptide–MHC complexes. The T to APC ratio is 1:6 with B cells and 1:1 with DCs.
Figure 7
Figure 7
Percentage of T cells involved in T–B (open circles) or T–DC (  filled triangles) conjugates as a function of the number (nb) of peptide– MHC complexes presented.
Figure 8
Figure 8
Analysis by electron microscopy of conjugates between T cells and either DCs with (A) or without (B) Ag, or immunogold-stained B cells with (C) or without (D) Ag. For each image, the T cell engaged in the conjugate is at the left of the APC. Bars, 1 μm.
Figure 9
Figure 9
Analysis of the sizes of contact zones. Top, Distribution of the lengths of the contact zones between T cells and either DCs (with or without 30 μg/ml HA-biot) or B cells (30 μg/ml HA-biot). Bottom, Schematic two-dimensional views of contact zones, based on the average number of elementary contacts per section and on the lengths of the elementary contacts, representative of the experimental means and variabilities.
Figure 10
Figure 10
Analysis of Tg T cell Ca2+ responses activated by unpulsed DCs. Typical single cell Ca2+ responses of T cells interacting with DCs expressing either MHC class II of the correct haplotype (I-Ad, A), or a mismatched MHC (I-Ab, B) or no MHC (I-Aβ−/−, C). (D) Percentage of T cells engaged in a T–DC conjugate which give a Ca2+ response. Data from two to five independent experiments.

Similar articles

Cited by

References

    1. Steinman RM. The dendritic cell system and its role in immunogenicity. Annu Rev Immunol. 1991;9:271–296. - PubMed
    1. Inaba K, Steinman RM. Accessory cell–T lymphocyte interactions. Antigen-dependent and -independent clustering. J Exp Med. 1986;163:247–261. - PMC - PubMed
    1. Metlay JP, Pure E, Steinman RM. Distinct features of dendritic cells and anti-Ig activated B cells as stimulators of the primary mixed leukocyte reaction. J Exp Med. 1989;169:239–254. - PMC - PubMed
    1. Croft M, Duncan DD, Swain SL. Response of naive antigen-specific CD4+T cells in vitro: characteristics and antigen-presenting cell requirements. J Exp Med. 1992;176:1431–1437. - PMC - PubMed
    1. Young JW, Inaba K. Dendritic cells as adjuvants for class I major histocompatibility complex–restricted antitumor immunity. J Exp Med. 1996;183:7–11. - PMC - PubMed

Publication types