. 1998 Nov 15;513 ( Pt 1)(Pt 1):157-70.
doi: 10.1111/j.1469-7793.1998.157by.x.

Two types of parasympathetic preganglionic neurones in the superior salivatory nucleus characterized electrophysiologically in slice preparations of neonatal rats

Affiliations

Two types of parasympathetic preganglionic neurones in the superior salivatory nucleus characterized electrophysiologically in slice preparations of neonatal rats

R Matsuo et al. J Physiol. .

Abstract

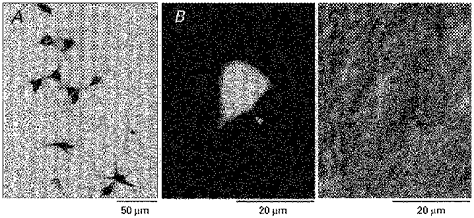
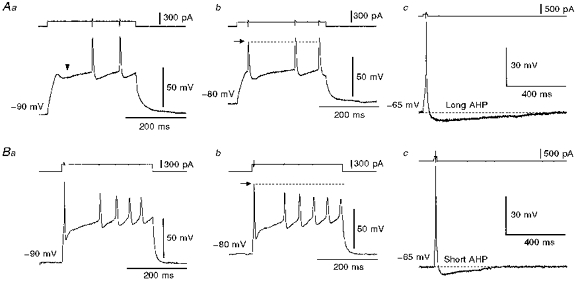
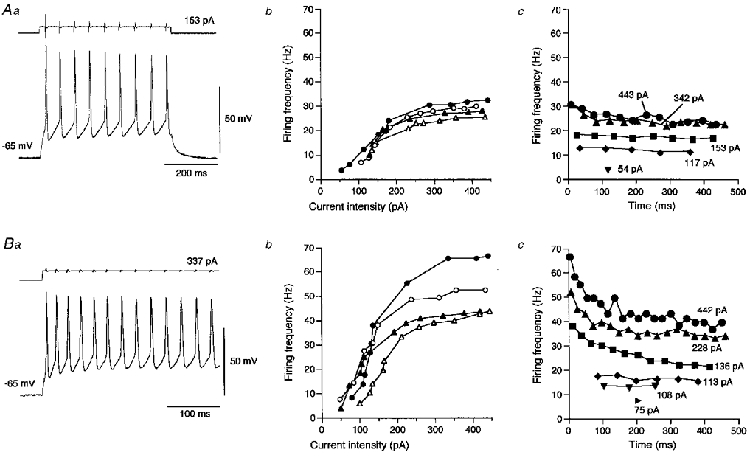
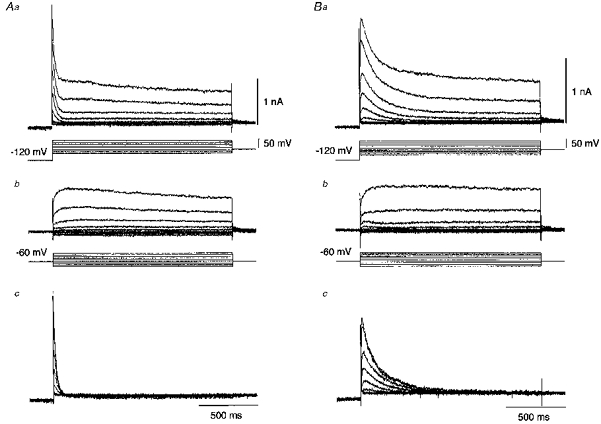
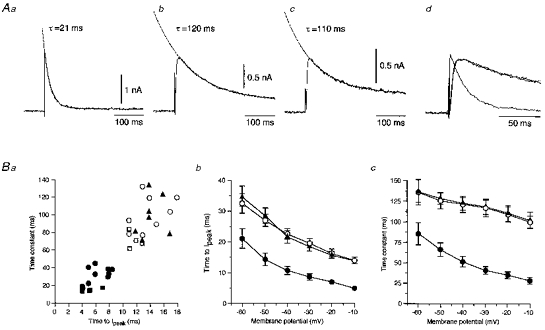
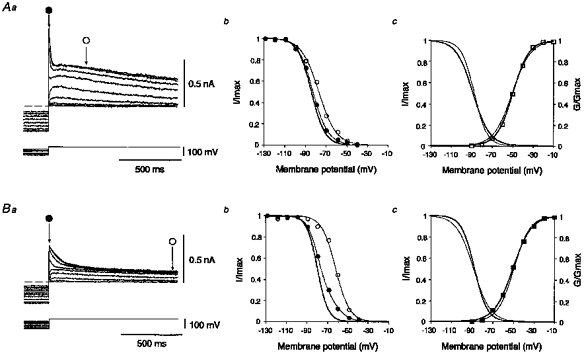
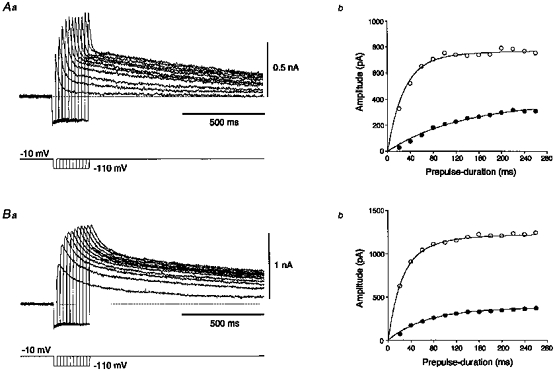
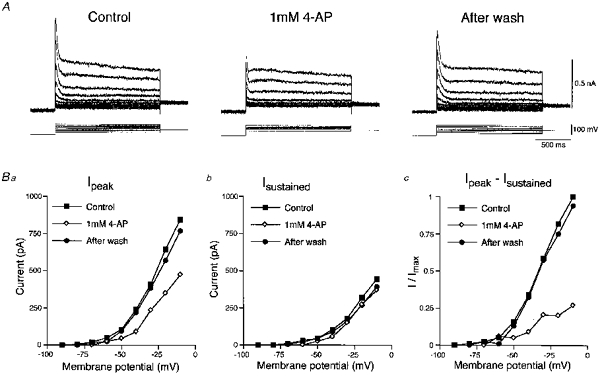
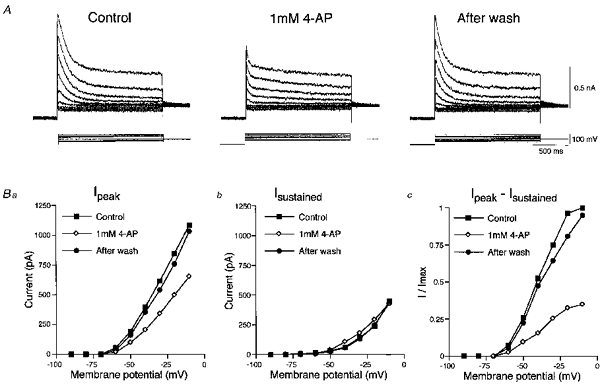
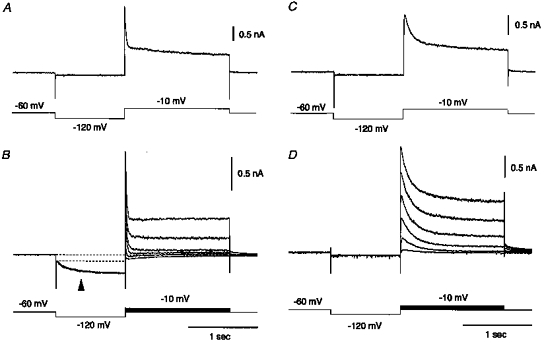
1. The electrophysiological properties of parasympathetic preganglionic neurones in the superior salivatory nucleus were studied in thin- and thick-slice preparations of rats aged 1 and 2 weeks using the whole-cell patch-clamp technique. 2. The superior salivatory neurones were identified by a retrograde tracing method with dextran-tetramethylrhodamine-lysine. The injection of the tracer into the chorda-lingual nerve labelled the neurones innervating the submandibular ganglia and those innervating the intra-lingual ganglia, while the injection into the tip of the tongue labelled the latter group of neurones. 3. Firing characteristics were investigated mainly in the neurones of 6-8 days postnatal rats. In response to an injection of long depolarizing current pulses at hyperpolarized membrane potentials (< -80 mV) under a current clamp, the neurones labelled from the nerve displayed a train of action potentials with either a long silent period preceding the first spike (late spiking pattern) or a long silent period interposed between the first and second spikes (interrupted spiking pattern). The neurones labelled from the tongue invariably displayed the interrupted spiking pattern. 4. Under a voltage clamp, among the neurones from 6-8 days postnatal rats, those labelled from the nerve expressed either a fast or a slow transient outward current (A-current), while those labelled from the tongue invariably showed a slow transient outward current. Both the fast and slow A-currents were largely depressed by 1 mM 4-aminopyridine. 5. Similar fast and slow A-currents were observed in the neurones of rats aged 14-15 days. Both the time to peak and decay time constant of these A-currents were accelerated, suggesting a developmental trend of maturation in the activation and inactivation kinetics between 6 and 15 days postnatal. 6. Based on the differences in the firing pattern and outward current, the superior salivatory neurones can be separated into two distinct types. We discuss the functional aspects of these two types of neurones with reference to their target organs.


Figures

Figure 1
Figure 1. Morphology of the superior salivatory neurones
A, the superior salivatory neurones retrogradely labelled by the injection of horseradish peroxidase into the chorda-lingual nerve of a 7-day-old rat. The cell body size and the number of primary dendrites were similar to those of adult rats. B and C, a neurone of a 7-day-old rat labelled by dextran-tetramethylrhodamine lysine injected into the chorda-lingual nerve, under fluorescence and Nomarski images, respectively (indicated by arrowheads). These photomicrographs were taken after whole-cell recording.
Figure 2
Figure 2. Two types of firing pattern in the superior salivatory neurones
A, a neurone labelled from the chorda-lingual nerve displayed late (a) and interrupted (b) spiking patterns in response to injections of long depolarizing current pulses applied at membrane potentials of −90 and −80 mV, respectively. The arrowhead (a) indicates a hyperpolarizing notch. This neurone showed a long after-hyperpolarization (AHP) near its resting membrane potential (c). B, a neurone labelled from the tongue displayed the interrupted spiking pattern at membrane potentials more hyperpolarized than −80 mV (a and b). This neurone showed a relatively short after-hyperpolarization near its resting membrane potential (c).
Figure 3
Figure 3. Firing characteristics of two types of superior salivatory neurones
In A and B, a shows sample records of trains of spikes evoked at −65 mV in 2 types of neurones displaying late (A) and interrupted (B) spiking patterns. b shows the relationship between firing frequency and current intensity obtained from 4 neurones of each type. Each frequency was calculated from the inter-spike interval between the first and second spikes. c shows the typical time course of firing frequencies calculated from successive inter-spike intervals in trains of spikes evoked by current pulses of various intensities.
Figure 4
Figure 4. Isolation of A-current from total outward current
A and B were obtained from the superior salivatory neurones labelled from the chorda-lingual nerve. Depolarizing voltage commands (1.5 s) in steps of +10 mV were followed by a 1 s hyperpolarizing prepulse to −120 mV either immediately (a) or with the interposition of a 200 ms delay at a holding potential of −60 mV between the prepulse and command pulses (b). c, the digital subtraction of currents in b from currents in a revealed isolated transient outward currents.
Figure 5
Figure 5. Time course of the isolated A-currents
A, the isolated fast A-current recorded from the superior salivatory neurones labelled from the chorda-lingual nerve (a) and the slow A-currents recorded from neurones labelled from the nerve (b) and the tongue (c). Traces of a, b and c were superimposed at a faster time base in d. Ba, relationships between the decay time constants and the time to peak of the isolated fast (n = 12: •, recorded from the neurones labelled from the chorda-lingual nerve) and slow A-currents (n = 8: ○, recorded from the neurones labelled from the chorda-lingual nerve; n = 7: ▴, recorded from those labelled from the tongue). ○ (n = 4) and □ (n = 4) indicate the values of the isolated fast and slow A-currents, respectively, obtained from 14- to 15-day-old rats. Each value was obtained at −10 mV. The mean time to peak (b) and the mean decay time constant (c) decreased with the membrane depolarization of test pulses.
Figure 6
Figure 6. Voltage dependence of activation and inactivation for A-currents
Aa and Ba, superimposed traces of fast and slow A-currents followed by slowly decaying components elicited at −10 mV on return from various hyperpolarizing voltage steps. The dashed lines indicate the base-line current. Ab and Bb, the relative amplitudes (I/Imax) of relaxing outward currents versus prepulse voltages. Thin continuous curves with ○ are inactivating curves for the slowly decaying components measured at ○ in Aa and Ba. Thin continuous curves with • are those for the peak outward currents measured at • in Aa and Ba. Thick continuous curves are the mathematically estimated inactivation curves for fast and slow A-currents (see text). Ac and Bc, the mean normalized conductance (G/Gmax) of the isolated fast (n = 9, □) and slow A-currents (n = 10, ○) were plotted against the voltage of command pulses. The thick continuous curves represent the voltage-dependent activation of the fast (Ac) and slow A-currents (Bc). For comparison, the voltage-dependent activation (thin continuous curves) of the slow and fast A-currents were also drawn in Ac and Bc, respectively. The thick continuous curves (left) represent the mathematically isolated mean inactivation of the fast (n = 7, Ac) and slow A-currents (n = 9, Bc). For comparison, the voltage-dependent inactivation (thin continuous curves at left) of the slow and fast A-currents were also drawn in Ac and Bc, respectively.
Figure 7
Figure 7. The time-dependent recovery from inactivation of A-currents
Aa and Ba, superimposed traces of fast (A) and slow (B) transient outward currents followed by slowly decaying components elicited at −10 mV on return from hyperpolarizing prepulses of various durations stepped to −110 mV. Ab and Bb, plots of the amplitudes of peak outward currents (○) and slowly decaying components (•) versus prepulse duration. The slowly decaying components recovered mono-exponentially. The recovery time courses of the peak currents were bi-exponential with time constants of τ1 = 132.2 ms, τ2 = 28.9 ms and τ1 = 70.4 ms, τ2 = 21.2 ms, respectively. Each of the latter time constants represents the recovery time constant of the fast (28.9 ms) and slow A-current (21.2 ms).
Figure 8
Figure 8. Effects of 4-aminopyridine on the fast A-current
A, sample records of fast transient outward currents followed by slowly decaying components evoked at various membrane potentials before, during and after the application of 1 mm 4-aminopyridine. Ba, the amplitudes of peak outward currents (Ipeak) obtained before (○), during (⋄) and after the application of 4-aminopyridine (•) were plotted against the membrane potentials. Bb, the amplitudes of the slowly decaying components were measured 300 ms after the onset of command pulses (Isustained). Bc, the amplitudes of the fast A-currents were estimated by subtracting Isustained from Ipeak. The fast A-currents were largely depressed voltage independently.
Figure 9
Figure 9. Effects of 4-aminopyridine on the slow A-current
A, sample records of slow transient outward currents followed by slowly decaying components evoked at various membrane potentials before, during and after the application of 1 mm 4-aminopyridine. Ba, the peak amplitudes of the slow transient outward currents (Ipeak) obtained before (▪), during (⋄) and after the application of 1 mm 4-aminopyridine (•) were plotted against the membrane potentials. Bb, the amplitudes of the slowly decaying components were measured 1000 ms after the onset of command pulses (Isustained). Bc, the amplitudes of the slow A-currents were estimated by subtracting Isustained from Ipeak. The slow A-currents were largely depressed voltage independently.
Figure 10
Figure 10. Fast and slow A-currents in 7- and 15-day-old rats
Fast and slow A-currents obtained from the superior salivatory neurones labelled from the chorda-lingual nerve of 7-day-old (A and C, respectively) and 15-day-old rats (B and D, respectively). At a holding potential of −60 mV, depolarizing command pulses of 1500 ms duration stepped to −10 mV for A and C, and stepped between −60 and −10 mV for B and D were applied after a 1000 ms hyperpolarizing prepulse to −120 mV. A hyperpolarization-activated inward current (arrowhead in B) is seen during the hyperpolarizing prepulse in the neurone of a 15-day-old rat displaying the fast A-current.

Similar articles

Cited by

References

    1. Bayliss DA, Viana F, Bellingham MC, Berger AJ. Characteristics and postnatal development of a hyperpolarization-activated inward current in rat hypoglossal motoneurons in vitro. Journal of Neurophysiology. 1994;71:119–128. - PubMed
    1. Bordey A, Feltz P, Trouslard J. Kinetics of A-currents in sympathetic preganglionic neurons and glial cells. NeuroReport. 1995;7:37–40. - PubMed
    1. Bottaro B, Cutler LS. An electrophysiological study of the postnatal development of the autonomic innervation of the rat submandibular salivary gland. Archives of Oral Biology. 1984;29:237–242. - PubMed
    1. Bylund DB, Martinez JR, Camden J, Jones SB. Autonomic receptors in the developing submandibular glands of neonatal rats. Archives of Oral Biology. 1982;27:945–950. - PubMed
    1. Carrier GO. Whole-cell and perforated patch recordings of four distinct K+ currents in acutely dispersed coeliac-superior mesenteric ganglia neurones of adult rats. Brain Research. 1995;701:1–12. - PubMed

Publication types

MeSH terms

Substances

LinkOut - more resources