

Altered immune responses in mice with concomitant Schistosoma mansoni and Plasmodium chabaudi infections
- PMID: 9784518
- PMCID: PMC108644
- DOI: 10.1128/IAI.66.11.5167-5174.1998
Altered immune responses in mice with concomitant Schistosoma mansoni and Plasmodium chabaudi infections
Abstract
Mixed parasitic infections are common in many parts of the world. However, little is known about how concurrent infections affect the immunity to and/or pathogenesis of each other. Protection and elimination of blood-stage Plasmodium chabaudi chabaudi AS in resistant mice are characterized by a sequential activation of CD4(+) Th1 and Th2 cells. The patent egg-laying stage of the murine model of Schistosoma mansoni is associated with a strong Th2 response to both Schistosoma and unrelated antigens. In this study, we investigated how infection of mice with S. mansoni would affect the immune response to and pathogenesis of a P. chabaudi infection. C57BL/6 mice infected with S. mansoni for 8 weeks were infected with blood-stage P. chabaudi. Malaria parasitemias were significantly higher in these mice than in mice infected with P. chabaudi only. In doubly infected mice, both spleen cell proliferative and Th2 responses to S. mansoni soluble egg antigen (SEA) or anti-CD3 were suppressed up to 1 month after the malaria infection. Findings for SEA-specific immunoglobulin M (IgM) and IgG serum antibody levels were similar. No significant effects were seen on P. chabaudi-induced gamma interferon responses. However, tumor necrosis factor alpha (TNF-alpha) production was significantly lower in double-infected mice. Thus, a defect in TNF-alpha production might contribute to the increased malaria parasitemias seen in S. mansoni-P. chabaudi-infected mice. Taken together, our data show that schistosoma and malaria infections profoundly affect each other, findings which might have implications for the development of vaccines.
Figures

 ).
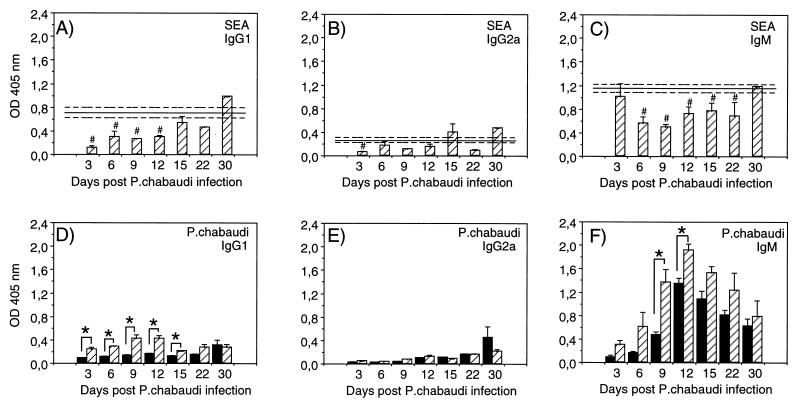
Anti-SEA (A to C) and anti-P. chabaudi (D to F)
antibodies were measured by ELISA. IgG1 (A and D), IgG2a (B and E), and
IgM (C and F) levels were determined and are presented as absorbance
(OD) at 405 nm. Results shown were obtained from serum dilutions of
1:1,000 for SEA-specific IgG1 and IgG2a, 1:10,000 for SEA-specific IgM,
and 1:1,000 for P. chabaudi-specific IgG1, IgG2a,
and IgM antibodies. Bars represent mean OD ± SEM for three to
five mice, and solid lines represent pooled data from control animals
infected with S. mansoni only assayed in parallel at
each time point ± SEM (−−−). #, statistically significant
differences (P < 0.05) between mice with S.
mansoni infection only and mice with concurrent S.
mansoni-P. chabaudi infection; ∗, statistically
significant differences (P < 0.05) between mice with
P. chabaudi infection only and mice with concurrent
S. mansoni-P. chabaudi infection.
).
Anti-SEA (A to C) and anti-P. chabaudi (D to F)
antibodies were measured by ELISA. IgG1 (A and D), IgG2a (B and E), and
IgM (C and F) levels were determined and are presented as absorbance
(OD) at 405 nm. Results shown were obtained from serum dilutions of
1:1,000 for SEA-specific IgG1 and IgG2a, 1:10,000 for SEA-specific IgM,
and 1:1,000 for P. chabaudi-specific IgG1, IgG2a,
and IgM antibodies. Bars represent mean OD ± SEM for three to
five mice, and solid lines represent pooled data from control animals
infected with S. mansoni only assayed in parallel at
each time point ± SEM (−−−). #, statistically significant
differences (P < 0.05) between mice with S.
mansoni infection only and mice with concurrent S.
mansoni-P. chabaudi infection; ∗, statistically
significant differences (P < 0.05) between mice with
P. chabaudi infection only and mice with concurrent
S. mansoni-P. chabaudi infection.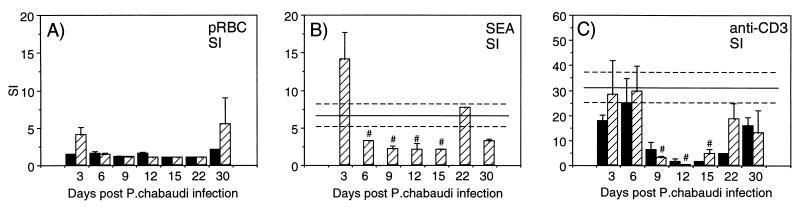
 ).
Cultures were stimulated with pRBC (A), SEA (B), or anti-CD3 (C). Bars
represent mean SI for three to five mice ± SEM, and solid lines
represent pooled data from S. mansoni-only-infected
control animals assayed in parallel at each time point ± SEM
(−−−). Note the different scales on the y axes. #,
statistically significant differences (P < 0.05)
between mice with S. mansoni infection only and mice
with concurrent S. mansoni-P. chabaudi
infection.
).
Cultures were stimulated with pRBC (A), SEA (B), or anti-CD3 (C). Bars
represent mean SI for three to five mice ± SEM, and solid lines
represent pooled data from S. mansoni-only-infected
control animals assayed in parallel at each time point ± SEM
(−−−). Note the different scales on the y axes. #,
statistically significant differences (P < 0.05)
between mice with S. mansoni infection only and mice
with concurrent S. mansoni-P. chabaudi
infection. ). IL-4
(A and B) and IL-5 (C and D) were measured in the SN from 72-h spleen
cell cultures stimulated with SEA (A and C) or anti-CD3 (B and D). Bars
represent mean values from three to five mice ± SEM, and solid
lines represent pooled data from S.
mansoni-only-infected control animals assayed in parallel at each
time point ± SEM (−−−). Note the different scales on the
y axes of panels C and D. #, statistically significant
differences (P < 0.05) between mice with S.
mansoni infection only and mice with concurrent S.
mansoni-P. chabaudi infection.
). IL-4
(A and B) and IL-5 (C and D) were measured in the SN from 72-h spleen
cell cultures stimulated with SEA (A and C) or anti-CD3 (B and D). Bars
represent mean values from three to five mice ± SEM, and solid
lines represent pooled data from S.
mansoni-only-infected control animals assayed in parallel at each
time point ± SEM (−−−). Note the different scales on the
y axes of panels C and D. #, statistically significant
differences (P < 0.05) between mice with S.
mansoni infection only and mice with concurrent S.
mansoni-P. chabaudi infection.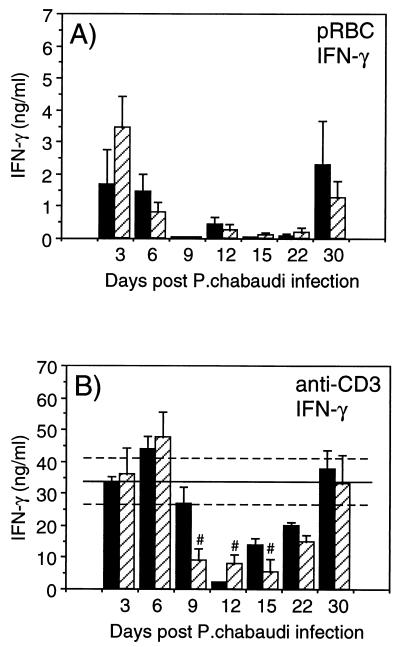 ).
IFN-γ was measured in the SN from 72-h spleen cell cultures
stimulated with pRBC (A) or anti-CD3 (B). Bars represent mean levels
for three to five mice ± SEM, and solid lines represent pooled
data from S. mansoni-only-infected control animals
assayed in parallel at each time point ± SEM (−−−). Note the
different scales on the y axes. #, statistically significant
differences (P < 0.05) between mice with S.
mansoni infection only and mice with concurrent S.
mansoni-P. chabaudi infection.
).
IFN-γ was measured in the SN from 72-h spleen cell cultures
stimulated with pRBC (A) or anti-CD3 (B). Bars represent mean levels
for three to five mice ± SEM, and solid lines represent pooled
data from S. mansoni-only-infected control animals
assayed in parallel at each time point ± SEM (−−−). Note the
different scales on the y axes. #, statistically significant
differences (P < 0.05) between mice with S.
mansoni infection only and mice with concurrent S.
mansoni-P. chabaudi infection.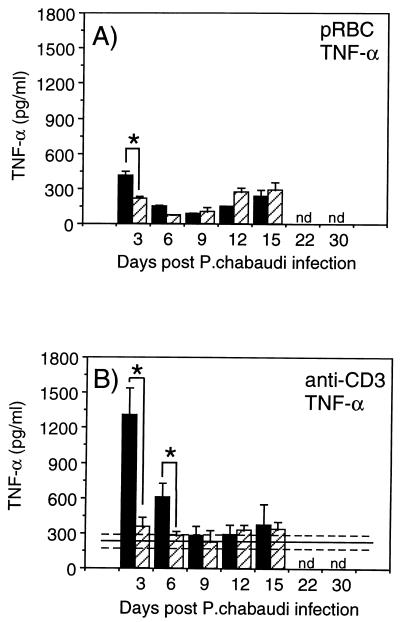 ).
Cultures were stimulated with pRBC (A) or anti-CD3 (B). Bars represent
mean levels for three to five mice ± SEM, and solid lines
represent pooled data from S. mansoni-only-infected
control animals assayed in parallel at each time point ± SEM
(−−−). ∗, represents statistically significant differences
(P < 0.05) between mice with P.
chabaudi infection only and mice with concurrent S.
mansoni-P. chabaudi infection. nd, not determined.
).
Cultures were stimulated with pRBC (A) or anti-CD3 (B). Bars represent
mean levels for three to five mice ± SEM, and solid lines
represent pooled data from S. mansoni-only-infected
control animals assayed in parallel at each time point ± SEM
(−−−). ∗, represents statistically significant differences
(P < 0.05) between mice with P.
chabaudi infection only and mice with concurrent S.
mansoni-P. chabaudi infection. nd, not determined.References
-
- Abdel-Wahab M F, Powers K G, Mahmoud S S, Good W C. Suppression of schistosome granuloma formation by malaria in mice. Am J Trop Med Hyg. 1974;23:915–918. - PubMed
-
- Ahvazi B C, Jacobs P, Stevenson M M. Role of macrophage-derived nitric oxide in suppression of lymphocyte proliferation during blood-stage malaria. J Leukoc Biol. 1995;58:23–31. - PubMed
-
- Clark I A, Hunt N H, Butcher G A, Cowden W B. Inhibition of murine malaria (Plasmodium chabaudi) in vitro by recombinant interferon-γ or tumor necrosis factor, and its enhancement by butylated hydroxyanisole. J Immunol. 1987;139:3493–3496. - PubMed
Publication types
MeSH terms
Substances
LinkOut - more resources
Full Text Sources
Medical
Research Materials
